Estimated zip code population in 2022: 9,218 Zip code population in 2010: 5,887 Zip code population in 2000: 3,236
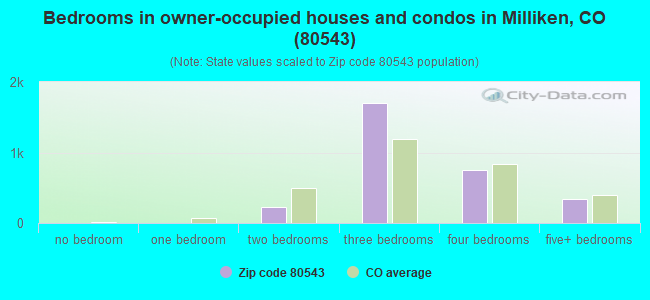
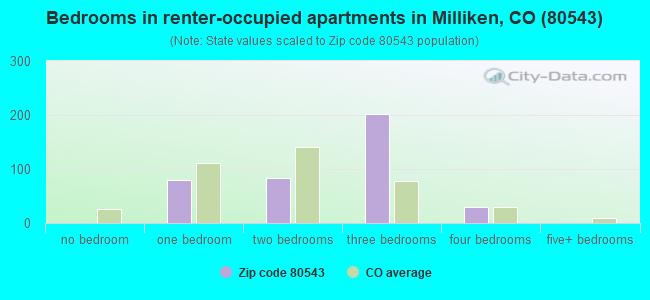
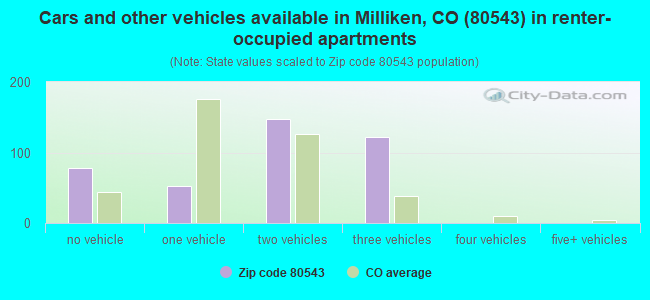
Houses and condos: 3,447 Renter-occupied apartments: 394
% of renters here:
12%
State:
34%
March 2022 cost of living index in zip code 80543: 102.0 (near average, U.S. average is 100)
Land area: 31.5 sq. mi. Water area: 0.3 sq. mi.
Population density: 292 people per square mile
(very low).
OSM Map
General Map
Google Map
MSN Map
OSM Map
General Map
Google Map
MSN Map
OSM Map
General Map
Google Map
MSN Map
OSM Map
General Map
Google Map
MSN Map
Please wait while loading the map...
Real estate property taxes paid for housing units in 2022:
This zip code:
0.5% ($2,324)
Colorado:
0.5% ($2,422)
Median real estate property taxes paid for housing units with mortgages in 2022: $2,359 (0.5%) Median real estate property taxes paid for housing units with no mortgage in 2022: $2,094 (0.4%)
Business Search- 14 Million verified businesses
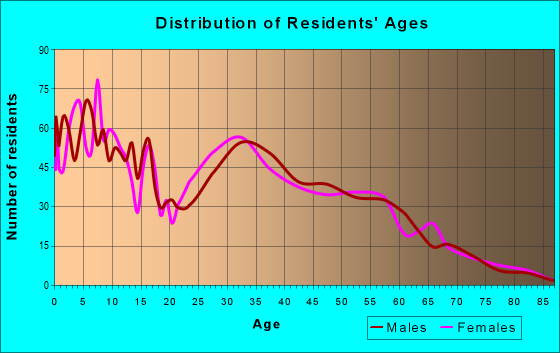
Males: 4,843
(52.5%)
Females: 4,374
(47.5%)
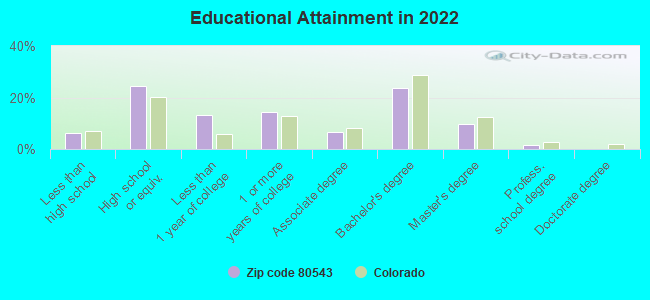
For population 25 years and over in 80543:
High school or higher: 92.5%
Bachelor's degree or higher: 34.6%
Graduate or professional degree: 11.3%
Unemployed: 2.4%
Mean travel time to work (commute): 31.9 minutes
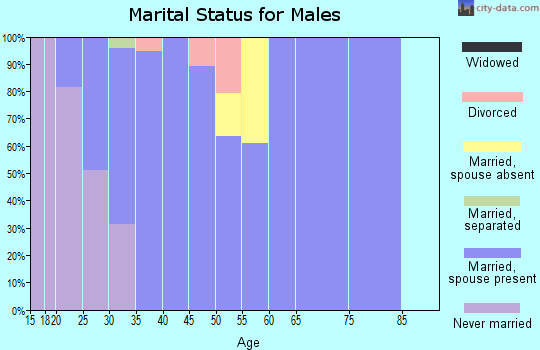
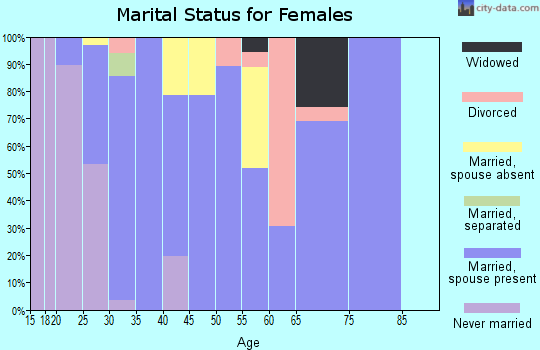
For population 15 years and over in 80543:
Never married: 19.7%
Now married: 67.1%
Separated: 0.7%
Widowed: 4.3%
Divorced: 8.2%
Zip code 80543 compared to state average:
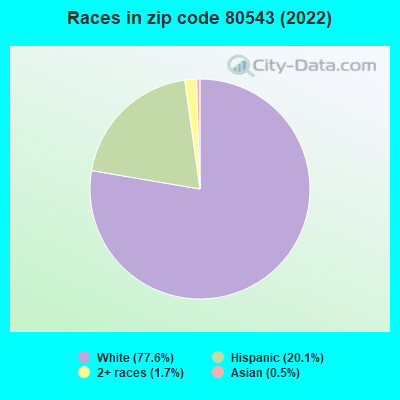
Black race population percentage significantly below state average.
Median age below state average.
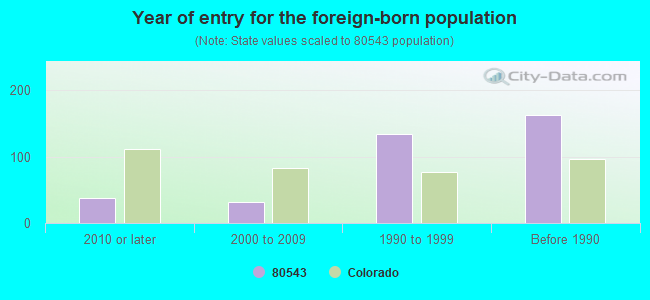
Foreign-born population percentage significantly below state average.
Renting percentage significantly below state average.
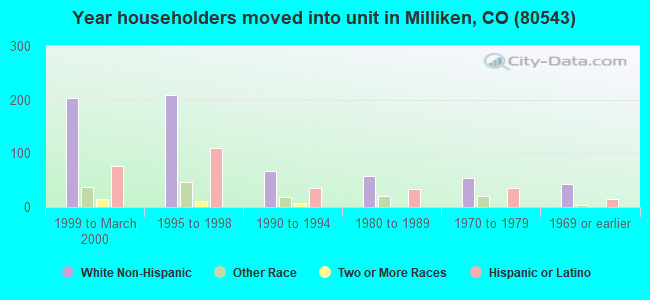
Length of stay since moving in significantly above state average.
Averages for the 2020 tax year for zip code 80543, filed in 2021:
Average Adjusted Gross Income (AGI) in 2020: $68,523 (Individual Income Tax Returns)
Here:
$68,523
State:
$89,260
Salary/wage: $61,860 (reported on 90.0% of returns)
Here:
$61,860
State:
$70,330
(% of AGI for various income ranges: 1214.5% for AGIs below $25k, 3939.9% for AGIs $25k-50k, 7074.0% for AGIs $50k-75k, 9952.9% for AGIs $75k-100k, 18151.3% for AGIs $100k-200k, 53836.7% for AGIs over 200k)
Taxable interest for individuals: $609 (reported on 20.0% of returns)
This zip code:
$609
Colorado:
$2,176
(% of AGI for various income ranges: 4.8% for AGIs below $25k, 7.2% for AGIs $25k-50k, 11.3% for AGIs $50k-75k, 12.0% for AGIs $75k-100k, 31.7% for AGIs $100k-200k, 466.7% for AGIs over 200k)
Ordinary dividends: $2,243 (reported on 10.3% of returns)
Here:
$2,243
State:
$8,820
(% of AGI for various income ranges: 13.6% for AGIs below $25k, 8.2% for AGIs $25k-50k, 24.2% for AGIs $50k-75k, 22.7% for AGIs $75k-100k, 77.2% for AGIs $100k-200k, 573.3% for AGIs over 200k)
Net capital gain/loss in AGI: +$11,941 (reported on 10.8% of returns)
Here:
+$11,941
State:
+$37,276
(% of AGI for various income ranges: 21.7% for AGIs below $25k, 13.4% for AGIs $25k-50k, 42.4% for AGIs $50k-75k, 38.4% for AGIs $75k-100k, 286.4% for AGIs $100k-200k, 10743.3% for AGIs over 200k)
Profit/loss from business: +$11,321 (reported on 15.4% of returns)
Here:
+$11,321
State:
+$15,295
(% of AGI for various income ranges: 140.0% for AGIs below $25k, 94.2% for AGIs $25k-50k, 271.1% for AGIs $50k-75k, 185.8% for AGIs $75k-100k, 444.3% for AGIs $100k-200k, 2880.0% for AGIs over 200k)
Taxable individual retirement arrangement distribution: $15,065 (reported on 5.6% of returns)
80543:
$15,065
Colorado:
$23,785
(% of AGI for various income ranges: 51.2% for AGIs below $25k, 60.9% for AGIs $25k-50k, 73.1% for AGIs $50k-75k, 156.4% for AGIs $75k-100k, 320.0% for AGIs $100k-200k)
Total itemized deductions: $24,461 (reported on 11.2% of returns)
Here:
$24,461
State:
$35,141
(% of AGI for various income ranges: 158.1% for AGIs $25k-50k, 427.3% for AGIs $50k-75k, 514.4% for AGIs $75k-100k, 753.4% for AGIs $100k-200k, 5256.7% for AGIs over 200k)
Charity contributions: $4,058 (reported on 5.9% of returns)
Here:
$4,058
State:
$12,103
(% of AGI for various income ranges: 7.2% for AGIs $25k-50k, 17.4% for AGIs $50k-75k, 25.3% for AGIs $75k-100k, 112.1% for AGIs $100k-200k, 573.3% for AGIs over 200k)
Taxes paid: $6,243 (reported on 11.2% of returns)
80543:
$6,243
State:
$7,710
(% of AGI for various income ranges: 31.8% for AGIs $25k-50k, 101.9% for AGIs $50k-75k, 143.3% for AGIs $75k-100k, 228.9% for AGIs $100k-200k, 946.7% for AGIs over 200k)
Earned income credit: $2,308 (reported on 11.7% of returns)
Here:
$2,308
State:
$2,053
(% of AGI for various income ranges: 90.6% for AGIs below $25k, 65.3% for AGIs $25k-50k)
Percentage of individuals using paid preparers for their 2020 taxes: 95.4%
Here:
95%
State:
93%
(% for various income ranges: 93.3% for AGIs below $25k, 95.6% for AGIs $25k-50k, 96.3% for AGIs $50k-75k, 94.9% for AGIs $75k-100k, 96.2% for AGIs $100k-200k, 100.0% for AGIs over 200k)
Averages for the 2012 tax year for zip code 80543, filed in 2013:
Average Adjusted Gross Income (AGI) in 2012: $50,216 (Individual Income Tax Returns)
Here:
$50,216
State:
$69,103
Salary/wage: $45,989 (reported on 91.3% of returns)
Here:
$45,989
State:
$54,794
(% of AGI for various income ranges: 83.2% for AGIs below $25k, 86.8% for AGIs $25k-50k, 88.6% for AGIs $50k-75k, 87.5% for AGIs $75k-100k, 81.1% for AGIs $100k-200k, 52.5% for AGIs over 200k)
Taxable interest for individuals: $456 (reported on 20.5% of returns)
This zip code:
$456
Colorado:
$1,971
(% of AGI for various income ranges: 0.5% for AGIs below $25k, 0.1% for AGIs $25k-50k, 0.2% for AGIs $50k-75k, 0.3% for AGIs $100k-200k, 0.1% for AGIs over 200k)
Ordinary dividends: $1,059 (reported on 11.0% of returns)
Here:
$1,059
State:
$7,140
(% of AGI for various income ranges: 0.2% for AGIs below $25k, 0.2% for AGIs $25k-50k, 0.2% for AGIs $50k-75k, 0.2% for AGIs $75k-100k, 0.5% for AGIs $100k-200k)
Net capital gain/loss in AGI: +$2,384 (reported on 9.5% of returns)
Here:
+$2,384
State:
+$23,009
(% of AGI for various income ranges: 2.3% for AGIs $100k-200k)
Profit/loss from business: +$7,641 (reported on 14.8% of returns)
Here:
+$7,641
State:
+$13,514
(% of AGI for various income ranges: 5.9% for AGIs below $25k, 2.2% for AGIs $25k-50k, 2.2% for AGIs $50k-75k, 2.0% for AGIs $75k-100k, 2.0% for AGIs $100k-200k)
Taxable individual retirement arrangement distribution: $13,100 (reported on 7.6% of returns)
80543:
$13,100
Colorado:
$17,927
(% of AGI for various income ranges: 2.5% for AGIs below $25k, 2.4% for AGIs $25k-50k, 1.5% for AGIs $50k-75k, 1.9% for AGIs $75k-100k, 2.7% for AGIs $100k-200k)
Total itemized deductions: $18,130 (23% of AGI, reported on 35.0% of returns)
Here:
$18,130
State:
$24,621
Here:
23.4% of AGI
State:
18.5% of AGI
(% of AGI for various income ranges: 8.2% for AGIs below $25k, 13.5% for AGIs $25k-50k, 12.4% for AGIs $50k-75k, 12.7% for AGIs $75k-100k, 14.6% for AGIs $100k-200k, 9.5% for AGIs over 200k)
Charity contributions: $2,388 (reported on 25.9% of returns)
Here:
$2,388
State:
$4,449
(% of AGI for various income ranges: 0.4% for AGIs below $25k, 0.9% for AGIs $25k-50k, 1.1% for AGIs $50k-75k, 1.1% for AGIs $75k-100k, 2.0% for AGIs $100k-200k, 1.4% for AGIs over 200k)
Taxes paid: $4,297 (reported on 35.0% of returns)
80543:
$4,297
State:
$7,641
(% of AGI for various income ranges: 1.1% for AGIs below $25k, 2.0% for AGIs $25k-50k, 2.7% for AGIs $50k-75k, 3.3% for AGIs $75k-100k, 4.3% for AGIs $100k-200k, 4.1% for AGIs over 200k)
Earned income credit: $2,251 (reported on 20.2% of returns)
Here:
$2,251
State:
$2,095
(% of AGI for various income ranges: 7.4% for AGIs below $25k, 1.6% for AGIs $25k-50k)
Percentage of individuals using paid preparers for their 2012 taxes: 50.2%
Here:
50%
State:
49%
(% for various income ranges: 45.2% for AGIs below $25k, 48.6% for AGIs $25k-50k, 50.0% for AGIs $50k-75k, 56.2% for AGIs $75k-100k, 59.1% for AGIs $100k-200k, 100.0% for AGIs over 200k)
Averages for the 2004 tax year for zip code 80543, filed in 2005:
Average Adjusted Gross Income (AGI) in 2004: $42,700 (Individual Income Tax Returns)
Here:
$42,700
State:
$55,014
Salary/wage: $40,766 (reported on 90.6% of returns)
Here:
$40,766
State:
$46,010
(% of AGI for various income ranges: 128.5% for AGIs below $10k, 84.2% for AGIs $10k-25k, 88.5% for AGIs $25k-50k, 90.8% for AGIs $50k-75k, 90.6% for AGIs $75k-100k, 68.8% for AGIs over 100k)
Taxable interest for individuals: $764 (reported on 29.9% of returns)
This zip code:
$764
Colorado:
$2,127
(% of AGI for various income ranges: 4.1% for AGIs below $10k, 0.9% for AGIs $10k-25k, 0.5% for AGIs $25k-50k, 0.4% for AGIs $50k-75k, 0.4% for AGIs $75k-100k, 0.5% for AGIs over 100k)
Taxable dividends: $738 (reported on 14.3% of returns)
Here:
$738
State:
$3,782
(% of AGI for various income ranges: 2.6% for AGIs below $10k, 0.3% for AGIs $10k-25k, 0.2% for AGIs $25k-50k, 0.1% for AGIs $50k-75k, 0.1% for AGIs $75k-100k, 0.4% for AGIs over 100k)
Net capital gain/loss: +$4,488 (reported on 11.9% of returns)
Here:
+$4,488
State:
+$17,882
(% of AGI for various income ranges: 0.7% for AGIs below $10k, 0.7% for AGIs $10k-25k, 0.3% for AGIs $25k-50k, 0.4% for AGIs $50k-75k, 0.1% for AGIs $75k-100k, 6.0% for AGIs over 100k)
Profit/loss from business: +$4,475 (reported on 17.0% of returns)
Here:
+$4,475
State:
+$11,247
(% of AGI for various income ranges: 5.5% for AGIs below $10k, 4.6% for AGIs $10k-25k, 2.5% for AGIs $25k-50k, 1.5% for AGIs $50k-75k, 0.5% for AGIs $75k-100k, 1.0% for AGIs over 100k)
IRA payment deduction: $2,946 (reported on 1.7% of returns)
80543:
$2,946
Colorado:
$2,947
Total itemized deductions: $16,758 (27% of AGI, reported on 47.7% of returns)
Here:
$16,758
State:
$20,560
Here:
27.1% of AGI
State:
21.4% of AGI
(% of AGI for various income ranges: 25.0% for AGIs below $10k, 12.1% for AGIs $10k-25k, 20.2% for AGIs $25k-50k, 20.3% for AGIs $50k-75k, 19.3% for AGIs $75k-100k, 15.5% for AGIs over 100k)
Charity contributions deductions: $1,586 (2% of AGI, reported on 37.9% of returns)
Here:
$1,586
State:
$3,518
Here:
2.5% of AGI
State:
3.4% of AGI
(% of AGI for various income ranges: 1.1% for AGIs $10k-25k, 1.2% for AGIs $25k-50k, 1.5% for AGIs $50k-75k, 1.6% for AGIs $75k-100k, 1.6% for AGIs over 100k)
Total tax: $4,798 (reported on 72.6% of returns)
80543:
$4,798
State:
$9,173
(% of AGI for various income ranges: 4.3% for AGIs below $10k, 3.3% for AGIs $10k-25k, 5.2% for AGIs $25k-50k, 7.0% for AGIs $50k-75k, 9.3% for AGIs $75k-100k, 16.5% for AGIs over 100k)
Earned income credit: $1,915 (reported on 16.5% of returns)
Here:
$1,915
State:
$1,595
Percentage of individuals using paid preparers for their 2004 taxes: 56.4%
Here:
56%
State:
55%
(% for various income ranges: 44.0% for AGIs below $10k, 56.2% for AGIs $10k-25k, 58.5% for AGIs $25k-50k, 58.9% for AGIs $50k-75k, 58.2% for AGIs $75k-100k, 69.0% for AGIs over 100k)
Likely homosexual households (counted as self-reported same-sex unmarried-partner households)
Lesbian couples: 0.0% of all households
Gay men: 0.3% of all households
Household received Food Stamps/SNAP in the past 12 months: 216 Household did not receive Food Stamps/SNAP in the past 12 months: 3,177
Women who had a birth in the past 12 months: 296 (305 now married, 0 unmarried) Women who did not have a birth in the past 12 months: 1,934 (1,313 now married, 607 unmarried)
Housing units in zip code 80543 with a mortgage: 2,638 (324 second mortgage, 92 home equity loan, 244 both second mortgage and home equity loan) Median monthly owner costs for units with a mortgage: $2,002 Median monthly owner costs for units without a mortgage: $600
Residents with income below the poverty level in 2022:
This zip code:
2.9%
Whole state:
9.4%
Residents with income below 50% of the poverty level in 2022:
This zip code:
1.4%
Whole state:
4.6%
Median number of rooms in houses and condos:
Here:
6.1
State:
6.8
Median number of rooms in apartments:
Here:
4.6
State:
4.0
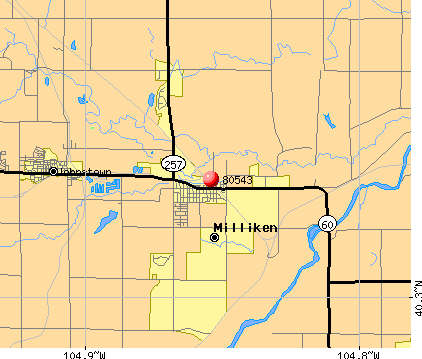
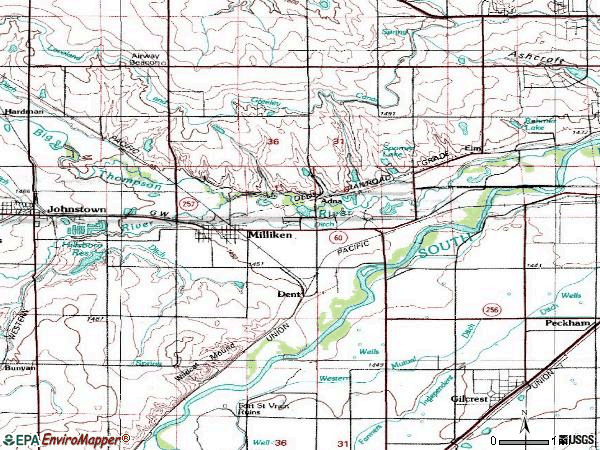
Notable locations in this zip code not listed on our city pages
Notable locations in zip code 80543: Central Weld Sanitary Landfill (A), Milliken Fire Protection District Station 1 (B). Display/hide their locations on the map
Size of family households: 969 2-persons, 868 3-persons, 365 4-persons, 157 5-persons, 51 6-persons, 163 7-or-more-persons
Size of nonfamily households: 470 1-person, 334 2-persons
1,867 married couples with children.
265 single-parent households (164 men, 101 women).
90.5% of residents of 80543 zip code speak English at home.
8.3% of residents speak Spanish at home (69% very well, 26% well, 4% not well).
0.2% of residents speak other Indo-European language at home (100% very well).
0.5% of residents speak Asian or Pacific Island language at home (71% well, 29% not well).
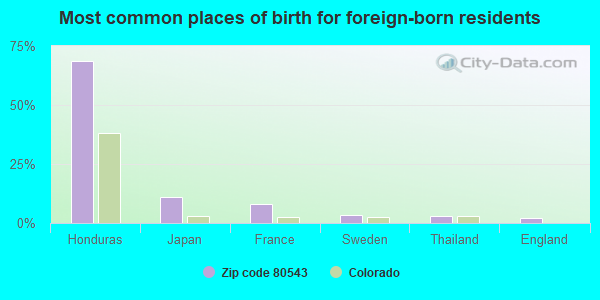
Foreign born population: 330 (3.6%) (42.9% of them are naturalized citizens)
This zip code:
3.6%
Whole state:
9.5%
69%Honduras
11%Japan
8%France
3%Sweden
3%Thailand
2%England
20%German
14%American
6%Italian
5%English
4%Irish
4%Scottish
2%European
Year of entry for the foreign-born population
382010 or later
312000 to 2009
1351990 to 1999
163Before 1990
Major facilities with environmental interests located in this zip code:
AGGREGATE INDUSTRIES (22434 STATE HIGHWAY 60 in MILLIKEN, CO)
AIR MINOR (AIRS/AFS) National Pollutant Discharge Elimination System NON-MAJOR (Tracking pollutant discharge elimination systems) - permit Business SIC classification: CONSTRUCTION SAND AND GRAVEL Alternative names: MILLIKEN, MILLIKEN SAND AND GRAVEL
ALL AMERICAN HOMES OF COLORADO, LLC (3333 CENTER DRIVE in MILLIKEN, CO)
AIR MINOR (AIRS/AFS) CRITERIA AND HAZARDOUS AIR POLLUTANT INVENTORY (Inventory of air pollution sources) TRI REPORTER (Tracking of toxic chemicals releasing facilities) Business SIC classification: PREFABRICATED WOOD BUILDINGS AND COMPONENTS; PREFABRICATED METAL BUILDINGS AND COMPONENTS Alternative names: ALL AMERICAN HOMES OF COLORADO L.L.C.
ALKERLAND NURSERY (22465 STATE HWY 60 in MILLIKEN, CO)
(Resource Conservation and Recovery Act (tracking hazardous waste))
KERR-MCGEE - BATTERY# 61243 (SWSW SEC 3 T3N R67W in MILLIKEN, 2.9 MI S OF, CO)
AIR MINOR (AIRS/AFS) CRITERIA AND HAZARDOUS AIR POLLUTANT INVENTORY (Inventory of air pollution sources) Business SIC classification: NATURAL GAS LIQUIDS Alternative names: KERR-MCGEE TANK BATTERY #61243
KERR-MCGEE - BATTERY# 61016 (NENE SEC 19 T4N R66W in MILLIKEN, 1.4 MI SE OF, CO)
AIR MINOR (AIRS/AFS) CRITERIA AND HAZARDOUS AIR POLLUTANT INVENTORY (Inventory of air pollution sources) Business SIC classification: NATURAL GAS LIQUIDS Alternative names: KERR-MCGEE TANK BATTERY #61016
KERR-MCGEE - BATTERY# 61714 (NESE SEC 34 T4N R67W in MILLIKEN, 1.5 MI S OF, CO)
AIR MINOR (AIRS/AFS) CRITERIA AND HAZARDOUS AIR POLLUTANT INVENTORY (Inventory of air pollution sources) Business SIC classification: NATURAL GAS LIQUIDS Alternative names: KERR-MCGEE TANK BATTERY #61714
AIR MINOR (AIRS/AFS) CRITERIA AND HAZARDOUS AIR POLLUTANT INVENTORY (Inventory of air pollution sources) Business SIC classification: NATURAL GAS LIQUIDS Alternative names: KERR-MCGEE TANK BATTERY #61747
KERR-MCGEE - BATTERY# 61713 (SWSE SEC 34 T4N R67W in MILLIKEN, 1.8 MI S OF, CO)
AIR MINOR (AIRS/AFS) CRITERIA AND HAZARDOUS AIR POLLUTANT INVENTORY (Inventory of air pollution sources) Business SIC classification: NATURAL GAS LIQUIDS Alternative names: KERR-MCGEE TANK BATTERY #61713
AIR MINOR (AIRS/AFS) CRITERIA AND HAZARDOUS AIR POLLUTANT INVENTORY (Inventory of air pollution sources) Business SIC classification: NATURAL GAS LIQUIDS Alternative names: KERR-MCGEE TANK BATTERY #60225
KERR-MCGEE - BATTERY# 61539 (NESE SEC 34 T4N R67W in MILLIKEN, 1.5 MI S OF, CO)
AIR MINOR (AIRS/AFS) CRITERIA AND HAZARDOUS AIR POLLUTANT INVENTORY (Inventory of air pollution sources) Business SIC classification: NATURAL GAS LIQUIDS Alternative names: KERR-MCGEE BATTERY #61539 SEE 123.4096, KERR-MCGEE TANK BATTERY #61539
KERR-MCGEE - BATTERY# 61215 (NWNW SEC 3 T3N R67W in MILLIKEN, 2.1 MI S OF, CO)
AIR MINOR (AIRS/AFS) CRITERIA AND HAZARDOUS AIR POLLUTANT INVENTORY (Inventory of air pollution sources) Business SIC classification: NATURAL GAS LIQUIDS Alternative names: KERR-MCGEE TANK BATTERY #61215
HALL-IRWIN CORPORATION - CENTENNIAL SITE (NW/4 SEC 13 T4N R67W HWY 60 ON CR 23 (ALICE AVE) in MILLIKEN, CO)
AIR MINOR (AIRS/AFS) CRITERIA AND HAZARDOUS AIR POLLUTANT INVENTORY (Inventory of air pollution sources) Business SIC classification: CONSTRUCTION SAND AND GRAVEL
BESTWAY CONCRETE CO (NE SEC 12 T4N R67W in MILLIKEN, CO)
AIR MINOR (AIRS/AFS) Business SIC classification: READY-MIXED CONCRETE
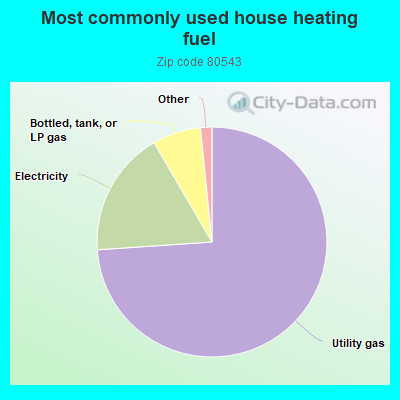
74.0%Utility gas
17.7%Electricity
6.8%Bottled, tank, or LP gas
0.9%Solar energy
0.7%Fuel oil, kerosene, etc.
Population in 1990: 2,632. Population change in the 1990s: +604 (+22.9%).
Place of birth for U.S.-born residents:
This state: 5,688
Northeast: 308
Midwest: 1,070
South: 865
West: 894
41% of the 80543 zip code residents lived in the same house 5 years ago. Out of people who lived in different houses, 33% lived in this county. Out of people who lived in different counties, 50% lived in Colorado.
91% of the 80543 zip code residents lived in the same house 1 year ago. Out of people who lived in different houses, 8% moved from this county. Out of people who lived in different houses, 49% moved from different county within same state. Out of people who lived in different houses, 49% moved from different state.
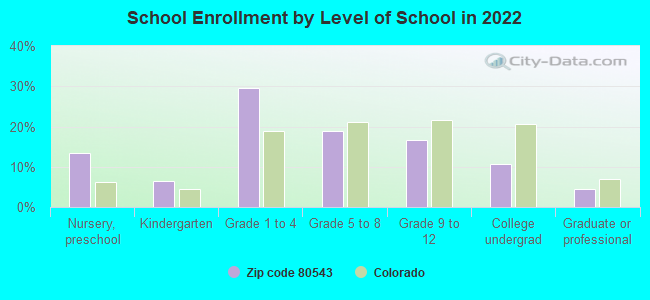
Private vs. public school enrollment:
Students in private schools in grades 1 to 8 (elementary and middle school): 91
Here:
10.4%
Colorado:
11.4%
Students in private schools in grades 9 to 12 (high school):
Here:
0.0%
Colorado:
8.5%
Students in private undergraduate colleges: 25
Here:
13.2%
Colorado:
14.0%
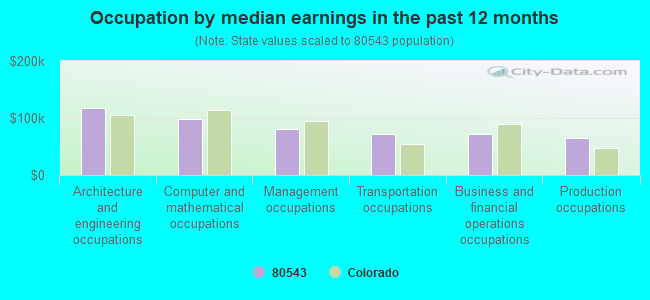
Occupation by median earnings in the past 12 months ($)
117,263Architecture and engineering occupations
97,834Computer and mathematical occupations
80,589Management occupations
72,123Transportation occupations
71,942Business and financial operations occupations
65,370Production occupations
Top industries in this zip code by the number of employees in 2005:
Construction: Poured Concrete Foundation and Structure Contractors (20-49 employees: 1 establishment, 5-9 employees: 1 establishment)
Construction: Site Preparation Contractors (20-49: 1, 1-4: 2)
Accommodation and Food Services: Caterers (20-49: 1)
Wholesale Trade: Service Establishment Equipment and Supplies Merchant Wholesalers (20-49: 1)
Educational Services: Elementary and Secondary Schools (10-19: 1)
Arts, Entertainment, and Recreation: Golf Courses and Country Clubs (5-9: 1, 1-4: 1)
Fatal accident statistics in 2014:
Fatal accident count: 3
Vehicles involved in fatal accidents: 4
Fatal accidents caused by drunken drivers: 2
Fatalities: 3
Persons involved in fatal accidents: 5
Pedestrians involved in fatal accidents: 0
Fatal accident statistics in 2013:
Fatal accident count: 1
Vehicles involved in fatal accidents: 1
Fatal accidents caused by drunken drivers: 0
Fatalities: 1
Persons involved in fatal accidents: 1
Pedestrians involved in fatal accidents: 0
Home Mortgage Disclosure Act Aggregated Statistics For Year 2009 (Based on 2 partial tracts)
A) FHA, FSA/RHS & VA Home Purchase Loans
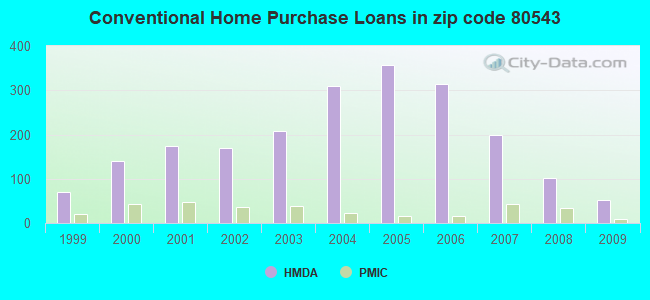
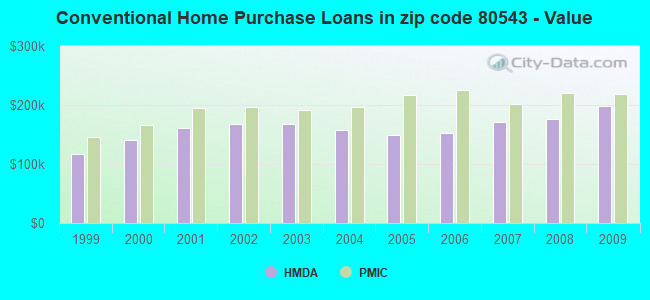
B) Conventional Home Purchase Loans
C) Refinancings
D) Home Improvement Loans
F) Non-occupant Loans on < 5 Family Dwellings (A B C & D)
G) Loans On Manufactured Home Dwelling (A B C & D)
Number
Average Value
Number
Average Value
Number
Average Value
Number
Average Value
Number
Average Value
Number
Average Value
LOANS ORIGINATED
93
$185,838
53
$197,917
254
$222,406
8
$83,202
11
$162,748
5
$67,546
APPLICATIONS APPROVED, NOT ACCEPTED
5
$207,384
7
$160,534
23
$219,327
2
$45,725
1
$164,380
3
$60,197
APPLICATIONS DENIED
9
$164,572
6
$205,137
67
$216,160
7
$39,359
6
$141,902
4
$90,365
APPLICATIONS WITHDRAWN
11
$168,010
6
$225,298
58
$219,929
2
$108,960
3
$127,143
0
$0
FILES CLOSED FOR INCOMPLETENESS
1
$184,350
1
$186,080
11
$219,102
1
$106,210
0
$0
0
$0
Aggregated Statistics For Year 2008 (Based on 2 partial tracts)
A) FHA, FSA/RHS & VA Home Purchase Loans
B) Conventional Home Purchase Loans
C) Refinancings
D) Home Improvement Loans
F) Non-occupant Loans on < 5 Family Dwellings (A B C & D)
G) Loans On Manufactured Home Dwelling (A B C & D)
Number
Average Value
Number
Average Value
Number
Average Value
Number
Average Value
Number
Average Value
Number
Average Value
LOANS ORIGINATED
85
$193,728
102
$176,219
124
$218,021
8
$64,536
28
$177,754
9
$61,836
APPLICATIONS APPROVED, NOT ACCEPTED
5
$207,904
14
$130,457
19
$208,566
2
$62,510
3
$132,353
5
$57,416
APPLICATIONS DENIED
18
$193,174
24
$180,357
102
$216,908
12
$58,097
7
$150,611
6
$95,985
APPLICATIONS WITHDRAWN
16
$201,097
20
$200,930
41
$216,500
3
$97,817
4
$135,800
2
$71,770
FILES CLOSED FOR INCOMPLETENESS
1
$252,360
3
$147,400
8
$193,391
1
$199,690
0
$0
1
$47,170
Aggregated Statistics For Year 2007 (Based on 2 partial tracts)
A) FHA, FSA/RHS & VA Home Purchase Loans
B) Conventional Home Purchase Loans
C) Refinancings
D) Home Improvement Loans
F) Non-occupant Loans on < 5 Family Dwellings (A B C & D)
G) Loans On Manufactured Home Dwelling (A B C & D)
Number
Average Value
Number
Average Value
Number
Average Value
Number
Average Value
Number
Average Value
Number
Average Value
LOANS ORIGINATED
27
$189,450
200
$170,509
162
$187,731
19
$54,453
38
$157,792
12
$60,075
APPLICATIONS APPROVED, NOT ACCEPTED
1
$181,740
28
$145,610
41
$162,678
5
$72,060
6
$115,953
6
$61,015
APPLICATIONS DENIED
2
$224,285
43
$147,957
175
$173,337
13
$63,980
21
$151,563
10
$55,391
APPLICATIONS WITHDRAWN
3
$170,167
30
$166,434
47
$203,966
2
$31,400
6
$121,403
2
$54,695
FILES CLOSED FOR INCOMPLETENESS
0
$0
2
$200,990
15
$213,075
1
$125,020
1
$152,220
0
$0
Aggregated Statistics For Year 2006 (Based on 2 partial tracts)
A) FHA, FSA/RHS & VA Home Purchase Loans
B) Conventional Home Purchase Loans
C) Refinancings
D) Home Improvement Loans
F) Non-occupant Loans on < 5 Family Dwellings (A B C & D)
G) Loans On Manufactured Home Dwelling (A B C & D)
Number
Average Value
Number
Average Value
Number
Average Value
Number
Average Value
Number
Average Value
Number
Average Value
LOANS ORIGINATED
21
$188,413
315
$152,698
227
$156,781
24
$62,221
53
$140,807
3
$42,543
APPLICATIONS APPROVED, NOT ACCEPTED
1
$331,070
33
$137,333
48
$164,524
5
$35,596
8
$159,098
4
$47,100
APPLICATIONS DENIED
4
$174,508
54
$157,096
194
$176,577
29
$101,420
18
$160,118
7
$66,603
APPLICATIONS WITHDRAWN
3
$196,983
52
$171,197
105
$177,915
7
$91,120
10
$147,305
1
$32,990
FILES CLOSED FOR INCOMPLETENESS
0
$0
3
$265,283
27
$187,403
1
$69,460
1
$169,300
0
$0
Aggregated Statistics For Year 2005 (Based on 2 partial tracts)
A) FHA, FSA/RHS & VA Home Purchase Loans
B) Conventional Home Purchase Loans
C) Refinancings
D) Home Improvement Loans
F) Non-occupant Loans on < 5 Family Dwellings (A B C & D)
G) Loans On Manufactured Home Dwelling (A B C & D)
Number
Average Value
Number
Average Value
Number
Average Value
Number
Average Value
Number
Average Value
Number
Average Value
LOANS ORIGINATED
16
$178,868
356
$149,641
266
$167,371
19
$62,708
57
$157,555
10
$83,116
APPLICATIONS APPROVED, NOT ACCEPTED
1
$123,280
32
$159,785
48
$160,231
5
$47,288
8
$151,899
1
$88,270
APPLICATIONS DENIED
3
$163,993
87
$124,545
195
$186,025
26
$65,115
22
$152,816
17
$68,111
APPLICATIONS WITHDRAWN
2
$196,935
63
$166,093
129
$186,623
9
$142,867
9
$179,331
3
$123,960
FILES CLOSED FOR INCOMPLETENESS
0
$0
10
$119,812
34
$214,922
1
$152,800
2
$134,715
1
$47,460
Aggregated Statistics For Year 2004 (Based on 2 partial tracts)
A) FHA, FSA/RHS & VA Home Purchase Loans
B) Conventional Home Purchase Loans
C) Refinancings
D) Home Improvement Loans
F) Non-occupant Loans on < 5 Family Dwellings (A B C & D)
G) Loans On Manufactured Home Dwelling (A B C & D)
Number
Average Value
Number
Average Value
Number
Average Value
Number
Average Value
Number
Average Value
Number
Average Value
LOANS ORIGINATED
33
$183,313
310
$156,851
297
$176,645
22
$56,985
59
$160,936
10
$58,372
APPLICATIONS APPROVED, NOT ACCEPTED
1
$223,710
38
$172,581
67
$173,899
3
$48,813
21
$164,351
4
$70,035
APPLICATIONS DENIED
3
$184,060
80
$134,365
199
$172,512
27
$58,491
41
$171,572
16
$65,242
APPLICATIONS WITHDRAWN
4
$178,125
38
$165,133
112
$180,867
4
$82,840
10
$190,946
3
$96,080
FILES CLOSED FOR INCOMPLETENESS
1
$111,130
9
$143,318
30
$203,197
3
$39,263
1
$336,280
2
$84,070
Aggregated Statistics For Year 2003 (Based on 2 partial tracts)
A) FHA, FSA/RHS & VA Home Purchase Loans
B) Conventional Home Purchase Loans
C) Refinancings
D) Home Improvement Loans
F) Non-occupant Loans on < 5 Family Dwellings (A B C & D)
Number
Average Value
Number
Average Value
Number
Average Value
Number
Average Value
Number
Average Value
LOANS ORIGINATED
55
$171,325
208
$168,307
494
$180,274
17
$25,416
43
$152,170
APPLICATIONS APPROVED, NOT ACCEPTED
1
$206,630
22
$138,899
66
$170,373
4
$31,038
8
$179,175
APPLICATIONS DENIED
5
$192,914
45
$122,616
154
$172,854
14
$24,537
11
$159,959
APPLICATIONS WITHDRAWN
7
$165,826
24
$177,824
101
$173,944
2
$42,250
7
$135,977
FILES CLOSED FOR INCOMPLETENESS
1
$111,420
5
$169,414
11
$224,495
1
$62,220
1
$177,400
Aggregated Statistics For Year 2002 (Based on 2 partial tracts)
A) FHA, FSA/RHS & VA Home Purchase Loans
B) Conventional Home Purchase Loans
C) Refinancings
D) Home Improvement Loans
F) Non-occupant Loans on < 5 Family Dwellings (A B C & D)
Number
Average Value
Number
Average Value
Number
Average Value
Number
Average Value
Number
Average Value
LOANS ORIGINATED
52
$168,264
169
$167,641
346
$176,715
25
$32,262
24
$135,114
APPLICATIONS APPROVED, NOT ACCEPTED
2
$103,170
20
$139,014
42
$174,384
5
$24,078
2
$152,080
APPLICATIONS DENIED
5
$184,810
27
$105,631
102
$157,754
16
$35,361
3
$149,427
APPLICATIONS WITHDRAWN
6
$175,183
20
$184,188
73
$158,766
5
$43,526
2
$166,550
FILES CLOSED FOR INCOMPLETENESS
1
$89,710
5
$161,716
32
$160,147
0
$0
0
$0
Aggregated Statistics For Year 2001 (Based on 2 partial tracts)
A) FHA, FSA/RHS & VA Home Purchase Loans
B) Conventional Home Purchase Loans
C) Refinancings
D) Home Improvement Loans
F) Non-occupant Loans on < 5 Family Dwellings (A B C & D)
Number
Average Value
Number
Average Value
Number
Average Value
Number
Average Value
Number
Average Value
LOANS ORIGINATED
37
$156,034
173
$161,693
291
$160,323
24
$31,376
17
$151,084
APPLICATIONS APPROVED, NOT ACCEPTED
1
$221,100
23
$128,695
36
$134,925
3
$44,857
2
$98,540
APPLICATIONS DENIED
1
$227,760
40
$114,436
111
$126,536
11
$23,363
8
$130,375
APPLICATIONS WITHDRAWN
2
$168,285
17
$179,054
76
$140,469
7
$51,347
1
$189,850
FILES CLOSED FOR INCOMPLETENESS
0
$0
6
$194,477
19
$155,438
0
$0
1
$178,560
Aggregated Statistics For Year 2000 (Based on 2 partial tracts)
A) FHA, FSA/RHS & VA Home Purchase Loans
B) Conventional Home Purchase Loans
C) Refinancings
D) Home Improvement Loans
F) Non-occupant Loans on < 5 Family Dwellings (A B C & D)
Number
Average Value
Number
Average Value
Number
Average Value
Number
Average Value
Number
Average Value
LOANS ORIGINATED
27
$138,805
139
$140,592
80
$131,163
27
$22,069
7
$105,424
APPLICATIONS APPROVED, NOT ACCEPTED
3
$71,193
25
$102,251
18
$98,171
6
$17,027
1
$55,560
APPLICATIONS DENIED
3
$143,253
49
$75,510
56
$94,427
14
$22,408
7
$75,327
APPLICATIONS WITHDRAWN
2
$134,280
15
$157,839
24
$101,676
3
$27,010
1
$114,600
FILES CLOSED FOR INCOMPLETENESS
1
$120,970
2
$150,055
14
$128,369
1
$32,410
0
$0
Aggregated Statistics For Year 1999 (Based on 1 partial tract)
A) FHA, FSA/RHS & VA Home Purchase Loans
B) Conventional Home Purchase Loans
C) Refinancings
D) Home Improvement Loans
F) Non-occupant Loans on < 5 Family Dwellings (A B C & D)
Detailed PMIC statistics for the following Tracts:0021.00
2003 - 2018 National Fire Incident Reporting System (NFIRS) incidents
According to the data from the years 2003 - 2018 the average number of fire incidents per year is 28. The highest number of reported fire incidents - 41 took place in 2006, and the least - 2 in 2003. The data has a rising trend.
When looking into fire subcategories, the most reports belonged to: Outside Fires (62.0%), and Structure Fires (26.3%).
Fire incident types reported to NFIRS in Zip Code 80543
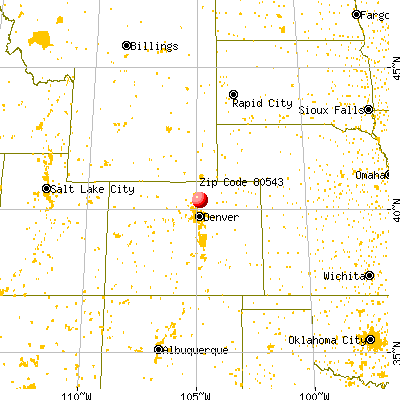


 Nearest zip codes: 80634, 80534, 80623, 80651, 80620, 80550.


 According to the data from the years 2003 - 2018 the average number of fire incidents per year is 28. The highest number of reported fire incidents - 41 took place in 2006, and the least - 2 in 2003. The data has a rising trend.
 When looking into fire subcategories, the most reports belonged to: Outside Fires (62.0%), and Structure Fires (26.3%).