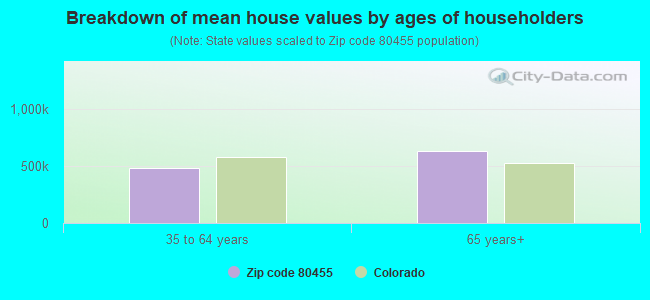
Estimated median house/condo value in 2022: $430,101
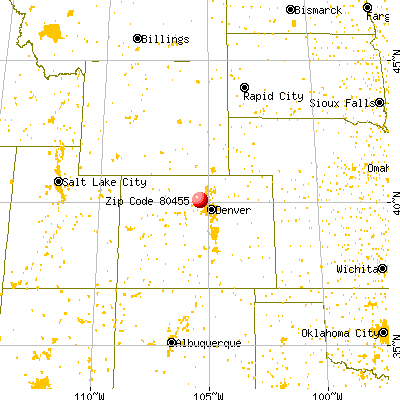
80455:
$430,101
Colorado:
$531,100
Median resident age:
This zip code:
58.0 years
Colorado median age:
37.7 years
Average household size:
This zip code:
1.9 people
Colorado:
2.4 people
Averages for the 2020 tax year for zip code 80455, filed in 2021:
Average Adjusted Gross Income (AGI) in 2020: $69,214 (Individual Income Tax Returns)
Here:
$69,214
State:
$89,260
Salary/wage: $65,794 (reported on 62.1% of returns)
Here:
$65,794
State:
$70,330
(% of AGI for various income ranges: 830.0% for AGIs below $25k, 3840.0% for AGIs $25k-50k, 3885.0% for AGIs $50k-75k, 22333.3% for AGIs $100k-200k)
Taxable interest for individuals: $580 (reported on 34.5% of returns)
This zip code:
$580
Colorado:
$2,176
(% of AGI for various income ranges: 22.0% for AGIs below $25k, 12.5% for AGIs $50k-75k, 140.0% for AGIs $100k-200k)
Ordinary dividends: $6,633 (reported on 31.0% of returns)
Here:
$6,633
State:
$8,820
(% of AGI for various income ranges: 126.0% for AGIs below $25k, 310.0% for AGIs $50k-75k, 1366.7% for AGIs $100k-200k)
Net capital gain/loss in AGI: +$8,362 (reported on 27.6% of returns)
Here:
+$8,362
State:
+$37,276
(% of AGI for various income ranges: 8.0% for AGIs below $25k, 150.0% for AGIs $50k-75k, 2016.7% for AGIs $100k-200k)
Profit/loss from business: +$10,425 (reported on 27.6% of returns)
Here:
+$10,425
State:
+$15,295
(% of AGI for various income ranges: 1080.0% for AGIs below $25k, 735.0% for AGIs $50k-75k)
Taxable individual retirement arrangement distribution: $12,133 (reported on 10.3% of returns)
80455:
$12,133
Colorado:
$23,785
(% of AGI for various income ranges: 910.0% for AGIs $50k-75k)
Total itemized deductions: $23,000 (reported on 10.3% of returns)
Here:
$23,000
State:
$35,141
(% of AGI for various income ranges: 1725.0% for AGIs $50k-75k)
Taxes paid: $7,667 (reported on 10.3% of returns)
80455:
$7,667
State:
$7,710
(% of AGI for various income ranges: )
Earned income credit: $1,300 (reported on 10.3% of returns)
Here:
$1,300
State:
$2,053
(% of AGI for various income ranges: 78.0% for AGIs below $25k)
Percentage of individuals using paid preparers for their 2020 taxes: 89.7%
Here:
90%
State:
93%
(% for various income ranges: 88.9% for AGIs below $25k, 83.3% for AGIs $25k-50k, 80.0% for AGIs $50k-75k, 100.0% for AGIs $75k-100k, 100.0% for AGIs $100k-200k)
Averages for the 2012 tax year for zip code 80455, filed in 2013:
Average Adjusted Gross Income (AGI) in 2012: $56,984 (Individual Income Tax Returns)
Here:
$56,984
State:
$69,103
Salary/wage: $46,558 (reported on 76.0% of returns)
Here:
$46,558
State:
$54,794
(% of AGI for various income ranges: 64.5% for AGIs below $25k, 56.9% for AGIs $25k-50k, 65.1% for AGIs $50k-75k, 62.8% for AGIs $75k-100k, 62.6% for AGIs $100k-200k)
Taxable interest for individuals: $689 (reported on 36.0% of returns)
This zip code:
$689
Colorado:
$1,971
(% of AGI for various income ranges: 2.1% for AGIs below $25k, 0.5% for AGIs $50k-75k, 0.5% for AGIs $100k-200k)
Ordinary dividends: $3,429 (reported on 28.0% of returns)
Here:
$3,429
State:
$7,140
Net capital gain/loss in AGI: +$1,000 (reported on 24.0% of returns)
Here:
+$1,000
State:
+$23,009
Profit/loss from business: +$9,188 (reported on 32.0% of returns)
Here:
+$9,188
State:
+$13,514
(% of AGI for various income ranges: 18.9% for AGIs below $25k, 15.6% for AGIs $25k-50k, 6.3% for AGIs $50k-75k)
Total itemized deductions: $20,900 (21% of AGI, reported on 36.0% of returns)
Here:
$20,900
State:
$24,621
Here:
21.4% of AGI
State:
18.5% of AGI
(% of AGI for various income ranges: 39.5% for AGIs below $25k, 27.1% for AGIs $50k-75k, 13.8% for AGIs $100k-200k)
Charity contributions: $1,457 (reported on 28.0% of returns)
Here:
$1,457
State:
$4,449
Taxes paid: $7,212 (reported on 32.0% of returns)
80455:
$7,212
State:
$7,641
(% of AGI for various income ranges: 5.7% for AGIs below $25k, 7.5% for AGIs $50k-75k, 5.6% for AGIs $100k-200k)
Earned income credit: $1,575 (reported on 16.0% of returns)
Here:
$1,575
State:
$2,095
(% of AGI for various income ranges: 5.8% for AGIs below $25k)
Percentage of individuals using paid preparers for their 2012 taxes: 48.0%
Here:
48%
State:
49%
(% for various income ranges: 55.6% for AGIs below $25k, 57.1% for AGIs $25k-50k, 150.0% for AGIs $75k-100k)
Averages for the 2004 tax year for zip code 80455, filed in 2005:
Average Adjusted Gross Income (AGI) in 2004: $53,302 (Individual Income Tax Returns)
Here:
$53,302
State:
$55,014
Salary/wage: $47,484 (reported on 75.0% of returns)
Here:
$47,484
State:
$46,010
(% of AGI for various income ranges: 188.1% for AGIs below $10k, 56.9% for AGIs $10k-25k, 77.0% for AGIs $25k-50k, 70.2% for AGIs $50k-75k, 84.0% for AGIs $75k-100k, 58.6% for AGIs over 100k)
Taxable interest for individuals: $1,520 (reported on 54.0% of returns)
This zip code:
$1,520
Colorado:
$2,127
(% of AGI for various income ranges: 16.5% for AGIs below $10k, 0.6% for AGIs $10k-25k, 1.5% for AGIs $25k-50k, 0.2% for AGIs $50k-75k, 1.2% for AGIs $75k-100k, 2.1% for AGIs over 100k)
Taxable dividends: $3,234 (reported on 39.0% of returns)
Here:
$3,234
State:
$3,782
(% of AGI for various income ranges: 28.4% for AGIs below $10k, 1.6% for AGIs $10k-25k, 1.5% for AGIs $25k-50k, 1.1% for AGIs $50k-75k, 3.3% for AGIs over 100k)
Net capital gain/loss: +$11,247 (reported on 27.1% of returns)
Here:
+$11,247
State:
+$17,882
(% of AGI for various income ranges: 44.0% for AGIs below $10k, -0.5% for AGIs $25k-50k, -0.6% for AGIs $50k-75k, 11.5% for AGIs over 100k)
Profit/loss from business: +$9,729 (reported on 29.3% of returns)
Here:
+$9,729
State:
+$11,247
(% of AGI for various income ranges: 15.6% for AGIs below $10k, 25.6% for AGIs $10k-25k, 2.6% for AGIs $25k-50k, 14.9% for AGIs $50k-75k, 1.0% for AGIs over 100k)
IRA payment deduction: $2,300 (reported on 3.0% of returns)
80455:
$2,300
Colorado:
$2,947
Total itemized deductions: $19,636 (22% of AGI, reported on 46.0% of returns)
Here:
$19,636
State:
$20,560
Here:
22.3% of AGI
State:
21.4% of AGI
(% of AGI for various income ranges: 21.0% for AGIs $10k-25k, 18.1% for AGIs $25k-50k, 19.2% for AGIs $50k-75k, 18.6% for AGIs $75k-100k, 15.1% for AGIs over 100k)
Charity contributions deductions: $2,176 (2% of AGI, reported on 38.1% of returns)
Here:
$2,176
State:
$3,518
Here:
2.5% of AGI
State:
3.4% of AGI
(% of AGI for various income ranges: 1.3% for AGIs $10k-25k, 2.1% for AGIs $25k-50k, 1.2% for AGIs $50k-75k, 1.4% for AGIs $75k-100k, 1.6% for AGIs over 100k)
Total tax: $9,007 (reported on 82.0% of returns)
80455:
$9,007
State:
$9,173
(% of AGI for various income ranges: 11.0% for AGIs below $10k, 8.1% for AGIs $10k-25k, 7.9% for AGIs $25k-50k, 11.5% for AGIs $50k-75k, 11.5% for AGIs $75k-100k, 17.9% for AGIs over 100k)
Earned income credit: $933 (reported on 9.1% of returns)
Here:
$933
State:
$1,595
Percentage of individuals using paid preparers for their 2004 taxes: 49.7%
Here:
50%
State:
55%
(% for various income ranges: 52.9% for AGIs below $10k, 40.9% for AGIs $10k-25k, 39.5% for AGIs $25k-50k, 65.3% for AGIs $50k-75k, 60.0% for AGIs $75k-100k, 53.2% for AGIs over 100k)
Household received Food Stamps/SNAP in the past 12 months: 55 Household did not receive Food Stamps/SNAP in the past 12 months: 165
Women who did not have a birth in the past 12 months: 82 (20 now married, 61 unmarried)
Housing units in zip code 80455 with a mortgage: 103 (6 second mortgage, 6 both second mortgage and home equity loan) Median monthly owner costs for units with a mortgage: $2,374 Median monthly owner costs for units without a mortgage: $372
Residents with income below the poverty level in 2022:
This zip code:
15.4%
Whole state:
9.4%
Residents with income below 50% of the poverty level in 2022:
This zip code:
13.2%
Whole state:
4.6%
Median number of rooms in houses and condos:
Here:
5.8
State:
6.8
Median number of rooms in apartments:
Here:
4.5
State:
4.0
Notable locations in this zip code not listed on our city pages
Notable locations in zip code 80455: South Saint Vrain Picnic Ground (A), Gold Lake Ranch (B), Lefthand Fire Protection District Station 4 (C), Jamestown Volunteer Fire Department (D), Lefthand Fire Protection District Station 3 (E). Display/hide their locations on the map
29 married couples with children.
12 single-parent households (12 women).
89.7% of residents of 80455 zip code speak English at home.
2.7% of residents speak Spanish at home (100% very well).
9.1% of residents speak other Indo-European language at home (81% very well, 19% well).
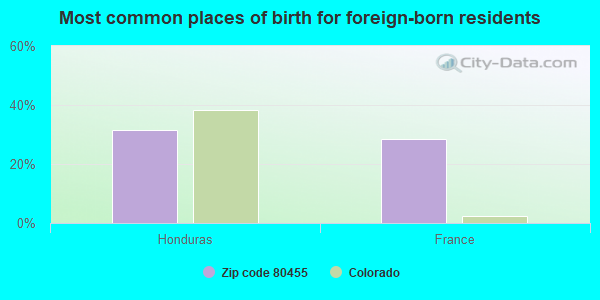
Foreign born population: 36 (8.9%) (72.3% of them are naturalized citizens)
This zip code:
8.9%
Whole state:
9.5%
31%Honduras
29%France
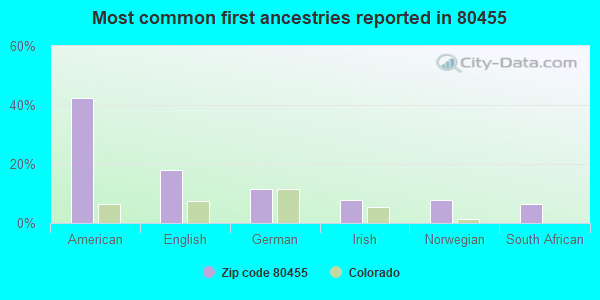
42%American
18%English
12%German
8%Irish
8%Norwegian
6%South African
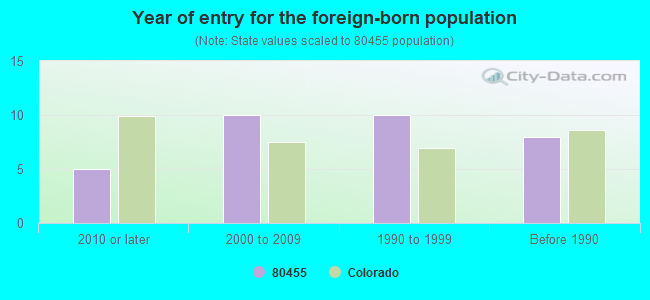
Year of entry for the foreign-born population
52010 or later
102000 to 2009
101990 to 1999
8Before 1990
Facilities with environmental interests located in this zip code:
JAMESTOWN ELEMENTARY SCHOOL (111 MESA STREET in JAMESTOWN, CO)
(National Center for Education Statistics) - STATE ID-4386 Organizations: BOULDER VALLEY RE 2 (SCHOOL DISTRICT)
BUENO MILL (1.5 MILES NORTH OF JAMESTOWN in JAMESTOWN, CO)
BUENO MILL & MINE SITE (SECTION 24, T2N, R72W in JAMESTOWN, CO)
SUPERFUND (Superfund database)
GOLDEN AGE MINE (1.5 MI N OF JAMESTOWN RD IN CASTLE GULCH in JAMESTOWN, CO)
SUPERFUND (Superfund database)
JAMESTOWN (1/2 MILE SOUTHWEST in JAMESTOWN, CO)
CRITERIA AND HAZARDOUS AIR POLLUTANT INVENTORY (Inventory of air pollution sources) Business SIC classification: REFUSE SYSTEMS Business NAICS classification: SOLID WASTE LANDFILL.
Housing units lacking complete plumbing facilities: 1.0% Housing units lacking complete kitchen facilities: 1.1%
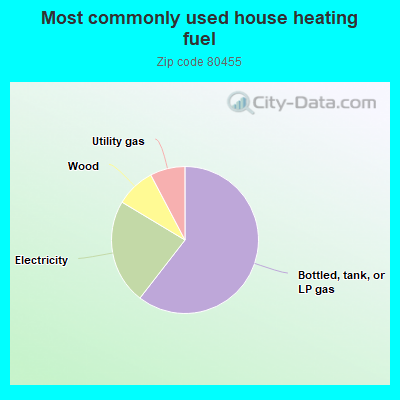
61.3%Bottled, tank, or LP gas
23.4%Electricity
8.8%Wood
7.8%Utility gas
Population in 1990: 654.
Place of birth for U.S.-born residents:
This state: 22
Northeast: 96
Midwest: 131
South: 67
West: 54
65% of the 80455 zip code residents lived in the same house 5 years ago. Out of people who lived in different houses, 71% lived in this county. Out of people who lived in different counties, 50% lived in Colorado.
97% of the 80455 zip code residents lived in the same house 1 year ago. Out of people who lived in different houses, 100% moved from this county.
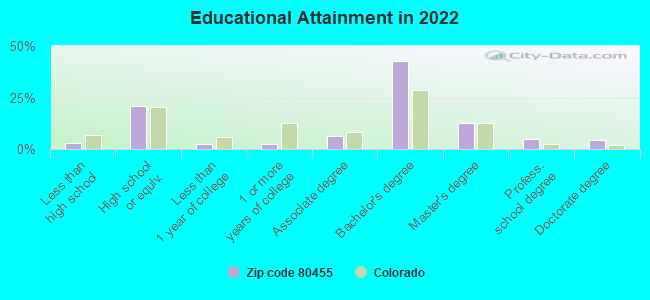
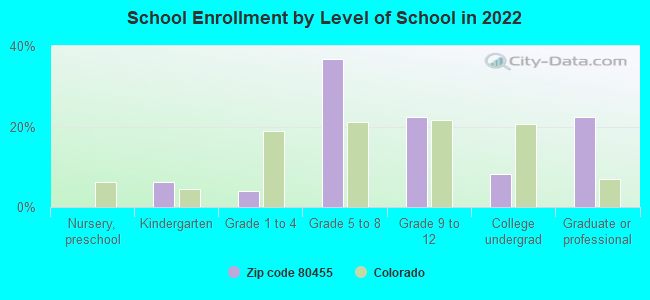
Private vs. public school enrollment:
Students in private schools in grades 1 to 8 (elementary and middle school): 7
Here:
34.8%
Colorado:
11.4%
Students in private schools in grades 9 to 12 (high school):
Here:
0.0%
Colorado:
8.5%
Students in private undergraduate colleges:
Here:
0.0%
Colorado:
14.0%
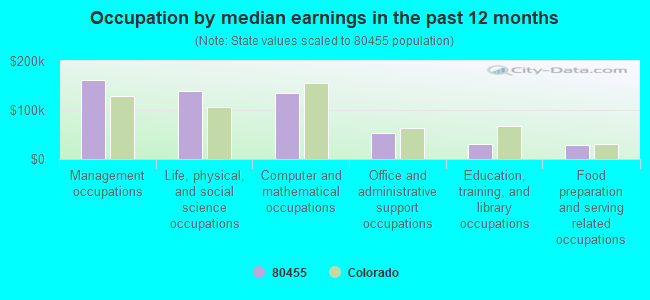
Occupation by median earnings in the past 12 months ($)
161,399Management occupations
139,531Life, physical, and social science occupations
133,757Computer and mathematical occupations
53,785Office and administrative support occupations
31,380Education, training, and library occupations
28,918Food preparation and serving related occupations
Companies with federal contracts located in this zip code:
CYBER INCIDENT DETECTION AND D (7520 LEFT HAND CANYON in JAMESTOWN, CO; small business)
$200,000 with Army for Other Research and Development -- Basic Research (R&D). Taking place in PA. Signed on 2005-03-14. Completion date: 2006-03-14.
Top industries in this zip code by the number of employees in 2005:
Educational Services: All Other Miscellaneous Schools and Instruction (10-19 employees: 1 establishment)
Administrative and Support and Waste Management and Remediation Services: Travel Agencies (1-4: 1)
Administrative and Support and Waste Management and Remediation Services: Solid Waste Collection (1-4: 1)
Professional, Scientific, and Technical Services: Process, Physical Distribution, and Logistics Consulting Services (1-4: 1)
Construction: Commercial and Institutional Building Construction (1-4: 1)
Construction: Residential Remodelers (1-4: 1)
Real Estate and Rental and Leasing: Lessors of Miniwarehouses and Self-Storage Units (1-4: 1)
Administrative and Support and Waste Management and Remediation Services: Other Services to Buildings and Dwellings (1-4: 1)
Fatal accident statistics in 2012:
Fatal accident count: 1
Vehicles involved in fatal accidents: 1
Fatal accidents caused by drunken drivers: 0
Fatalities: 1
Persons involved in fatal accidents: 1
Pedestrians involved in fatal accidents: 0
Fatal accident statistics in 2011:
Fatal accident count: 1
Vehicles involved in fatal accidents: 1
Fatal accidents caused by drunken drivers: 0
Fatalities: 1
Persons involved in fatal accidents: 1
Pedestrians involved in fatal accidents: 0
Home Mortgage Disclosure Act Aggregated Statistics For Year 2009 (Based on 2 partial tracts)
A) FHA, FSA/RHS & VA Home Purchase Loans
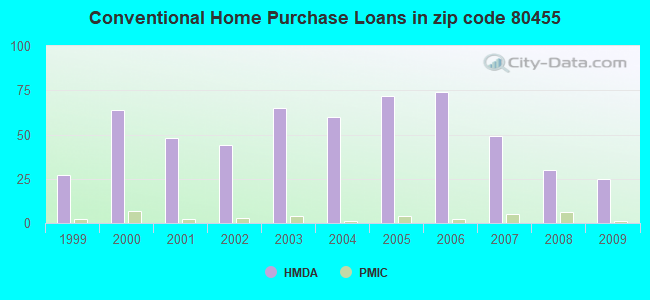
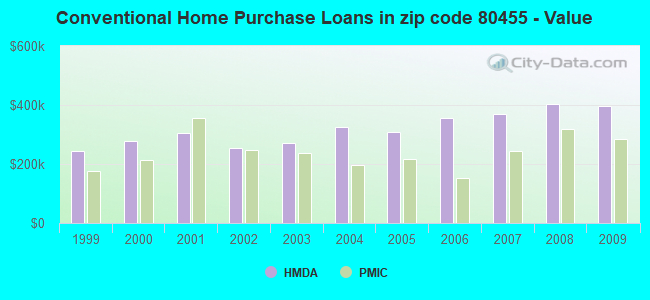
B) Conventional Home Purchase Loans
C) Refinancings
D) Home Improvement Loans
F) Non-occupant Loans on < 5 Family Dwellings (A B C & D)
Number
Average Value
Number
Average Value
Number
Average Value
Number
Average Value
Number
Average Value
LOANS ORIGINATED
5
$245,240
25
$397,552
155
$310,749
1
$406,350
10
$312,315
APPLICATIONS APPROVED, NOT ACCEPTED
0
$0
2
$392,830
14
$320,381
0
$0
2
$245,520
APPLICATIONS DENIED
0
$0
3
$254,200
29
$380,887
4
$189,258
4
$317,980
APPLICATIONS WITHDRAWN
1
$249,690
5
$341,458
29
$360,390
2
$58,645
2
$177,530
FILES CLOSED FOR INCOMPLETENESS
0
$0
0
$0
5
$379,548
1
$56,060
0
$0
Aggregated Statistics For Year 2008 (Based on 2 partial tracts)
A) FHA, FSA/RHS & VA Home Purchase Loans
B) Conventional Home Purchase Loans
C) Refinancings
D) Home Improvement Loans
F) Non-occupant Loans on < 5 Family Dwellings (A B C & D)
G) Loans On Manufactured Home Dwelling (A B C & D)
Number
Average Value
Number
Average Value
Number
Average Value
Number
Average Value
Number
Average Value
Number
Average Value
LOANS ORIGINATED
2
$253,270
30
$404,319
69
$324,182
4
$113,515
6
$325,237
0
$0
APPLICATIONS APPROVED, NOT ACCEPTED
0
$0
5
$432,192
7
$326,259
1
$382,090
0
$0
0
$0
APPLICATIONS DENIED
1
$170,570
8
$389,300
20
$404,300
5
$284,840
5
$285,238
1
$11,930
APPLICATIONS WITHDRAWN
0
$0
6
$389,515
12
$359,762
1
$70,770
0
$0
0
$0
FILES CLOSED FOR INCOMPLETENESS
0
$0
0
$0
2
$417,880
0
$0
0
$0
0
$0
Aggregated Statistics For Year 2007 (Based on 2 partial tracts)
A) FHA, FSA/RHS & VA Home Purchase Loans
B) Conventional Home Purchase Loans
C) Refinancings
D) Home Improvement Loans
F) Non-occupant Loans on < 5 Family Dwellings (A B C & D)
Number
Average Value
Number
Average Value
Number
Average Value
Number
Average Value
Number
Average Value
LOANS ORIGINATED
1
$310,130
49
$370,831
55
$395,214
4
$156,355
12
$344,852
APPLICATIONS APPROVED, NOT ACCEPTED
0
$0
6
$440,010
8
$310,376
0
$0
1
$513,700
APPLICATIONS DENIED
1
$112,120
8
$546,700
28
$444,574
2
$222,655
3
$437,360
APPLICATIONS WITHDRAWN
0
$0
3
$290,380
11
$459,192
1
$227,820
0
$0
FILES CLOSED FOR INCOMPLETENESS
0
$0
1
$271,160
3
$354,793
0
$0
0
$0
Aggregated Statistics For Year 2006 (Based on 2 partial tracts)
A) FHA, FSA/RHS & VA Home Purchase Loans
B) Conventional Home Purchase Loans
C) Refinancings
D) Home Improvement Loans
F) Non-occupant Loans on < 5 Family Dwellings (A B C & D)
Number
Average Value
Number
Average Value
Number
Average Value
Number
Average Value
Number
Average Value
LOANS ORIGINATED
2
$138,365
74
$357,432
61
$339,909
8
$293,826
17
$288,213
APPLICATIONS APPROVED, NOT ACCEPTED
0
$0
4
$305,358
10
$321,579
0
$0
1
$68,390
APPLICATIONS DENIED
0
$0
9
$287,421
23
$470,568
2
$127,630
3
$241,477
APPLICATIONS WITHDRAWN
0
$0
9
$283,003
18
$357,111
2
$79,120
3
$158,643
FILES CLOSED FOR INCOMPLETENESS
0
$0
2
$453,265
4
$289,255
0
$0
1
$402,770
Aggregated Statistics For Year 2005 (Based on 2 partial tracts)
A) FHA, FSA/RHS & VA Home Purchase Loans
B) Conventional Home Purchase Loans
C) Refinancings
D) Home Improvement Loans
F) Non-occupant Loans on < 5 Family Dwellings (A B C & D)
G) Loans On Manufactured Home Dwelling (A B C & D)
Number
Average Value
Number
Average Value
Number
Average Value
Number
Average Value
Number
Average Value
Number
Average Value
LOANS ORIGINATED
4
$119,678
72
$308,151
82
$350,664
3
$148,437
14
$290,873
1
$150,290
APPLICATIONS APPROVED, NOT ACCEPTED
0
$0
10
$251,124
10
$382,014
2
$132,400
1
$220,670
0
$0
APPLICATIONS DENIED
0
$0
17
$290,926
27
$373,450
5
$305,674
3
$246,513
0
$0
APPLICATIONS WITHDRAWN
1
$137,970
8
$303,021
23
$307,535
2
$477,120
1
$104,570
0
$0
FILES CLOSED FOR INCOMPLETENESS
0
$0
2
$313,905
4
$407,440
0
$0
0
$0
0
$0
Aggregated Statistics For Year 2004 (Based on 2 partial tracts)
B) Conventional Home Purchase Loans
C) Refinancings
D) Home Improvement Loans
F) Non-occupant Loans on < 5 Family Dwellings (A B C & D)
Number
Average Value
Number
Average Value
Number
Average Value
Number
Average Value
LOANS ORIGINATED
60
$325,038
123
$315,607
5
$162,460
18
$272,024
APPLICATIONS APPROVED, NOT ACCEPTED
5
$263,290
10
$303,806
2
$38,170
2
$124,450
APPLICATIONS DENIED
12
$279,049
29
$346,145
3
$199,330
2
$724,425
APPLICATIONS WITHDRAWN
7
$383,911
22
$302,483
2
$132,200
1
$641,730
FILES CLOSED FOR INCOMPLETENESS
2
$235,975
4
$217,785
1
$223,450
1
$253,270
Aggregated Statistics For Year 2003 (Based on 2 partial tracts)
A) FHA, FSA/RHS & VA Home Purchase Loans
B) Conventional Home Purchase Loans
C) Refinancings
D) Home Improvement Loans
F) Non-occupant Loans on < 5 Family Dwellings (A B C & D)
Number
Average Value
Number
Average Value
Number
Average Value
Number
Average Value
Number
Average Value
LOANS ORIGINATED
6
$185,348
65
$272,264
287
$277,925
5
$92,720
25
$238,624
APPLICATIONS APPROVED, NOT ACCEPTED
1
$99,800
5
$262,336
21
$254,937
1
$45,720
3
$275,670
APPLICATIONS DENIED
0
$0
9
$388,764
38
$291,148
3
$85,880
6
$291,707
APPLICATIONS WITHDRAWN
0
$0
5
$274,106
19
$285,539
1
$493,020
2
$236,570
FILES CLOSED FOR INCOMPLETENESS
1
$131,610
1
$209,930
6
$271,428
0
$0
0
$0
Aggregated Statistics For Year 2002 (Based on 2 partial tracts)
A) FHA, FSA/RHS & VA Home Purchase Loans
B) Conventional Home Purchase Loans
C) Refinancings
D) Home Improvement Loans
F) Non-occupant Loans on < 5 Family Dwellings (A B C & D)
Number
Average Value
Number
Average Value
Number
Average Value
Number
Average Value
Number
Average Value
LOANS ORIGINATED
3
$174,943
44
$255,928
232
$297,137
8
$106,955
12
$220,933
APPLICATIONS APPROVED, NOT ACCEPTED
0
$0
2
$345,115
20
$296,630
1
$95,420
0
$0
APPLICATIONS DENIED
0
$0
5
$269,812
20
$333,169
3
$40,687
1
$247,700
APPLICATIONS WITHDRAWN
1
$134,790
4
$257,842
27
$317,314
0
$0
3
$305,753
FILES CLOSED FOR INCOMPLETENESS
0
$0
1
$123,650
6
$315,562
0
$0
0
$0
Aggregated Statistics For Year 2001 (Based on 2 partial tracts)
A) FHA, FSA/RHS & VA Home Purchase Loans
B) Conventional Home Purchase Loans
C) Refinancings
D) Home Improvement Loans
F) Non-occupant Loans on < 5 Family Dwellings (A B C & D)
Number
Average Value
Number
Average Value
Number
Average Value
Number
Average Value
Number
Average Value
LOANS ORIGINATED
1
$160,630
48
$304,893
176
$290,867
9
$97,102
10
$224,604
APPLICATIONS APPROVED, NOT ACCEPTED
0
$0
5
$265,438
17
$217,230
3
$99,930
2
$223,055
APPLICATIONS DENIED
0
$0
6
$700,968
21
$335,196
3
$45,060
2
$828,795
APPLICATIONS WITHDRAWN
1
$113,320
19
$277,923
23
$220,374
0
$0
2
$182,300
FILES CLOSED FOR INCOMPLETENESS
0
$0
2
$201,585
5
$308,300
0
$0
0
$0
Aggregated Statistics For Year 2000 (Based on 2 partial tracts)
A) FHA, FSA/RHS & VA Home Purchase Loans
B) Conventional Home Purchase Loans
C) Refinancings
D) Home Improvement Loans
F) Non-occupant Loans on < 5 Family Dwellings (A B C & D)
Number
Average Value
Number
Average Value
Number
Average Value
Number
Average Value
Number
Average Value
LOANS ORIGINATED
2
$143,135
64
$277,804
43
$268,158
9
$63,307
6
$287,663
APPLICATIONS APPROVED, NOT ACCEPTED
0
$0
7
$158,529
8
$327,672
2
$101,785
0
$0
APPLICATIONS DENIED
0
$0
11
$218,174
16
$258,241
3
$33,400
2
$171,765
APPLICATIONS WITHDRAWN
0
$0
8
$347,800
10
$214,823
1
$73,560
1
$551,870
FILES CLOSED FOR INCOMPLETENESS
0
$0
1
$439,350
1
$232,990
0
$0
0
$0
Aggregated Statistics For Year 1999 (Based on 1 partial tract)
A) FHA, FSA/RHS & VA Home Purchase Loans
B) Conventional Home Purchase Loans
C) Refinancings
D) Home Improvement Loans
F) Non-occupant Loans on < 5 Family Dwellings (A B C & D)


 Nearest zip codes: 80302, 80304, 80540, 80471, 80310, 80481.