Estimated zip code population in 2022: 50,490 Zip code population in 2010: 55,132 Zip code population in 2000: 55,127
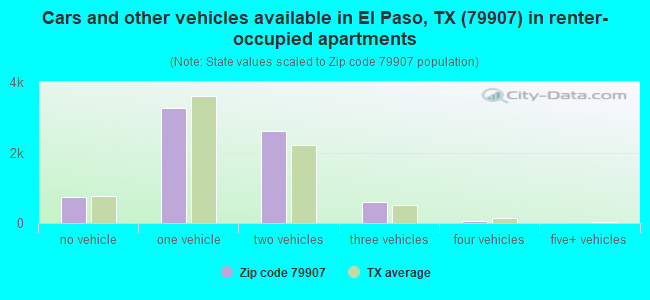
Houses and condos: 18,398 Renter-occupied apartments: 7,288
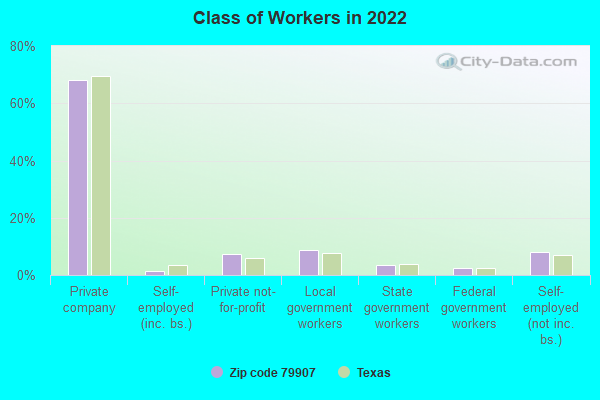
% of renters here:
42%
State:
38%
March 2022 cost of living index in zip code 79907: 81.4 (low, U.S. average is 100)
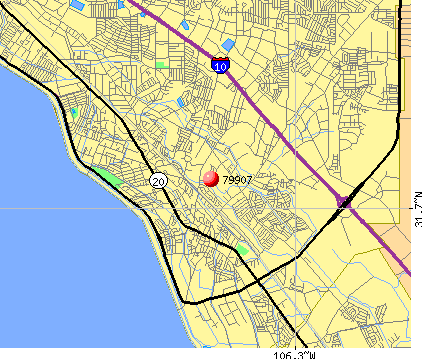
Land area: 13.6 sq. mi. Water area: 0.0 sq. mi.
Population density: 3,711 people per square mile
(average).
OSM Map
General Map
Google Map
MSN Map
OSM Map
General Map
Google Map
MSN Map
OSM Map
General Map
Google Map
MSN Map
OSM Map
General Map
Google Map
MSN Map
Please wait while loading the map...
Real estate property taxes paid for housing units in 2022:
This zip code:
1.6% ($1,908)
Texas:
1.5% ($4,050)
Median real estate property taxes paid for housing units with mortgages in 2022: $2,542 (2.0%) Median real estate property taxes paid for housing units with no mortgage in 2022: $1,635 (1.4%)
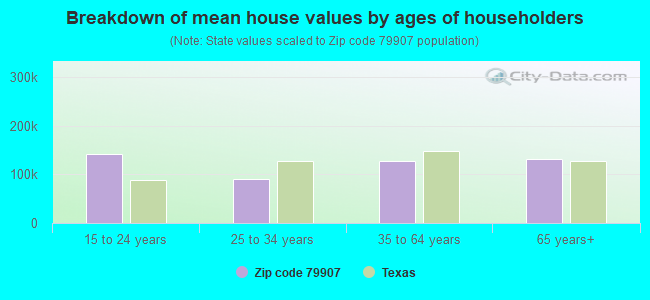
Estimated median house/condo value in 2022: $118,144
79907:
$118,144
Texas:
$275,400
According to our research of Texas and other state lists, there were 67 registered sex offenders living in 79907 zip code as of May 21, 2024. The ratio of all residents to sex offenders in zip code 79907 is 823 to 1. The ratio of registered sex offenders to all residents in this zip code is lower than the state average.
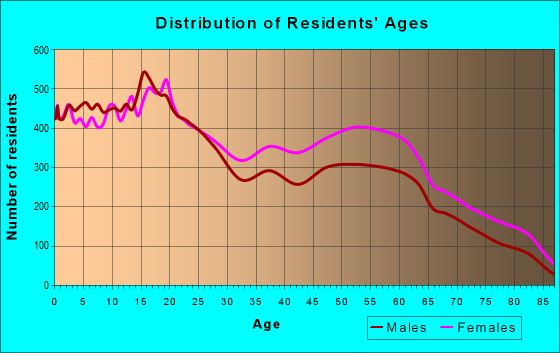
Median resident age:
This zip code:
36.3 years
Texas median age:
35.6 years
Average household size:
This zip code:
2.9 people
Texas:
2.6 people
Averages for the 2020 tax year for zip code 79907, filed in 2021:
Average Adjusted Gross Income (AGI) in 2020: $30,996 (Individual Income Tax Returns)
Here:
$30,996
State:
$77,054
Salary/wage: $28,553 (reported on 84.6% of returns)
Here:
$28,553
State:
$62,766
(% of AGI for various income ranges: 1145.7% for AGIs below $25k, 3289.5% for AGIs $25k-50k, 6170.7% for AGIs $50k-75k, 8890.2% for AGIs $75k-100k, 14532.3% for AGIs $100k-200k)
Taxable interest for individuals: $719 (reported on 11.6% of returns)
This zip code:
$719
Texas:
$2,665
(% of AGI for various income ranges: 3.2% for AGIs below $25k, 5.2% for AGIs $25k-50k, 13.4% for AGIs $50k-75k, 44.7% for AGIs $75k-100k, 97.4% for AGIs $100k-200k)
Ordinary dividends: $1,560 (reported on 2.2% of returns)
Here:
$1,560
State:
$10,044
(% of AGI for various income ranges: 0.8% for AGIs below $25k, 1.7% for AGIs $25k-50k, 3.8% for AGIs $50k-75k, 32.9% for AGIs $75k-100k, 79.3% for AGIs $100k-200k)
Net capital gain/loss in AGI: +$8,402 (reported on 2.2% of returns)
Here:
+$8,402
State:
+$39,590
(% of AGI for various income ranges: 1.7% for AGIs below $25k, 5.6% for AGIs $25k-50k, 17.3% for AGIs $50k-75k, 93.6% for AGIs $75k-100k, 420.5% for AGIs $100k-200k)
Profit/loss from business: +$8,276 (reported on 16.6% of returns)
Here:
+$8,276
State:
+$10,888
(% of AGI for various income ranges: 182.1% for AGIs below $25k, 100.1% for AGIs $25k-50k, 125.5% for AGIs $50k-75k, 116.6% for AGIs $75k-100k, 866.5% for AGIs $100k-200k)
Taxable individual retirement arrangement distribution: $10,055 (reported on 2.1% of returns)
79907:
$10,055
Texas:
$24,740
(% of AGI for various income ranges: 9.2% for AGIs below $25k, 19.2% for AGIs $25k-50k, 50.9% for AGIs $50k-75k, 144.9% for AGIs $75k-100k, 239.5% for AGIs $100k-200k)
Total itemized deductions: $27,528 (reported on 1.5% of returns)
Here:
$27,528
State:
$40,428
(% of AGI for various income ranges: 9.3% for AGIs below $25k, 45.3% for AGIs $25k-50k, 106.0% for AGIs $50k-75k, 184.9% for AGIs $75k-100k, 650.7% for AGIs $100k-200k)
Charity contributions: $5,620 (reported on 1.0% of returns)
Here:
$5,620
State:
$18,201
(% of AGI for various income ranges: 0.7% for AGIs below $25k, 5.1% for AGIs $25k-50k, 17.7% for AGIs $50k-75k, 26.4% for AGIs $75k-100k, 115.3% for AGIs $100k-200k)
Taxes paid: $6,626 (reported on 1.4% of returns)
79907:
$6,626
State:
$7,821
(% of AGI for various income ranges: 1.2% for AGIs below $25k, 9.9% for AGIs $25k-50k, 29.1% for AGIs $50k-75k, 48.3% for AGIs $75k-100k, 145.3% for AGIs $100k-200k)
Earned income credit: $2,797 (reported on 37.1% of returns)
Here:
$2,797
State:
$2,584
(% of AGI for various income ranges: 166.0% for AGIs below $25k, 107.3% for AGIs $25k-50k, 2.4% for AGIs $50k-75k)
Percentage of individuals using paid preparers for their 2020 taxes: 93.5%
Here:
94%
State:
92%
(% for various income ranges: 93.1% for AGIs below $25k, 94.4% for AGIs $25k-50k, 93.3% for AGIs $50k-75k, 92.3% for AGIs $75k-100k, 92.2% for AGIs $100k-200k, 100.0% for AGIs over 200k)
Averages for the 2012 tax year for zip code 79907, filed in 2013:
Average Adjusted Gross Income (AGI) in 2012: $25,656 (Individual Income Tax Returns)
Here:
$25,656
State:
$65,384
Salary/wage: $24,365 (reported on 87.7% of returns)
Here:
$24,365
State:
$52,524
(% of AGI for various income ranges: 80.8% for AGIs below $25k, 87.9% for AGIs $25k-50k, 84.5% for AGIs $50k-75k, 84.5% for AGIs $75k-100k, 80.4% for AGIs $100k-200k, 34.8% for AGIs over 200k)
Taxable interest for individuals: $569 (reported on 10.4% of returns)
This zip code:
$569
Texas:
$2,372
(% of AGI for various income ranges: 0.2% for AGIs below $25k, 0.2% for AGIs $25k-50k, 0.4% for AGIs $50k-75k, 0.2% for AGIs $75k-100k, 0.5% for AGIs $100k-200k, 0.9% for AGIs over 200k)
Ordinary dividends: $1,600 (reported on 2.1% of returns)
Here:
$1,600
State:
$9,721
(% of AGI for various income ranges: 0.1% for AGIs below $25k, 0.1% for AGIs $25k-50k, 0.2% for AGIs $50k-75k, 0.3% for AGIs $100k-200k)
Net capital gain/loss in AGI: +$3,624 (reported on 1.4% of returns)
Here:
+$3,624
State:
+$35,319
(% of AGI for various income ranges: 0.3% for AGIs $50k-75k, 2.0% for AGIs $100k-200k)
Profit/loss from business: +$8,866 (reported on 15.4% of returns)
Here:
+$8,866
State:
+$13,732
(% of AGI for various income ranges: 11.3% for AGIs below $25k, 2.4% for AGIs $25k-50k, 1.5% for AGIs $50k-75k, 1.9% for AGIs $75k-100k, 5.5% for AGIs $100k-200k)
Taxable individual retirement arrangement distribution: $8,534 (reported on 2.6% of returns)
79907:
$8,534
Texas:
$19,511
(% of AGI for various income ranges: 0.6% for AGIs below $25k, 0.8% for AGIs $25k-50k, 1.5% for AGIs $50k-75k, 1.0% for AGIs $75k-100k, 1.4% for AGIs $100k-200k)
Total itemized deductions: $16,967 (30% of AGI, reported on 7.4% of returns)
Here:
$16,967
State:
$24,724
Here:
29.8% of AGI
State:
15.9% of AGI
(% of AGI for various income ranges: 1.6% for AGIs below $25k, 5.1% for AGIs $25k-50k, 7.9% for AGIs $50k-75k, 7.9% for AGIs $75k-100k, 10.4% for AGIs $100k-200k)
Charity contributions: $2,341 (reported on 4.7% of returns)
Here:
$2,341
State:
$6,808
(% of AGI for various income ranges: 0.4% for AGIs $25k-50k, 0.7% for AGIs $50k-75k, 0.9% for AGIs $75k-100k, 1.3% for AGIs $100k-200k)
Taxes paid: $3,525 (reported on 7.1% of returns)
79907:
$3,525
State:
$6,921
(% of AGI for various income ranges: 0.3% for AGIs below $25k, 0.9% for AGIs $25k-50k, 1.4% for AGIs $50k-75k, 1.9% for AGIs $75k-100k, 2.5% for AGIs $100k-200k)
Earned income credit: $2,793 (reported on 46.3% of returns)
Here:
$2,793
State:
$2,570
(% of AGI for various income ranges: 12.7% for AGIs below $25k, 2.5% for AGIs $25k-50k)
Percentage of individuals using paid preparers for their 2012 taxes: 60.8%
Here:
61%
State:
51%
(% for various income ranges: 61.4% for AGIs below $25k, 59.7% for AGIs $25k-50k, 59.3% for AGIs $50k-75k, 61.0% for AGIs $75k-100k, 59.4% for AGIs $100k-200k, 100.0% for AGIs over 200k)
Averages for the 2004 tax year for zip code 79907, filed in 2005:
Average Adjusted Gross Income (AGI) in 2004: $20,577 (Individual Income Tax Returns)
Here:
$20,577
State:
$47,881
Salary/wage: $20,113 (reported on 89.6% of returns)
Here:
$20,113
State:
$41,947
(% of AGI for various income ranges: 81.7% for AGIs below $10k, 87.5% for AGIs $10k-25k, 91.1% for AGIs $25k-50k, 88.1% for AGIs $50k-75k, 85.5% for AGIs $75k-100k, 66.3% for AGIs over 100k)
Taxable interest for individuals: $598 (reported on 14.1% of returns)
This zip code:
$598
Texas:
$2,255
(% of AGI for various income ranges: 0.5% for AGIs below $10k, 0.3% for AGIs $10k-25k, 0.3% for AGIs $25k-50k, 0.4% for AGIs $50k-75k, 0.9% for AGIs $75k-100k, 2.3% for AGIs over 100k)
Taxable dividends: $973 (reported on 2.5% of returns)
Here:
$973
State:
$4,261
(% of AGI for various income ranges: 0.1% for AGIs below $10k, 0.0% for AGIs $10k-25k, 0.1% for AGIs $25k-50k, 0.1% for AGIs $50k-75k, 0.5% for AGIs $75k-100k, 0.8% for AGIs over 100k)
Net capital gain/loss: +$2,028 (reported on 1.6% of returns)
Here:
+$2,028
State:
+$16,110
(% of AGI for various income ranges: 0.1% for AGIs below $10k, 0.0% for AGIs $10k-25k, 0.2% for AGIs $25k-50k, 0.4% for AGIs $50k-75k, 0.4% for AGIs $75k-100k, 0.3% for AGIs over 100k)
Profit/loss from business: +$5,502 (reported on 15.0% of returns)
Here:
+$5,502
State:
+$11,013
(% of AGI for various income ranges: 13.9% for AGIs below $10k, 6.0% for AGIs $10k-25k, 1.1% for AGIs $25k-50k, 1.4% for AGIs $50k-75k, 1.5% for AGIs $75k-100k, 5.8% for AGIs over 100k)
IRA payment deduction: $1,784 (reported on 0.9% of returns)
79907:
$1,784
Texas:
$3,120
(% of AGI for various income ranges: 0.1% for AGIs $10k-25k, 0.1% for AGIs $25k-50k, 0.1% for AGIs $50k-75k, 0.2% for AGIs $75k-100k)
Total itemized deductions: $14,769 (34% of AGI, reported on 7.8% of returns)
Here:
$14,769
State:
$19,631
Here:
34.3% of AGI
State:
18.9% of AGI
(% of AGI for various income ranges: 1.7% for AGIs below $10k, 3.0% for AGIs $10k-25k, 7.2% for AGIs $25k-50k, 8.6% for AGIs $50k-75k, 8.8% for AGIs $75k-100k, 8.7% for AGIs over 100k)
Charity contributions deductions: $1,715 (4% of AGI, reported on 6.1% of returns)
Here:
$1,715
State:
$4,753
Here:
3.8% of AGI
State:
4.2% of AGI
(% of AGI for various income ranges: 0.1% for AGIs below $10k, 0.2% for AGIs $10k-25k, 0.6% for AGIs $25k-50k, 0.9% for AGIs $50k-75k, 1.1% for AGIs $75k-100k, 1.2% for AGIs over 100k)
Total tax: $2,008 (reported on 50.8% of returns)
79907:
$2,008
State:
$9,058
(% of AGI for various income ranges: 2.8% for AGIs below $10k, 2.6% for AGIs $10k-25k, 4.6% for AGIs $25k-50k, 7.9% for AGIs $50k-75k, 9.9% for AGIs $75k-100k, 17.8% for AGIs over 100k)
Earned income credit: $2,302 (reported on 49.4% of returns)
Here:
$2,302
State:
$2,024
Percentage of individuals using paid preparers for their 2004 taxes: 68.7%
Here:
69%
State:
57%
(% for various income ranges: 65.0% for AGIs below $10k, 72.8% for AGIs $10k-25k, 65.8% for AGIs $25k-50k, 63.2% for AGIs $50k-75k, 63.0% for AGIs $75k-100k, 74.8% for AGIs over 100k)
Likely homosexual households (counted as self-reported same-sex unmarried-partner households)
Lesbian couples: 0.0% of all households
Gay men: 0.2% of all households
Household received Food Stamps/SNAP in the past 12 months: 5,020 Household did not receive Food Stamps/SNAP in the past 12 months: 12,522
Women who had a birth in the past 12 months: 720 (289 now married, 418 unmarried) Women who did not have a birth in the past 12 months: 11,094 (4,091 now married, 7,028 unmarried)
Housing units in zip code 79907 with a mortgage: 3,243 (82 second mortgage, 60 both second mortgage and home equity loan) Houses without a mortgage: 67
Median monthly owner costs for units with a mortgage: $1,125 Median monthly owner costs for units without a mortgage: $407
Residents with income below the poverty level in 2022:
This zip code:
23.1%
Whole state:
14.0%
Residents with income below 50% of the poverty level in 2022:
This zip code:
15.2%
Whole state:
7.4%
Median number of rooms in houses and condos:
Here:
5.8
State:
6.3
Median number of rooms in apartments:
Here:
4.2
State:
4.0
Notable locations in this zip code not listed on our city pages
Notable locations in zip code 79907: El Paso Fire Department Station 17 (A), El Paso Fire Department Station 26 (B), Tigua Indian Reservation Cultural Center (C). Display/hide their locations on the map
Churches in zip code 79907 include: Our Lady of the Valley Church (A), Our Lady of Mount Carmel Church (B), San Jose Catholic Church (C), Cristo Rey Catholic Church (D), Loma Terrace Baptist Church (E), Our Lady of the Valley Catholic Church (F), Ysleta Lutheran Mission Church (G), Seventh Day Adventist Church (H), Faith Presbyterian Church (I). Display/hide their locations on the map
Parks in zip code 79907 include: Lancaster Park (1), Lafayette Park (2), J P Shawer Park (3), Pavo Real Park (4), Marion Manor Park (5), Ysleta Park (6), Yucca Park (7), Zaragosa Park (8), Hutchins Stadium - Ysleta High School (9). Display/hide their locations on the map
4,723 married couples with children.
4,344 single-parent households (1,133 men, 3,211 women).
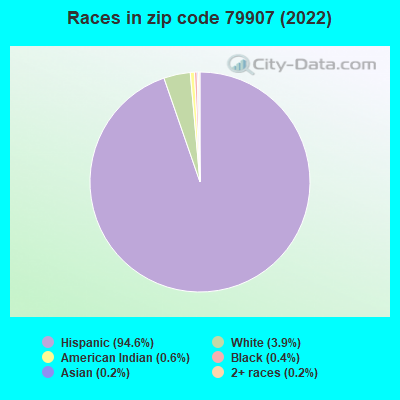
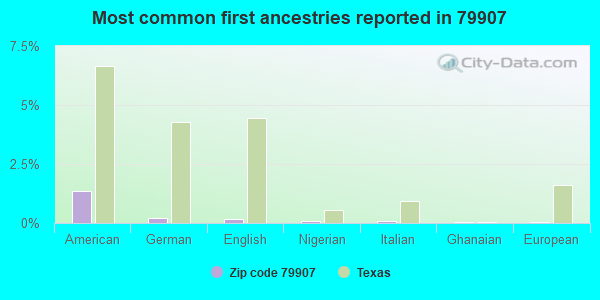
19.5% of residents of 79907 zip code speak English at home.
80.0% of residents speak Spanish at home (52% very well, 24% well, 12% not well, 12% not at all).
0.3% of residents speak other Indo-European language at home (55% very well, 22% well, 24% not well).
0.3% of residents speak Asian or Pacific Island language at home (93% very well, 1% well, 6% not well).
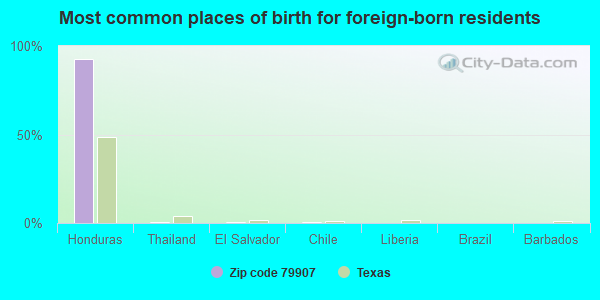
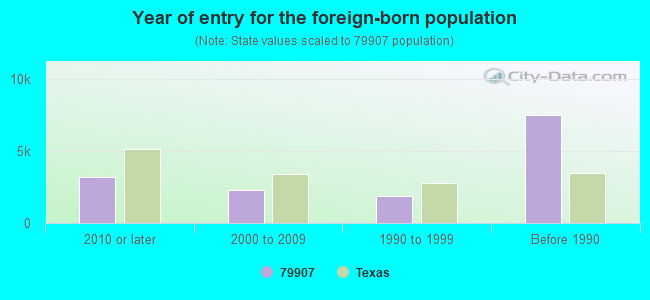
Foreign born population: 14,516 (28.7%) (54.4% of them are naturalized citizens)
Facilities with environmental interests located in this zip code:
ADULT/COMMUNITY LRN CTR (121 S LEE TREVINO DR in EL PASO, TX)
(National Center for Education Statistics) - STATE ID-071905013 Organizations: YSLETA ISD (SCHOOL DISTRICT)
B R P US INC CARE OF TRANSFREIGHT LLC (8445 GRAN VISTA DRIVE SUITE B in EL PASO, TX)
Large Quantity Generators, more that 1000 kg of hazardous waste/month (Resource Conservation and Recovery Act (tracking hazardous waste)) Organizations: ROAH FORWARDING AND FREIGHT SERVICES LLC (CONTACT/OPERATOR)
APPROVED OIL SERVICE LLC TX (1200 KASTRIN in EL PASO, TX)
Conditionally Exempt Small Quantity Generators, less than 100 kg/month of hazardous waste (Resource Conservation and Recovery Act (tracking hazardous waste)) - notification TRANSPORTER (Resource Conservation and Recovery Act (tracking hazardous waste)) - notification USED OIL PROGRAM (Resource Conservation and Recovery Act (tracking hazardous waste)) Organizations: EL PASO CRANE AND RIGGING INC (CONTACT/OWNER)
ADVANCE CUSTOM MOLDERS (8701 CASTNER DR in EL PASO, TX)
(Resource Conservation and Recovery Act (tracking hazardous waste)) Business NAICS classification: ALL OTHER PLASTICS PRODUCT MANUFACTURING. Alternative names: ACM TEXTEK
ASSET RECOVERY COMPANY (1110 PENDALE RD. in EL PASO, TX)
(Resource Conservation and Recovery Act (tracking hazardous waste))
BADGER PATTERN WORKS (990 KESSLER DR SUITE A in EL PASO, TX)
(Resource Conservation and Recovery Act (tracking hazardous waste)) Business NAICS classification: SPECIAL DIE AND TOOL, DIE SET, JIG, AND FIXTURE MANUFACTURING.
BALVINO MENDOZA AMBRIZ (8638 CHINCHILLA LANE in EL PASO, TX)
TRANSPORTER (Resource Conservation and Recovery Act (tracking hazardous waste))
BARRIO AUTO SALVAGE (7945 ALAMEDA in EL PASO, TX)
(Resource Conservation and Recovery Act (tracking hazardous waste))
Housing units lacking complete plumbing facilities: 2.6% Housing units lacking complete kitchen facilities: 1.9%
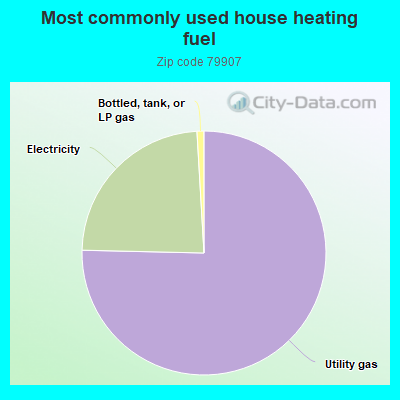
74.7%Utility gas
23.5%Electricity
0.9%Bottled, tank, or LP gas
Population in 1990: 58,052.
Place of birth for U.S.-born residents:
This state: 30,663
Northeast: 288
Midwest: 650
South: 308
West: 3,114
69% of the 79907 zip code residents lived in the same house 5 years ago. Out of people who lived in different houses, 85% lived in this county. Out of people who lived in different counties, 50% lived in Texas.
92% of the 79907 zip code residents lived in the same house 1 year ago. Out of people who lived in different houses, 69% moved from this county. Out of people who lived in different houses, 7% moved from different county within same state. Out of people who lived in different houses, 8% moved from different state. Out of people who lived in different houses, 15% moved from abroad.
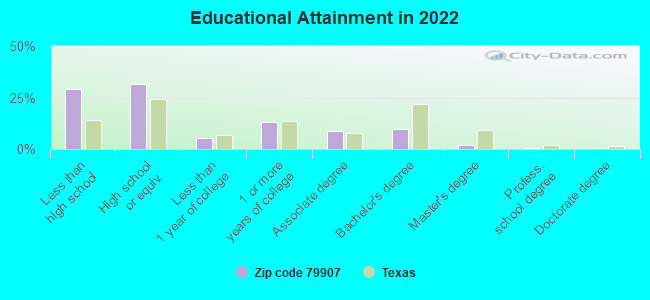
Private vs. public school enrollment:
Students in private schools in grades 1 to 8 (elementary and middle school): 223
Here:
4.3%
Texas:
8.8%
Students in private schools in grades 9 to 12 (high school): 76
Here:
2.4%
Texas:
8.0%
Students in private undergraduate colleges: 349
Here:
11.6%
Texas:
16.2%
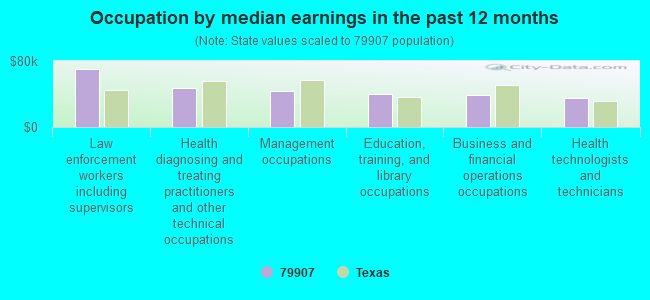
Occupation by median earnings in the past 12 months ($)
69,838Law enforcement workers including supervisors
47,778Health diagnosing and treating practitioners and other technical occupations
43,703Management occupations
39,448Education, training, and library occupations
38,712Business and financial operations occupations
35,296Health technologists and technicians
Companies with biggest federal contracts located in this zip code (EL PASO, TX):
VISTACON, INC (1161 KESSLER STREET; small business) : $36,423,453 in 161 contractsfrom 1999 to 2006
Contracts for Construction of Structures and Facilities -- Miscellaneous Buildings, Construction of Structures and Facilities -- Other Residential Buildings, Maintenance, Repair or Alteration of Real Property -- Other Non-Building Facilities, Construction of Structures and Facilities -- Office Buildings, and moreby Army, Public Buildings Service, Employment and Training Administration, U.S. Army Corps of Engineers - civil program financing only, and others Signed by year:2000: $1,017,000; 2001: $12,000; 2002: $840,672; 2003: $12,598,771; 2004: $11,557,802; 2005: $8,574,420; 2006: -$147,212.
Biggest contracts:
$5,986,000 with Army for Construction of Structures and Facilities -- Miscellaneous Buildings. Signed on 2003-12-11. Completion date: 2004-12-30.
$3,321,360 with Army for Construction of Structures and Facilities -- Other Residential Buildings. Signed on 2003-08-19. Completion date: 2004-08-21.
$2,041,125 with Army for Maintenance, Repair or Alteration of Real Property -- Other Non-Building Facilities. Signed on 2004-09-25. Completion date: 2005-04-04.
$2,041,125, same as above.Signed on 2004-09-25. Completion date: 2005-04-04.
KINGS AIRE INC (1035 KESSLER DR; small business) : $29,866,439 in 587 contractsfrom 2000 to 2006
Contracts for Maintenance, Repair and Rebuilding of Equipment -- Refrigeration, Air Conditioning, and Air Circulating Equipment, Maintenance, Repair and Rebuilding of Equipment -- Aircraft and Airframe Structural Components, Construction of Structures and Facilities -- Miscellaneous Buildings, Construction of Structures and Facilities -- Other Warehouse Buildings, and moreby Army, Navy Signed by year:2000: $3,298,829; 2001: $3,540,341; 2002: $3,439,604; 2003: $3,480,238; 2004: $5,800,880; 2005: $7,224,139; 2006: $3,082,408.
Biggest contracts:
$2,000,000 with Army for Maintenance, Repair and Rebuilding of Equipment -- Refrigeration, Air Conditioning, and Air Circulating Equipment. Signed on 2005-06-03. Completion date: 2005-12-31.
$827,639, same as above.Signed on 2005-09-30. Completion date: 2006-01-28.
$781,062, same as above.Signed on 2000-09-29. Completion date: 2001-02-28.
$768,639, same as above.Signed on 2005-07-14. Completion date: 2005-09-30.
PAN AMERICAN PIPE AND ALLOY, I (840 KASTRIN ST A; small business) : $1,869,415 in 182 contractsfrom 2000 to 2006
Contracts for Pipe, Tube and Rigid Tubing, Hose and Flexible Tubing, Valves, Nonpowered, Hose, Pipe, Tube, Lubrication, and Railing Fittings, and moreby U.S. Fish and Wildlife Service, Defense Logistics Agency, National Oceanic and Atmospheric Administration/Under Secretary for Oceans and Atmosphere, Army, and others Signed by year:2000: $48,000; 2001: $0; 2002: $46,623; 2003: $38,292; 2004: $296,815; 2005: $930,383; 2006: $509,302.
Biggest contracts:
$172,260 with U.S. Fish and Wildlife Service for Pipe, Tube and Rigid Tubing. Signed on 2005-06-30. Completion date: 2005-08-05.
$90,093 with Defense Logistics Agency for Pipe, Tube and Rigid Tubing. Signed on 2004-10-27. Completion date: 2004-12-26.
$85,388, same as above.Signed on 2005-11-09. Completion date: 2006-02-07.
$78,188, same as above.Signed on 2005-08-20. Completion date: 2005-11-18.
STEWART & STEVENSON POWER, INC (1213 N ZARAGOZA RD) : $1,019,909 in 20 contractsfrom 2003 to 2006
Contracts for Maintenance, Repair and Rebuilding of Equipment -- Vehicular Equipment Components, Maintenance, Repair and Rebuilding of Equipment -- Engine Accessories, Generators and Generators Sets, Electrical, Lease or Rental of Equipment -- Miscellaneous, and moreby Army, Air Force, National Park Service, Drug Enforcement Administration, and others Signed by year:2000: $0; 2001: $0; 2002: $0; 2003: $216,940; 2004: $611,152; 2005: $187,687; 2006: $4,130.
Biggest contracts:
$250,000 with Army for Maintenance, Repair and Rebuilding of Equipment -- Vehicular Equipment Components. Signed on 2004-01-28. Completion date: 2005-01-26.
$200,000 with Army for Maintenance, Repair and Rebuilding of Equipment -- Engine Accessories. Signed on 2004-09-13. Completion date: 2005-09-30.
$175,000, same as above.Signed on 2005-03-18. Completion date: 2005-09-30.
$175,000 with Army for Maintenance, Repair and Rebuilding of Equipment -- Vehicular Equipment Components. Signed on 2005-04-29. Completion date: 2006-04-28.
PRIME HOSPITALITY CORP (8250 GATEWAY BLVD E) : $332,169 in 4 contractsin 2004
$173,250 with Army for Lodging - Hotel/Motel. Signed on 2004-05-06. Completion date: 2004-11-12.
$75,696, same as above.Signed on 2004-08-30. Completion date: 2004-11-12.
$63,525, same as above.Signed on 2004-05-25. Completion date: 2004-11-12.
$19,698, same as above.Signed on 2004-07-01. Completion date: 2004-11-12.
PERMIAN MACHINERY MOVERS, I (9270 GATEWAY BLVD EAST; small business) : $259,317 in 24 contractsfrom 2001 to 2006
Contracts for Torque Converters and Speed Changers, Lease or Rental of Equipment -- Materials Handling Equipment, Lease or Rental of Equipment -- Special Industry Machinery, Specialized Shipping and Storage Containers, and moreby Army Signed by year:2000: $0; 2001: $5,650; 2002: $62,485; 2003: $52,890; 2004: $78,072; 2005: $51,500; 2006: $8,720.
Biggest contracts:
$53,305 with Army for Torque Converters and Speed Changers. Signed on 2002-09-26. Completion date: 2002-10-08.
$28,092 with Army for Lease or Rental of Equipment -- Materials Handling Equipment. Signed on 2004-09-15. Completion date: 2004-05-03.
$27,000 with Army for Lease or Rental of Equipment -- Special Industry Machinery. Signed on 2004-10-22. Completion date: 2005-09-30.
$24,750 with Army for Specialized Shipping and Storage Containers. Signed on 2003-11-07. Completion date: 2004-09-30.
INTER MECHANICAL, INC (831 PENDALE; small business) : $206,406 in 3 contractsfrom 2003 to 2004
$200,000 with Army for Maintenance, Repair and Rebuilding of Equipment -- Maintenance and Repair Shop Equipment. Signed on 2003-09-30. Completion date: 2004-09-29.
$8,183 with Army for Maintenance, Repair or Alteration of Real Property -- Water Supply Facilities. Signed on 2004-03-10. Completion date: 2004-03-24.
-$1,777 with Army for Maintenance, Repair and Rebuilding of Equipment -- Maintenance and Repair Shop Equipment. Signed on 2004-11-04. Completion date: 2004-09-29.
MORGAN BUILDINGS & SPAS, INC (8020 GATEWAY BLVD E) : $159,479 in 6 contractsfrom 2001 to 2005
Contracts for Prefabricated and Portable Buildings, Building Components, Prefabricated, Construction of Structures and Facilities -- Miscellaneous Buildings, Miscellaneous Prefabricated Structures by Army Signed by year:2000: $0; 2001: $28,044; 2002: $35,469; 2003: $3,930; 2004: $78,188; 2005: $13,848; 2006: $0.
Biggest contracts:
$78,188 with Army for Prefabricated and Portable Buildings. Signed on 2004-03-18. Completion date: 2004-03-23.
$35,469 with Army for Building Components, Prefabricated. Signed on 2002-07-17. Completion date: 2002-07-31.
$28,044 with Army for Construction of Structures and Facilities -- Miscellaneous Buildings. Signed on 2001-12-10. Completion date: 2002-01-14.
$8,898 with Army for Miscellaneous Prefabricated Structures. Signed on 2005-09-08. Completion date: 2005-10-05.
KING BUILDINGS OF EL PASO, INC (8860 GATEWAY EAST; small business) : $118,982 in 7 contractsfrom 2001 to 2005
Contracts for Construction of Structures and Facilities -- Miscellaneous Buildings, Construction of Structures and Facilities -- Other Industrial Buildings, Prefabricated and Portable Buildings by Army Signed by year:2000: $0; 2001: $30,000; 2002: $51,450; 2003: $0; 2004: $0; 2005: $37,532; 2006: $0.
Biggest contracts:
$30,000 with Army for Construction of Structures and Facilities -- Miscellaneous Buildings. Signed on 2001-12-07. Completion date: 2001-12-18.
$29,533 with Army for Construction of Structures and Facilities -- Other Industrial Buildings. Signed on 2005-04-28. Completion date: 2005-06-03.
$17,300 with Army for Construction of Structures and Facilities -- Miscellaneous Buildings. Signed on 2002-09-21. Completion date: 2002-09-30.
$17,300, same as above.Signed on 2002-09-19. Completion date: 2002-09-30.
WESTERN PRECAST CONCRETE, INC (9101 ROSEWAY DR; small business) : $118,945 in 5 contractsfrom 2001 to 2004
Contracts for Tile, Brick, and Block, Mineral Construction Materials, Bulk, Relocation Services, Miscellaneous Construction Materials by Army Signed by year:2000: $0; 2001: $45,000; 2002: $0; 2003: $11,860; 2004: $62,085; 2005: $0; 2006: $0.
Biggest contracts:
$45,000 with Army for Tile, Brick, and Block. Signed on 2001-09-26. Completion date: 2001-10-12.
$28,320 with Army for Mineral Construction Materials, Bulk. Signed on 2004-05-28. Completion date: 2004-06-18.
$27,200, same as above.Signed on 2004-07-12. Completion date: 2004-07-15.
$11,860 with Army for Relocation Services. Signed on 2003-04-30. Completion date: 2003-05-09.
Top industries in this zip code by the number of employees in 2005:
Administrative and Support and Waste Management and Remediation Services: Collection Agencies (over 1000 employees: 1 establishment, 1-4 employees: 2 establishments)
Administrative and Support and Waste Management and Remediation Services: Telemarketing Bureaus (250-499: 1)
Health Care and Social Assistance: Child Day Care Services (100-249: 1, 20-49: 2, 10-19: 3, 5-9: 6, 1-4: 8)
Other Services (except Public Administration): Religious Organizations (20-49: 3, 10-19: 4, 5-9: 4, 1-4: 5)
Other Services (except Public Administration): Commercial and Industrial Machinery and Equipment (except Automotive and Electronic) Repair and Maintenance (100-249: 1, 1-4: 1)
People in group quarters in 2010:
109 people in nursing facilities/skilled-nursing facilities
17 people in other noninstitutional facilities
7 people in group homes intended for adults
5 people in emergency and transitional shelters (with sleeping facilities) for people experiencing homelessness
People in group quarters in 2000:
134 people in nursing homes
43 people in religious group quarters
24 people in other noninstitutional group quarters
18 people in halfway houses
7 people in college dormitories (includes college quarters off campus)
6 people in homes for the mentally retarded
Fatal accident statistics in 2014:
Fatal accident count: 5
Vehicles involved in fatal accidents: 11
Fatal accidents caused by drunken drivers: 2
Fatalities: 6
Persons involved in fatal accidents: 21
Pedestrians involved in fatal accidents: 3
Fatal accident statistics in 2013:
Fatal accident count: 7
Vehicles involved in fatal accidents: 12
Fatal accidents caused by drunken drivers: 3
Fatalities: 7
Persons involved in fatal accidents: 15
Pedestrians involved in fatal accidents: 1
Home Mortgage Disclosure Act Aggregated Statistics For Year 2009 (Based on 15 full and 6 partial tracts)
A) FHA, FSA/RHS & VA Home Purchase Loans
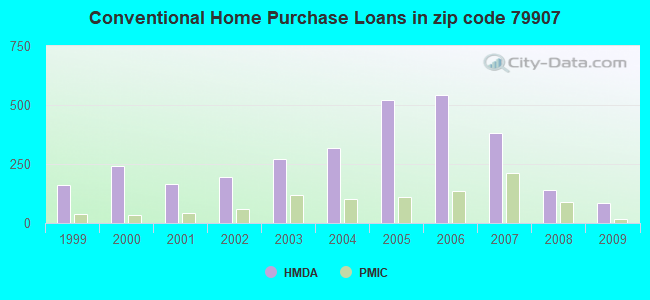
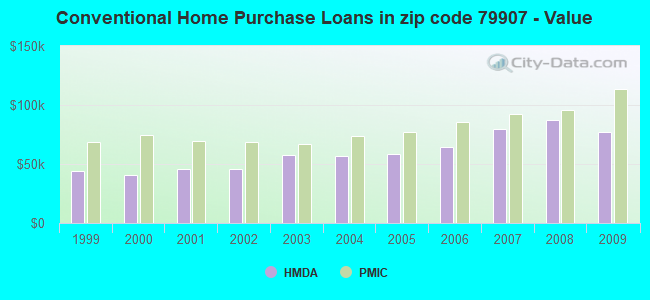
B) Conventional Home Purchase Loans
C) Refinancings
D) Home Improvement Loans
F) Non-occupant Loans on < 5 Family Dwellings (A B C & D)
G) Loans On Manufactured Home Dwelling (A B C & D)
Number
Average Value
Number
Average Value
Number
Average Value
Number
Average Value
Number
Average Value
Number
Average Value
LOANS ORIGINATED
148
$102,327
83
$76,891
395
$66,554
204
$20,623
45
$61,918
12
$38,042
APPLICATIONS APPROVED, NOT ACCEPTED
13
$74,752
19
$59,985
104
$63,586
62
$32,248
25
$80,058
2
$33,620
APPLICATIONS DENIED
36
$97,502
42
$51,933
491
$71,379
314
$26,136
42
$45,911
24
$36,227
APPLICATIONS WITHDRAWN
14
$106,070
12
$93,795
165
$89,283
37
$41,968
25
$59,126
1
$46,000
FILES CLOSED FOR INCOMPLETENESS
8
$89,268
6
$48,173
31
$66,399
4
$47,452
2
$39,500
3
$43,137
Aggregated Statistics For Year 2008 (Based on 15 full and 6 partial tracts)
A) FHA, FSA/RHS & VA Home Purchase Loans
B) Conventional Home Purchase Loans
C) Refinancings
D) Home Improvement Loans
E) Loans on Dwellings For 5+ Families
F) Non-occupant Loans on < 5 Family Dwellings (A B C & D)
G) Loans On Manufactured Home Dwelling (A B C & D)
Number
Average Value
Number
Average Value
Number
Average Value
Number
Average Value
Number
Average Value
Number
Average Value
Number
Average Value
LOANS ORIGINATED
93
$96,742
139
$87,613
578
$62,169
355
$21,788
2
$2,088,790
72
$73,345
15
$43,865
APPLICATIONS APPROVED, NOT ACCEPTED
8
$133,864
71
$77,787
180
$61,925
78
$45,058
0
$0
28
$73,381
23
$43,168
APPLICATIONS DENIED
31
$83,553
122
$67,876
939
$70,398
486
$36,584
0
$0
73
$85,325
47
$35,473
APPLICATIONS WITHDRAWN
20
$83,702
18
$96,630
314
$71,465
78
$63,232
0
$0
25
$63,277
0
$0
FILES CLOSED FOR INCOMPLETENESS
5
$81,544
23
$105,488
53
$61,752
23
$58,113
0
$0
8
$49,344
2
$40,995
Aggregated Statistics For Year 2007 (Based on 15 full and 6 partial tracts)
A) FHA, FSA/RHS & VA Home Purchase Loans
B) Conventional Home Purchase Loans
C) Refinancings
D) Home Improvement Loans
E) Loans on Dwellings For 5+ Families
F) Non-occupant Loans on < 5 Family Dwellings (A B C & D)
G) Loans On Manufactured Home Dwelling (A B C & D)
Number
Average Value
Number
Average Value
Number
Average Value
Number
Average Value
Number
Average Value
Number
Average Value
Number
Average Value
LOANS ORIGINATED
35
$95,863
381
$79,466
708
$67,662
426
$26,065
2
$693,610
130
$68,977
24
$39,878
APPLICATIONS APPROVED, NOT ACCEPTED
7
$50,011
90
$72,405
135
$64,041
104
$33,822
0
$0
23
$81,844
24
$36,636
APPLICATIONS DENIED
11
$76,527
214
$76,491
1,186
$68,615
551
$37,092
0
$0
118
$76,091
51
$35,685
APPLICATIONS WITHDRAWN
5
$79,004
81
$74,834
438
$75,541
99
$53,308
0
$0
16
$61,854
7
$36,347
FILES CLOSED FOR INCOMPLETENESS
0
$0
26
$98,629
108
$73,200
21
$37,655
0
$0
12
$99,371
0
$0
Aggregated Statistics For Year 2006 (Based on 15 full and 6 partial tracts)
A) FHA, FSA/RHS & VA Home Purchase Loans
B) Conventional Home Purchase Loans
C) Refinancings
D) Home Improvement Loans
E) Loans on Dwellings For 5+ Families
F) Non-occupant Loans on < 5 Family Dwellings (A B C & D)
G) Loans On Manufactured Home Dwelling (A B C & D)
Number
Average Value
Number
Average Value
Number
Average Value
Number
Average Value
Number
Average Value
Number
Average Value
Number
Average Value
LOANS ORIGINATED
35
$82,430
542
$64,705
674
$60,271
395
$20,108
0
$0
110
$59,123
29
$26,916
APPLICATIONS APPROVED, NOT ACCEPTED
2
$72,550
176
$58,253
188
$66,738
55
$35,936
3
$433,333
41
$59,473
29
$28,619
APPLICATIONS DENIED
16
$71,496
296
$59,442
977
$61,948
448
$33,710
0
$0
100
$55,009
73
$37,618
APPLICATIONS WITHDRAWN
2
$71,050
130
$69,934
612
$65,299
71
$50,652
0
$0
62
$60,484
6
$36,352
FILES CLOSED FOR INCOMPLETENESS
0
$0
12
$57,194
82
$66,499
17
$52,954
0
$0
12
$54,860
0
$0
Aggregated Statistics For Year 2005 (Based on 15 full and 6 partial tracts)
A) FHA, FSA/RHS & VA Home Purchase Loans
B) Conventional Home Purchase Loans
C) Refinancings
D) Home Improvement Loans
E) Loans on Dwellings For 5+ Families
F) Non-occupant Loans on < 5 Family Dwellings (A B C & D)
G) Loans On Manufactured Home Dwelling (A B C & D)
Number
Average Value
Number
Average Value
Number
Average Value
Number
Average Value
Number
Average Value
Number
Average Value
Number
Average Value
LOANS ORIGINATED
184
$71,018
521
$58,726
814
$57,929
355
$35,564
7
$2,359,234
150
$68,780
35
$38,836
APPLICATIONS APPROVED, NOT ACCEPTED
2
$32,865
143
$56,989
167
$50,909
58
$41,330
0
$0
33
$47,627
20
$33,918
APPLICATIONS DENIED
33
$59,794
309
$54,271
1,133
$56,823
390
$29,427
0
$0
117
$61,186
109
$32,273
APPLICATIONS WITHDRAWN
48
$77,993
120
$79,357
535
$65,903
234
$111,218
0
$0
78
$74,800
0
$0
FILES CLOSED FOR INCOMPLETENESS
6
$129,620
32
$67,194
89
$66,446
6
$55,170
0
$0
12
$77,145
0
$0
Aggregated Statistics For Year 2004 (Based on 15 full and 6 partial tracts)
A) FHA, FSA/RHS & VA Home Purchase Loans
B) Conventional Home Purchase Loans
C) Refinancings
D) Home Improvement Loans
E) Loans on Dwellings For 5+ Families
F) Non-occupant Loans on < 5 Family Dwellings (A B C & D)
G) Loans On Manufactured Home Dwelling (A B C & D)
Number
Average Value
Number
Average Value
Number
Average Value
Number
Average Value
Number
Average Value
Number
Average Value
Number
Average Value
LOANS ORIGINATED
139
$66,751
318
$56,778
929
$52,160
264
$19,203
0
$0
100
$47,567
27
$29,606
APPLICATIONS APPROVED, NOT ACCEPTED
8
$60,265
70
$55,446
217
$49,762
51
$30,338
0
$0
22
$60,283
20
$31,603
APPLICATIONS DENIED
31
$72,155
161
$52,857
1,209
$50,790
328
$20,083
2
$2,940
113
$48,675
68
$33,149
APPLICATIONS WITHDRAWN
58
$71,750
56
$64,193
681
$55,047
82
$34,627
0
$0
34
$49,535
0
$0
FILES CLOSED FOR INCOMPLETENESS
0
$0
14
$61,650
109
$62,692
7
$63,784
0
$0
7
$61,571
0
$0
Aggregated Statistics For Year 2003 (Based on 15 full and 6 partial tracts)
A) FHA, FSA/RHS & VA Home Purchase Loans
B) Conventional Home Purchase Loans
C) Refinancings
D) Home Improvement Loans
E) Loans on Dwellings For 5+ Families
F) Non-occupant Loans on < 5 Family Dwellings (A B C & D)
Number
Average Value
Number
Average Value
Number
Average Value
Number
Average Value
Number
Average Value
Number
Average Value
LOANS ORIGINATED
160
$65,581
273
$57,407
1,144
$49,352
277
$8,999
8
$2,503,205
106
$46,369
APPLICATIONS APPROVED, NOT ACCEPTED
8
$64,909
40
$59,820
169
$46,638
34
$24,959
0
$0
28
$52,605
APPLICATIONS DENIED
38
$66,580
195
$56,806
942
$49,736
208
$13,510
0
$0
59
$49,280
APPLICATIONS WITHDRAWN
38
$67,849
48
$74,004
595
$52,031
50
$17,230
0
$0
19
$47,602
FILES CLOSED FOR INCOMPLETENESS
4
$74,140
10
$65,386
56
$49,977
4
$42,500
0
$0
2
$45,000
Aggregated Statistics For Year 2002 (Based on 10 full and 4 partial tracts)
A) FHA, FSA/RHS & VA Home Purchase Loans
B) Conventional Home Purchase Loans
C) Refinancings
D) Home Improvement Loans
F) Non-occupant Loans on < 5 Family Dwellings (A B C & D)
Number
Average Value
Number
Average Value
Number
Average Value
Number
Average Value
Number
Average Value
LOANS ORIGINATED
106
$56,173
195
$45,473
450
$47,851
113
$8,308
60
$45,119
APPLICATIONS APPROVED, NOT ACCEPTED
20
$65,663
44
$49,674
86
$44,562
18
$21,958
5
$69,598
APPLICATIONS DENIED
17
$62,185
176
$37,781
338
$50,303
120
$9,068
31
$36,209
APPLICATIONS WITHDRAWN
9
$66,798
37
$47,762
214
$48,586
54
$10,111
16
$54,485
FILES CLOSED FOR INCOMPLETENESS
4
$65,425
13
$42,698
40
$61,169
4
$14,498
0
$0
Aggregated Statistics For Year 2001 (Based on 10 full and 4 partial tracts)
A) FHA, FSA/RHS & VA Home Purchase Loans
B) Conventional Home Purchase Loans
C) Refinancings
D) Home Improvement Loans
F) Non-occupant Loans on < 5 Family Dwellings (A B C & D)
Number
Average Value
Number
Average Value
Number
Average Value
Number
Average Value
Number
Average Value
LOANS ORIGINATED
95
$58,816
166
$45,536
369
$46,830
208
$7,274
49
$46,810
APPLICATIONS APPROVED, NOT ACCEPTED
7
$48,587
65
$35,835
89
$41,389
28
$26,643
7
$50,740
APPLICATIONS DENIED
6
$58,773
253
$38,036
265
$46,111
96
$13,043
33
$51,545
APPLICATIONS WITHDRAWN
21
$59,589
30
$72,291
155
$45,167
65
$8,653
12
$51,171
FILES CLOSED FOR INCOMPLETENESS
1
$59,000
11
$45,568
44
$50,282
1
$35,000
2
$95,765
Aggregated Statistics For Year 2000 (Based on 10 full and 4 partial tracts)
A) FHA, FSA/RHS & VA Home Purchase Loans
B) Conventional Home Purchase Loans
C) Refinancings
D) Home Improvement Loans
E) Loans on Dwellings For 5+ Families
F) Non-occupant Loans on < 5 Family Dwellings (A B C & D)
Number
Average Value
Number
Average Value
Number
Average Value
Number
Average Value
Number
Average Value
Number
Average Value
LOANS ORIGINATED
91
$59,829
240
$40,698
206
$38,797
106
$11,277
0
$0
22
$40,325
APPLICATIONS APPROVED, NOT ACCEPTED
24
$44,225
72
$41,907
47
$36,985
7
$11,123
0
$0
7
$30,736
APPLICATIONS DENIED
18
$56,230
541
$37,984
156
$44,428
75
$13,988
2
$880,000
24
$39,030
APPLICATIONS WITHDRAWN
20
$61,570
28
$45,104
92
$41,357
9
$5,829
0
$0
2
$16,780
FILES CLOSED FOR INCOMPLETENESS
2
$73,000
8
$68,464
89
$47,711
2
$36,390
0
$0
12
$40,048
Aggregated Statistics For Year 1999 (Based on 7 full and 3 partial tracts)
A) FHA, FSA/RHS & VA Home Purchase Loans
B) Conventional Home Purchase Loans
C) Refinancings
D) Home Improvement Loans
E) Loans on Dwellings For 5+ Families
F) Non-occupant Loans on < 5 Family Dwellings (A B C & D)
2002 - 2018 National Fire Incident Reporting System (NFIRS) incidents
Based on the data from the years 2002 - 2018 the average number of fire incidents per year is 157. The highest number of fires - 234 took place in 2002, and the least - 90 in 2018. The data has a decreasing trend.
When looking into fire subcategories, the most reports belonged to: Outside Fires (51.3%), and Structure Fires (21.9%).
Fire incident types reported to NFIRS in Zip Code 79907


 Nearest zip codes: 79915, 79935, 79936, 79927, 79925, 79905.
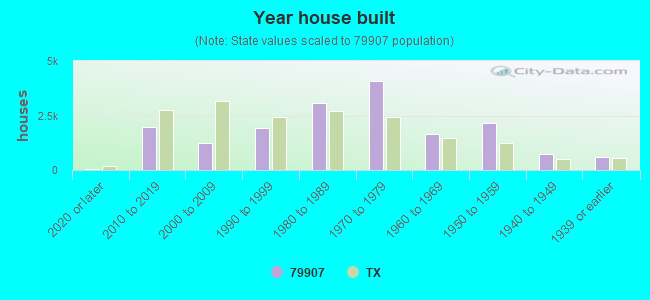


 Based on the data from the years 2002 - 2018 the average number of fire incidents per year is 157. The highest number of fires - 234 took place in 2002, and the least - 90 in 2018. The data has a decreasing trend.
 When looking into fire subcategories, the most reports belonged to: Outside Fires (51.3%), and Structure Fires (21.9%).