Estimated zip code population in 2022: 6,737 Zip code population in 2010: 6,125 Zip code population in 2000: 6,153
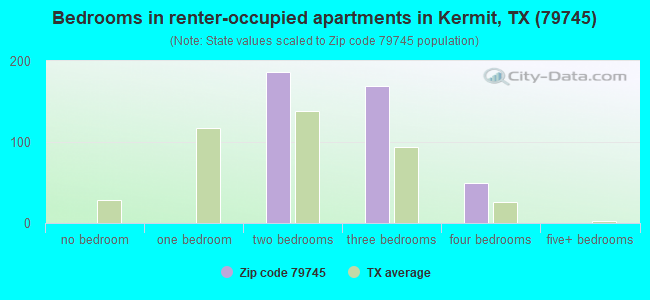
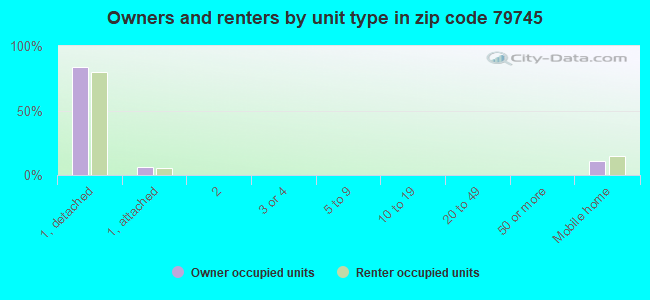
Houses and condos: 2,895 Renter-occupied apartments: 413
% of renters here:
17%
State:
38%
March 2022 cost of living index in zip code 79745: 75.8 (low, U.S. average is 100)
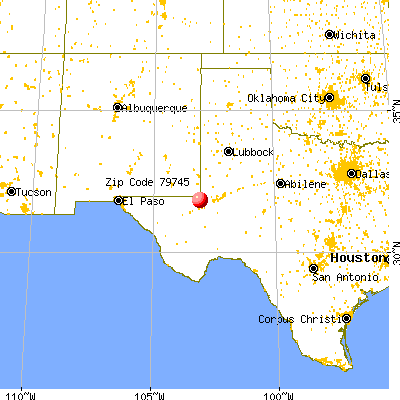
Land area: 391.7 sq. mi. Water area: 0.1 sq. mi.
Population density: 17 people per square mile
(very low).
OSM Map
General Map
Google Map
MSN Map
OSM Map
General Map
Google Map
MSN Map
OSM Map
General Map
Google Map
MSN Map
OSM Map
General Map
Google Map
MSN Map
Please wait while loading the map...
Real estate property taxes paid for housing units in 2022:
This zip code:
0.9% ($1,189)
Texas:
1.5% ($4,050)
Median real estate property taxes paid for housing units with mortgages in 2022: $1,838 (0.8%) Median real estate property taxes paid for housing units with no mortgage in 2022: $1,125 (0.9%)
Averages for the 2020 tax year for zip code 79745, filed in 2021:
Average Adjusted Gross Income (AGI) in 2020: $62,273 (Individual Income Tax Returns)
Here:
$62,273
State:
$77,054
Salary/wage: $53,491 (reported on 86.1% of returns)
Here:
$53,491
State:
$62,766
(% of AGI for various income ranges: 1139.5% for AGIs below $25k, 3479.1% for AGIs $25k-50k, 6765.6% for AGIs $50k-75k, 9771.0% for AGIs $75k-100k, 15159.3% for AGIs $100k-200k)
Taxable interest for individuals: $876 (reported on 18.8% of returns)
This zip code:
$876
Texas:
$2,665
(% of AGI for various income ranges: 6.4% for AGIs below $25k, 10.3% for AGIs $25k-50k, 5.9% for AGIs $50k-75k, 13.8% for AGIs $75k-100k, 54.3% for AGIs $100k-200k)
Ordinary dividends: $7,207 (reported on 5.3% of returns)
Here:
$7,207
State:
$10,044
(% of AGI for various income ranges: 6.7% for AGIs below $25k, 20.9% for AGIs $50k-75k, 319.3% for AGIs $100k-200k)
Net capital gain/loss in AGI: +$17,333 (reported on 5.6% of returns)
Here:
+$17,333
State:
+$39,590
(% of AGI for various income ranges: 17.8% for AGIs $25k-50k, 13.5% for AGIs $50k-75k, 181.1% for AGIs $100k-200k)
Profit/loss from business: +$10,577 (reported on 21.1% of returns)
Here:
+$10,577
State:
+$10,888
(% of AGI for various income ranges: 182.3% for AGIs below $25k, 92.1% for AGIs $25k-50k, 88.5% for AGIs $50k-75k, 109.5% for AGIs $75k-100k, 1305.4% for AGIs $100k-200k)
Taxable individual retirement arrangement distribution: $14,364 (reported on 4.1% of returns)
79745:
$14,364
Texas:
$24,740
(% of AGI for various income ranges: 22.6% for AGIs below $25k, 70.2% for AGIs $25k-50k, 124.4% for AGIs $50k-75k, 214.6% for AGIs $100k-200k)
Total itemized deductions: $30,517 (reported on 2.3% of returns)
Here:
$30,517
State:
$40,428
(% of AGI for various income ranges: 243.5% for AGIs $50k-75k, 358.2% for AGIs $100k-200k)
Charity contributions: $14,200 (reported on 1.1% of returns)
Here:
$14,200
State:
$18,201
(% of AGI for various income ranges: 152.1% for AGIs $100k-200k)
Taxes paid: $4,460 (reported on 1.9% of returns)
79745:
$4,460
State:
$7,821
(% of AGI for various income ranges: 23.8% for AGIs $50k-75k, 50.7% for AGIs $100k-200k)
Earned income credit: $2,564 (reported on 22.2% of returns)
Here:
$2,564
State:
$2,584
(% of AGI for various income ranges: 147.9% for AGIs below $25k, 92.6% for AGIs $25k-50k)
Percentage of individuals using paid preparers for their 2020 taxes: 87.6%
Here:
88%
State:
92%
(% for various income ranges: 85.7% for AGIs below $25k, 85.5% for AGIs $25k-50k, 90.7% for AGIs $50k-75k, 88.9% for AGIs $75k-100k, 89.5% for AGIs $100k-200k, 100.0% for AGIs over 200k)
Averages for the 2012 tax year for zip code 79745, filed in 2013:
Average Adjusted Gross Income (AGI) in 2012: $60,401 (Individual Income Tax Returns)
Here:
$60,401
State:
$65,384
Salary/wage: $49,211 (reported on 88.2% of returns)
Here:
$49,211
State:
$52,524
(% of AGI for various income ranges: 82.0% for AGIs below $25k, 85.0% for AGIs $25k-50k, 90.3% for AGIs $50k-75k, 90.1% for AGIs $75k-100k, 81.0% for AGIs $100k-200k, 18.1% for AGIs over 200k)
Taxable interest for individuals: $1,077 (reported on 23.3% of returns)
This zip code:
$1,077
Texas:
$2,372
(% of AGI for various income ranges: 0.4% for AGIs below $25k, 0.3% for AGIs $25k-50k, 0.2% for AGIs $50k-75k, 0.1% for AGIs $75k-100k, 0.4% for AGIs $100k-200k, 1.0% for AGIs over 200k)
Ordinary dividends: $3,868 (reported on 7.3% of returns)
Here:
$3,868
State:
$9,721
(% of AGI for various income ranges: 0.9% for AGIs below $25k, 0.6% for AGIs $25k-50k, 0.5% for AGIs $50k-75k, 0.3% for AGIs $100k-200k, 0.8% for AGIs over 200k)
Net capital gain/loss in AGI: +$14,250 (reported on 5.3% of returns)
Here:
+$14,250
State:
+$35,319
(% of AGI for various income ranges: 0.2% for AGIs $25k-50k, 0.8% for AGIs $100k-200k, 5.1% for AGIs over 200k)
Profit/loss from business: +$18,948 (reported on 16.8% of returns)
Here:
+$18,948
State:
+$13,732
(% of AGI for various income ranges: 7.5% for AGIs below $25k, 4.2% for AGIs $25k-50k, 2.2% for AGIs $50k-75k, 2.9% for AGIs $75k-100k, 4.9% for AGIs $100k-200k, 10.1% for AGIs over 200k)
Taxable individual retirement arrangement distribution: $13,227 (reported on 5.7% of returns)
79745:
$13,227
Texas:
$19,511
(% of AGI for various income ranges: 2.0% for AGIs below $25k, 2.0% for AGIs $25k-50k, 1.3% for AGIs $50k-75k, 1.0% for AGIs $75k-100k, 1.9% for AGIs $100k-200k)
Total itemized deductions: $26,306 (19% of AGI, reported on 12.2% of returns)
Here:
$26,306
State:
$24,724
Here:
19.1% of AGI
State:
15.9% of AGI
(% of AGI for various income ranges: 5.4% for AGIs $25k-50k, 7.4% for AGIs $50k-75k, 6.4% for AGIs $75k-100k, 6.3% for AGIs $100k-200k, 3.3% for AGIs over 200k)
Charity contributions: $7,163 (reported on 7.3% of returns)
Here:
$7,163
State:
$6,808
(% of AGI for various income ranges: 0.5% for AGIs $25k-50k, 0.8% for AGIs $50k-75k, 0.7% for AGIs $75k-100k, 1.2% for AGIs $100k-200k, 1.2% for AGIs over 200k)
Taxes paid: $3,770 (reported on 11.5% of returns)
79745:
$3,770
State:
$6,921
(% of AGI for various income ranges: 0.5% for AGIs $25k-50k, 0.8% for AGIs $50k-75k, 0.8% for AGIs $75k-100k, 0.8% for AGIs $100k-200k, 0.8% for AGIs over 200k)
Earned income credit: $2,566 (reported on 21.4% of returns)
Here:
$2,566
State:
$2,570
(% of AGI for various income ranges: 10.0% for AGIs below $25k, 1.4% for AGIs $25k-50k)
Percentage of individuals using paid preparers for their 2012 taxes: 62.6%
Here:
63%
State:
51%
(% for various income ranges: 56.0% for AGIs below $25k, 62.1% for AGIs $25k-50k, 65.2% for AGIs $50k-75k, 66.7% for AGIs $75k-100k, 71.0% for AGIs $100k-200k, 83.3% for AGIs over 200k)
Averages for the 2004 tax year for zip code 79745, filed in 2005:
Average Adjusted Gross Income (AGI) in 2004: $42,350 (Individual Income Tax Returns)
Here:
$42,350
State:
$47,881
Salary/wage: $31,143 (reported on 84.9% of returns)
Here:
$31,143
State:
$41,947
(% of AGI for various income ranges: 92.8% for AGIs below $10k, 78.6% for AGIs $10k-25k, 88.0% for AGIs $25k-50k, 83.3% for AGIs $50k-75k, 78.3% for AGIs $75k-100k, 16.8% for AGIs over 100k)
Taxable interest for individuals: $1,993 (reported on 33.2% of returns)
This zip code:
$1,993
Texas:
$2,255
(% of AGI for various income ranges: 2.6% for AGIs below $10k, 1.9% for AGIs $10k-25k, 0.8% for AGIs $25k-50k, 0.8% for AGIs $50k-75k, 1.1% for AGIs $75k-100k, 2.5% for AGIs over 100k)
Taxable dividends: $2,244 (reported on 10.8% of returns)
Here:
$2,244
State:
$4,261
(% of AGI for various income ranges: 2.3% for AGIs below $10k, 0.8% for AGIs $10k-25k, 0.6% for AGIs $25k-50k, 0.4% for AGIs $50k-75k, 0.3% for AGIs $75k-100k, 0.5% for AGIs over 100k)
Net capital gain/loss: +$31,839 (reported on 9.6% of returns)
Here:
+$31,839
State:
+$16,110
(% of AGI for various income ranges: -0.7% for AGIs below $10k, -0.1% for AGIs $10k-25k, -0.0% for AGIs $25k-50k, 0.7% for AGIs $50k-75k, 0.2% for AGIs $75k-100k, 22.3% for AGIs over 100k)
Profit/loss from business: +$8,560 (reported on 14.4% of returns)
Here:
+$8,560
State:
+$11,013
(% of AGI for various income ranges: -8.5% for AGIs below $10k, 4.3% for AGIs $10k-25k, 1.6% for AGIs $25k-50k, 2.2% for AGIs $50k-75k, 3.3% for AGIs $75k-100k, 4.6% for AGIs over 100k)
IRA payment deduction: $2,276 (reported on 1.3% of returns)
79745:
$2,276
Texas:
$3,120
Total itemized deductions: $18,930 (24% of AGI, reported on 10.1% of returns)
Here:
$18,930
State:
$19,631
Here:
23.8% of AGI
State:
18.9% of AGI
(% of AGI for various income ranges: 4.5% for AGIs $10k-25k, 4.9% for AGIs $25k-50k, 6.8% for AGIs $50k-75k, 7.1% for AGIs $75k-100k, 2.3% for AGIs over 100k)
Charity contributions deductions: $5,374 (5% of AGI, reported on 6.9% of returns)
Here:
$5,374
State:
$4,753
Here:
5.3% of AGI
State:
4.2% of AGI
(% of AGI for various income ranges: 0.7% for AGIs $10k-25k, 0.4% for AGIs $25k-50k, 0.8% for AGIs $50k-75k, 1.7% for AGIs $75k-100k, 1.1% for AGIs over 100k)
Total tax: $7,150 (reported on 64.9% of returns)
79745:
$7,150
State:
$9,058
(% of AGI for various income ranges: 2.5% for AGIs below $10k, 3.2% for AGIs $10k-25k, 5.0% for AGIs $25k-50k, 8.1% for AGIs $50k-75k, 11.1% for AGIs $75k-100k, 20.5% for AGIs over 100k)
Earned income credit: $1,788 (reported on 26.3% of returns)
Here:
$1,788
State:
$2,024
Percentage of individuals using paid preparers for their 2004 taxes: 72.8%
Here:
73%
State:
57%
(% for various income ranges: 63.3% for AGIs below $10k, 76.3% for AGIs $10k-25k, 75.7% for AGIs $25k-50k, 74.2% for AGIs $50k-75k, 65.3% for AGIs $75k-100k, 89.3% for AGIs over 100k)
Household received Food Stamps/SNAP in the past 12 months: 336 Household did not receive Food Stamps/SNAP in the past 12 months: 2,134
Women who had a birth in the past 12 months: 104 (23 now married, 78 unmarried) Women who did not have a birth in the past 12 months: 1,281 (710 now married, 566 unmarried)
Housing units in zip code 79745 with a mortgage: 437 (19 second mortgage, 21 both second mortgage and home equity loan) Median monthly owner costs for units with a mortgage: $1,208 Median monthly owner costs for units without a mortgage: $463
Residents with income below the poverty level in 2022:
This zip code:
13.2%
Whole state:
14.0%
Residents with income below 50% of the poverty level in 2022:
This zip code:
9.0%
Whole state:
7.4%
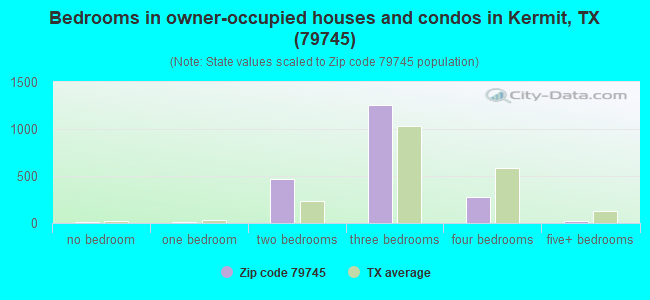
Median number of rooms in houses and condos:
Here:
6.1
State:
6.3
Median number of rooms in apartments:
Here:
4.9
State:
4.0
Notable locations in this zip code not listed on our city pages
Notable locations in zip code 79745: Cheyenne Farms (A), Dooley Windmill (B), East Leck Windmill (C), East Lehman Windmill (D), Haley Ranch (E), Hogg Windmill (F), Hugh Windmill (G), Little Sand Windmill (H), Lowe Windmill (I), Magnolia Windmill (J), Moore Windmill (K), North Crow Windmill (L), North Windmill (M), Parker Windmill (N), Simpson Windmill (O), South Crow Windmill (P), South Rusk Windmill (Q), South Sand Windmill (R), South Windmill (S), Star Camp (T). Display/hide their locations on the map
Churches in zip code 79745 include: Northside Baptist Church (A), Community Church (B), Church of God in Christ (C), Church of God (D), Church of Christ (E). Display/hide their locations on the map
In group quarters: 92 (-1 institutionalized population)
Size of family households: 741 2-persons, 340 3-persons, 266 4-persons, 263 5-persons, 105 6-persons, 104 7-or-more-persons
Size of nonfamily households: 572 1-person, 69 2-persons
1,166 married couples with children.
424 single-parent households (23 men, 401 women).
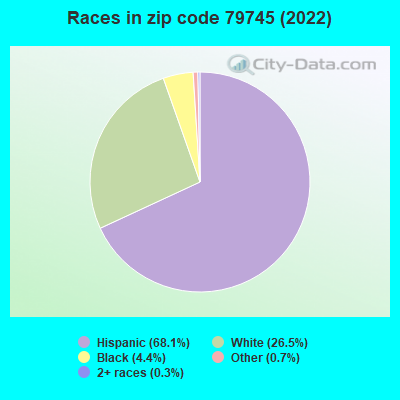
49.1% of residents of 79745 zip code speak English at home.
50.9% of residents speak Spanish at home (71% very well, 12% well, 14% not well, 4% not at all).
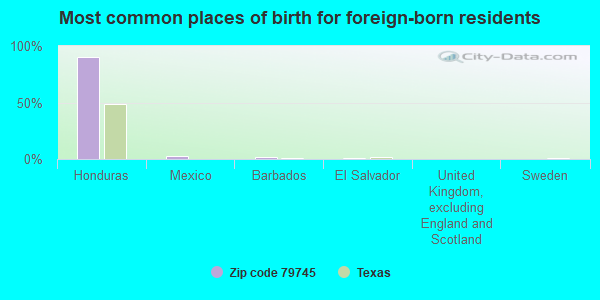
Foreign born population: 1,118 (16.6%) (59.1% of them are naturalized citizens)
This zip code:
16.6%
Whole state:
17.2%
91%Honduras
3%Mexico
2%Barbados
1%El Salvador
0%United Kingdom, excluding England and Scotland
0%Sweden
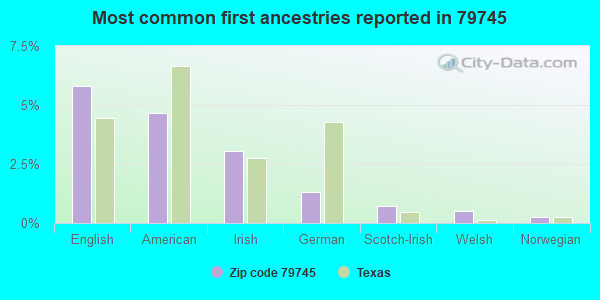
6%English
5%American
3%Irish
1%German
1%Scotch-Irish
0%Welsh
0%Norwegian
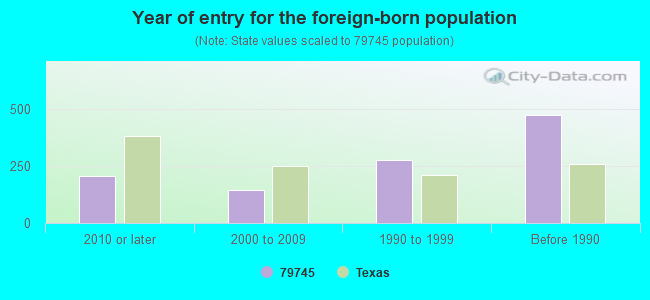
Year of entry for the foreign-born population
2062010 or later
1452000 to 2009
2791990 to 1999
475Before 1990
Facilities with environmental interests located in this zip code:
ARCO OIL AND GAS COMPANY (20 MI NW OF in KERMIT, TX)
(Resource Conservation and Recovery Act (tracking hazardous waste)) Alternative names: ARCO OIL & GAS CRITTENDON CROYGEN
Housing units lacking complete plumbing facilities: 4.3% Housing units lacking complete kitchen facilities: 6.5%
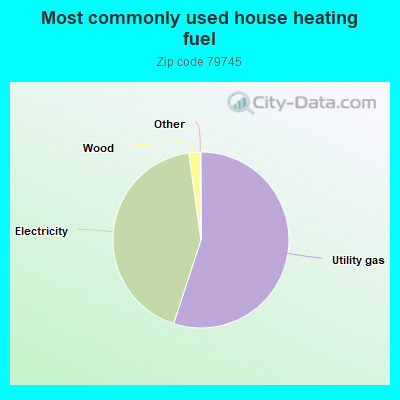
55.1%Utility gas
42.8%Electricity
2.1%Wood
Population in 1990: 7,370.
Place of birth for U.S.-born residents:
This state: 4,492
Northeast: 23
Midwest: 53
South: 493
West: 508
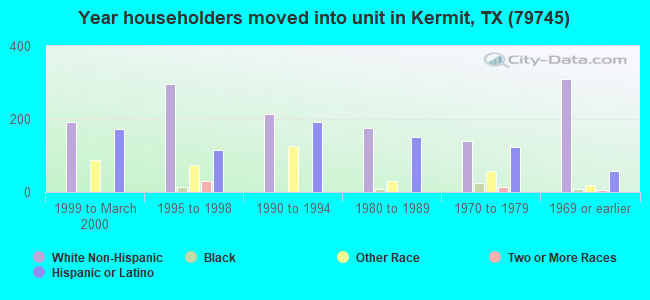
65% of the 79745 zip code residents lived in the same house 5 years ago. Out of people who lived in different houses, 53% lived in this county. Out of people who lived in different counties, 50% lived in Texas.
92% of the 79745 zip code residents lived in the same house 1 year ago. Out of people who lived in different houses, 51% moved from this county. Out of people who lived in different houses, 28% moved from different county within same state. Out of people who lived in different houses, 14% moved from different state. Out of people who lived in different houses, 8% moved from abroad.
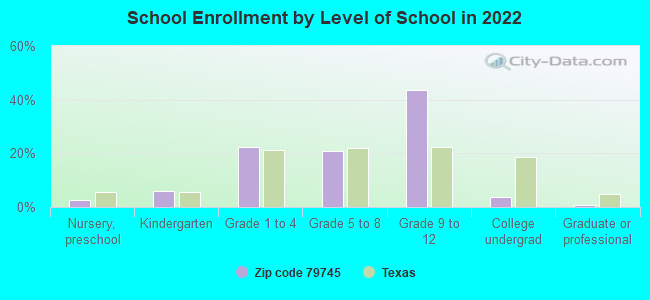
Private vs. public school enrollment:
Students in private schools in grades 1 to 8 (elementary and middle school): 15
Here:
2.3%
Texas:
8.8%
Students in private schools in grades 9 to 12 (high school): 24
Here:
3.6%
Texas:
8.0%
Students in private undergraduate colleges: 11
Here:
20.0%
Texas:
16.2%
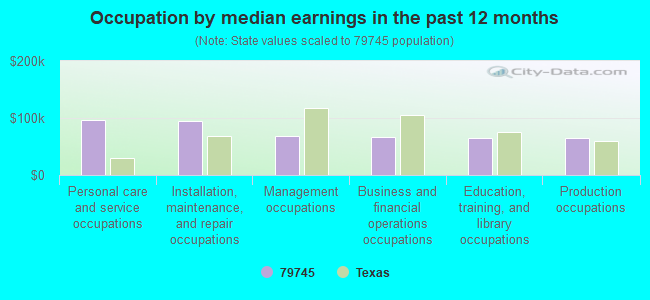
Occupation by median earnings in the past 12 months ($)
96,571Personal care and service occupations
94,887Installation, maintenance, and repair occupations
69,186Management occupations
66,854Business and financial operations occupations
64,548Education, training, and library occupations
64,123Production occupations
Top industries in this zip code by the number of employees in 2005:
Mining: Support Activities for Oil and Gas Operations (50-99 employees: 1 establishment, 20-49 employees: 1 establishment, 10-19 employees: 2 establishments, 5-9 employees: 1 establishment, 1-4 employees: 4 establishments)
Accommodation and Food Services: Limited-Service Restaurants (20-49: 2, 10-19: 1)
Health Care and Social Assistance: Nursing Care Facilities (50-99: 1)
Health Care and Social Assistance: General Medical and Surgical Hospitals (50-99: 1)
Mining: Natural Gas Liquid Extraction (20-49: 1, 5-9: 1)
Other Services (except Public Administration): General Automotive Repair (20-49: 1, 1-4: 2)
People in group quarters in 2010:
97 people in local jails and other municipal confinement facilities
People in group quarters in 2000:
97 people in local jails and other confinement facilities (including police lockups)
38 people in nursing homes
Fatal accident statistics in 2014:
Fatal accident count: 4
Vehicles involved in fatal accidents: 7
Fatal accidents caused by drunken drivers: 1
Fatalities: 4
Persons involved in fatal accidents: 15
Pedestrians involved in fatal accidents: 0
Fatal accident statistics in 2013:
Fatal accident count: 1
Vehicles involved in fatal accidents: 2
Fatal accidents caused by drunken drivers: 0
Fatalities: 2
Persons involved in fatal accidents: 3
Pedestrians involved in fatal accidents: 0
2005 - 2013 National Fire Incident Reporting System (NFIRS) incidents
According to the data from the years 2005 - 2013 the average number of fire incidents per year is 11. The highest number of fire incidents - 47 took place in 2011, and the least - 0 in 2006. The data has a growing trend.
When looking into fire subcategories, the most reports belonged to: Outside Fires (56.9%), and Structure Fires (28.4%).
Fire incident types reported to NFIRS in Zip Code 79745


 Nearest zip codes: 79789, 79788, 79756, 79777, 79759, 79741.


 According to the data from the years 2005 - 2013 the average number of fire incidents per year is 11. The highest number of fire incidents - 47 took place in 2011, and the least - 0 in 2006. The data has a growing trend.
 When looking into fire subcategories, the most reports belonged to: Outside Fires (56.9%), and Structure Fires (28.4%).