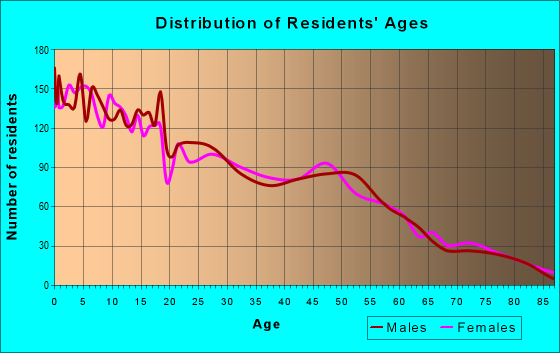
Estimated zip code population in 2022: 17,311 Zip code population in 2010: 13,574 Zip code population in 2000: 10,582
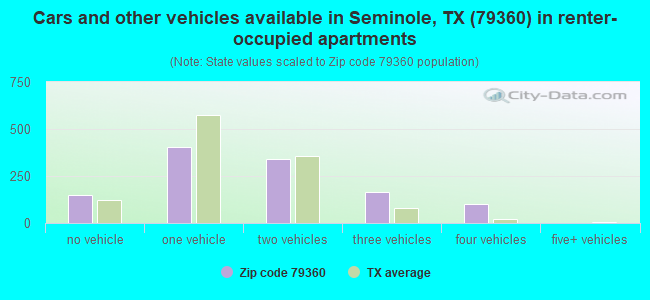
Houses and condos: 5,841 Renter-occupied apartments: 1,168
% of renters here:
21%
State:
38%
March 2022 cost of living index in zip code 79360: 78.9 (low, U.S. average is 100)
Land area: 849.6 sq. mi. Water area: 0.0 sq. mi.
Population density: 20 people per square mile
(very low).
OSM Map
General Map
Google Map
MSN Map
OSM Map
General Map
Google Map
MSN Map
OSM Map
General Map
Google Map
MSN Map
OSM Map
General Map
Google Map
MSN Map
Please wait while loading the map...
Real estate property taxes paid for housing units in 2022:
This zip code:
1.4% ($3,092)
Texas:
1.5% ($4,050)
Median real estate property taxes paid for housing units with mortgages in 2022: $4,045 (1.7%) Median real estate property taxes paid for housing units with no mortgage in 2022: $2,691 (1.4%)
Averages for the 2020 tax year for zip code 79360, filed in 2021:
Average Adjusted Gross Income (AGI) in 2020: $61,673 (Individual Income Tax Returns)
Here:
$61,673
State:
$77,054
Salary/wage: $53,987 (reported on 72.5% of returns)
Here:
$53,987
State:
$62,766
(% of AGI for various income ranges: 1329.7% for AGIs below $25k, 3859.3% for AGIs $25k-50k, 7405.0% for AGIs $50k-75k, 10448.9% for AGIs $75k-100k, 18538.9% for AGIs $100k-200k, 62385.0% for AGIs over 200k)
Taxable interest for individuals: $2,890 (reported on 16.0% of returns)
This zip code:
$2,890
Texas:
$2,665
(% of AGI for various income ranges: 6.4% for AGIs below $25k, 18.3% for AGIs $25k-50k, 31.1% for AGIs $50k-75k, 35.5% for AGIs $75k-100k, 123.1% for AGIs $100k-200k, 3331.7% for AGIs over 200k)
Ordinary dividends: $5,131 (reported on 7.1% of returns)
Here:
$5,131
State:
$10,044
(% of AGI for various income ranges: 7.3% for AGIs below $25k, 13.1% for AGIs $25k-50k, 26.7% for AGIs $50k-75k, 51.1% for AGIs $75k-100k, 102.7% for AGIs $100k-200k, 2400.0% for AGIs over 200k)
Net capital gain/loss in AGI: +$34,228 (reported on 9.3% of returns)
Here:
+$34,228
State:
+$39,590
(% of AGI for various income ranges: 5.4% for AGIs below $25k, 51.1% for AGIs $25k-50k, 98.0% for AGIs $50k-75k, 120.3% for AGIs $75k-100k, 466.7% for AGIs $100k-200k, 30126.7% for AGIs over 200k)
Profit/loss from business: +$18,085 (reported on 40.7% of returns)
Here:
+$18,085
State:
+$10,888
(% of AGI for various income ranges: 599.4% for AGIs below $25k, 997.3% for AGIs $25k-50k, 1088.3% for AGIs $50k-75k, 1067.1% for AGIs $75k-100k, 1478.2% for AGIs $100k-200k, 22641.7% for AGIs over 200k)
Taxable individual retirement arrangement distribution: $16,132 (reported on 2.8% of returns)
79360:
$16,132
Texas:
$24,740
(% of AGI for various income ranges: 12.3% for AGIs below $25k, 34.9% for AGIs $25k-50k, 50.2% for AGIs $50k-75k, 132.6% for AGIs $75k-100k, 207.6% for AGIs $100k-200k, 1243.3% for AGIs over 200k)
Total itemized deductions: $37,279 (reported on 4.2% of returns)
Here:
$37,279
State:
$40,428
(% of AGI for various income ranges: 142.0% for AGIs $25k-50k, 226.9% for AGIs $50k-75k, 241.1% for AGIs $75k-100k, 576.2% for AGIs $100k-200k, 7100.0% for AGIs over 200k)
Charity contributions: $19,679 (reported on 2.8% of returns)
Here:
$19,679
State:
$18,201
(% of AGI for various income ranges: 112.7% for AGIs $50k-75k, 166.4% for AGIs $100k-200k, 3781.7% for AGIs over 200k)
Taxes paid: $6,156 (reported on 3.6% of returns)
79360:
$6,156
State:
$7,821
(% of AGI for various income ranges: 11.0% for AGIs $25k-50k, 20.3% for AGIs $50k-75k, 36.8% for AGIs $75k-100k, 109.1% for AGIs $100k-200k, 1091.7% for AGIs over 200k)
Earned income credit: $2,619 (reported on 21.2% of returns)
Here:
$2,619
State:
$2,584
(% of AGI for various income ranges: 159.1% for AGIs below $25k, 143.8% for AGIs $25k-50k, 5.2% for AGIs $50k-75k)
Percentage of individuals using paid preparers for their 2020 taxes: 94.2%
Here:
94%
State:
92%
(% for various income ranges: 91.7% for AGIs below $25k, 95.2% for AGIs $25k-50k, 95.0% for AGIs $50k-75k, 96.6% for AGIs $75k-100k, 96.3% for AGIs $100k-200k, 96.4% for AGIs over 200k)
Averages for the 2012 tax year for zip code 79360, filed in 2013:
Average Adjusted Gross Income (AGI) in 2012: $56,494 (Individual Income Tax Returns)
Here:
$56,494
State:
$65,384
Salary/wage: $46,032 (reported on 78.8% of returns)
Here:
$46,032
State:
$52,524
(% of AGI for various income ranges: 66.5% for AGIs below $25k, 72.6% for AGIs $25k-50k, 80.5% for AGIs $50k-75k, 79.8% for AGIs $75k-100k, 69.8% for AGIs $100k-200k, 26.0% for AGIs over 200k)
Taxable interest for individuals: $1,741 (reported on 17.9% of returns)
This zip code:
$1,741
Texas:
$2,372
(% of AGI for various income ranges: 0.5% for AGIs below $25k, 0.3% for AGIs $25k-50k, 0.3% for AGIs $50k-75k, 0.4% for AGIs $75k-100k, 0.9% for AGIs $100k-200k, 0.7% for AGIs over 200k)
Ordinary dividends: $10,044 (reported on 7.2% of returns)
Here:
$10,044
State:
$9,721
(% of AGI for various income ranges: 0.7% for AGIs below $25k, 0.4% for AGIs $25k-50k, 0.1% for AGIs $50k-75k, 0.4% for AGIs $75k-100k, 0.9% for AGIs $100k-200k, 4.3% for AGIs over 200k)
Net capital gain/loss in AGI: +$26,221 (reported on 7.9% of returns)
Here:
+$26,221
State:
+$35,319
(% of AGI for various income ranges: 0.5% for AGIs $25k-50k, 0.7% for AGIs $50k-75k, 1.7% for AGIs $75k-100k, 3.4% for AGIs $100k-200k, 11.9% for AGIs over 200k)
Profit/loss from business: +$22,965 (reported on 30.3% of returns)
Here:
+$22,965
State:
+$13,732
(% of AGI for various income ranges: 26.2% for AGIs below $25k, 19.3% for AGIs $25k-50k, 8.6% for AGIs $50k-75k, 6.8% for AGIs $75k-100k, 7.2% for AGIs $100k-200k, 13.9% for AGIs over 200k)
Taxable individual retirement arrangement distribution: $12,957 (reported on 4.2% of returns)
79360:
$12,957
Texas:
$19,511
(% of AGI for various income ranges: 1.0% for AGIs below $25k, 0.3% for AGIs $25k-50k, 1.0% for AGIs $50k-75k, 0.6% for AGIs $75k-100k, 1.5% for AGIs $100k-200k, 1.1% for AGIs over 200k)
Total itemized deductions: $23,308 (18% of AGI, reported on 14.8% of returns)
Here:
$23,308
State:
$24,724
Here:
17.8% of AGI
State:
15.9% of AGI
(% of AGI for various income ranges: 2.8% for AGIs below $25k, 3.9% for AGIs $25k-50k, 5.8% for AGIs $50k-75k, 6.0% for AGIs $75k-100k, 8.8% for AGIs $100k-200k, 6.3% for AGIs over 200k)
Charity contributions: $8,220 (reported on 10.0% of returns)
Here:
$8,220
State:
$6,808
(% of AGI for various income ranges: 0.5% for AGIs below $25k, 0.6% for AGIs $25k-50k, 0.9% for AGIs $50k-75k, 1.2% for AGIs $75k-100k, 2.2% for AGIs $100k-200k, 2.2% for AGIs over 200k)
Taxes paid: $4,447 (reported on 13.7% of returns)
79360:
$4,447
State:
$6,921
(% of AGI for various income ranges: 0.4% for AGIs below $25k, 0.4% for AGIs $25k-50k, 0.8% for AGIs $50k-75k, 1.1% for AGIs $75k-100k, 1.8% for AGIs $100k-200k, 1.2% for AGIs over 200k)
Earned income credit: $2,317 (reported on 19.0% of returns)
Here:
$2,317
State:
$2,570
(% of AGI for various income ranges: 6.3% for AGIs below $25k, 1.6% for AGIs $25k-50k)
Percentage of individuals using paid preparers for their 2012 taxes: 76.0%
Here:
76%
State:
51%
(% for various income ranges: 75.3% for AGIs below $25k, 77.7% for AGIs $25k-50k, 74.7% for AGIs $50k-75k, 70.2% for AGIs $75k-100k, 76.8% for AGIs $100k-200k, 93.3% for AGIs over 200k)
Averages for the 2004 tax year for zip code 79360, filed in 2005:
Average Adjusted Gross Income (AGI) in 2004: $31,437 (Individual Income Tax Returns)
Here:
$31,437
State:
$47,881
Salary/wage: $28,112 (reported on 79.0% of returns)
Here:
$28,112
State:
$41,947
(% of AGI for various income ranges: 677.3% for AGIs below $10k, 72.6% for AGIs $10k-25k, 80.9% for AGIs $25k-50k, 77.0% for AGIs $50k-75k, 72.5% for AGIs $75k-100k, 42.9% for AGIs over 100k)
Taxable interest for individuals: $2,209 (reported on 23.8% of returns)
This zip code:
$2,209
Texas:
$2,255
(% of AGI for various income ranges: 18.7% for AGIs below $10k, 1.0% for AGIs $10k-25k, 0.7% for AGIs $25k-50k, 1.4% for AGIs $50k-75k, 1.7% for AGIs $75k-100k, 3.0% for AGIs over 100k)
Taxable dividends: $3,178 (reported on 9.6% of returns)
Here:
$3,178
State:
$4,261
(% of AGI for various income ranges: 7.1% for AGIs below $10k, 0.6% for AGIs $10k-25k, 0.3% for AGIs $25k-50k, 0.3% for AGIs $50k-75k, 1.0% for AGIs $75k-100k, 2.3% for AGIs over 100k)
Net capital gain/loss: +$6,581 (reported on 10.3% of returns)
Here:
+$6,581
State:
+$16,110
(% of AGI for various income ranges: 25.5% for AGIs below $10k, 0.8% for AGIs $10k-25k, 0.4% for AGIs $25k-50k, 1.2% for AGIs $50k-75k, 2.2% for AGIs $75k-100k, 5.0% for AGIs over 100k)
Profit/loss from business: +$10,323 (reported on 29.8% of returns)
Here:
+$10,323
State:
+$11,013
(% of AGI for various income ranges: 112.3% for AGIs below $10k, 17.6% for AGIs $10k-25k, 9.4% for AGIs $25k-50k, 3.5% for AGIs $50k-75k, 4.6% for AGIs $75k-100k, 10.4% for AGIs over 100k)
Profit/loss from farming: +$21,741 (reported on 8.0% of returns)
Here:
+$21,741
State:
-$9,403
(% of AGI for various income ranges: -186.3% for AGIs below $10k, 2.3% for AGIs $10k-25k, 0.1% for AGIs $25k-50k, 3.3% for AGIs $50k-75k, 5.3% for AGIs $75k-100k, 18.3% for AGIs over 100k)
IRA payment deduction: $4,053 (reported on 2.2% of returns)
79360:
$4,053
Texas:
$3,120
(% of AGI for various income ranges: 0.1% for AGIs $10k-25k, 0.2% for AGIs $25k-50k, 0.2% for AGIs $50k-75k, 0.4% for AGIs $75k-100k, 0.5% for AGIs over 100k)
Self-employed pension: $30,312 (reported on 0.4% of returns)
Here:
$30,312
Texas:
$16,401
Total itemized deductions: $16,199 (21% of AGI, reported on 9.2% of returns)
Here:
$16,199
State:
$19,631
Here:
20.7% of AGI
State:
18.9% of AGI
(% of AGI for various income ranges: 12.7% for AGIs below $10k, 3.2% for AGIs $10k-25k, 3.4% for AGIs $25k-50k, 4.8% for AGIs $50k-75k, 5.3% for AGIs $75k-100k, 6.5% for AGIs over 100k)
Charity contributions deductions: $6,256 (8% of AGI, reported on 7.8% of returns)
Here:
$6,256
State:
$4,753
Here:
7.6% of AGI
State:
4.2% of AGI
(% of AGI for various income ranges: 0.6% for AGIs $10k-25k, 0.8% for AGIs $25k-50k, 1.6% for AGIs $50k-75k, 1.9% for AGIs $75k-100k, 2.8% for AGIs over 100k)
Total tax: $5,248 (reported on 68.3% of returns)
79360:
$5,248
State:
$9,058
(% of AGI for various income ranges: 55.2% for AGIs below $10k, 5.3% for AGIs $10k-25k, 5.9% for AGIs $25k-50k, 9.4% for AGIs $50k-75k, 12.4% for AGIs $75k-100k, 20.9% for AGIs over 100k)
Earned income credit: $2,051 (reported on 29.3% of returns)
Here:
$2,051
State:
$2,024
Percentage of individuals using paid preparers for their 2004 taxes: 74.0%
Here:
74%
State:
57%
(% for various income ranges: 69.9% for AGIs below $10k, 78.1% for AGIs $10k-25k, 74.4% for AGIs $25k-50k, 70.2% for AGIs $50k-75k, 67.8% for AGIs $75k-100k, 82.7% for AGIs over 100k)
Household received Food Stamps/SNAP in the past 12 months: 185 Household did not receive Food Stamps/SNAP in the past 12 months: 5,227
Women who had a birth in the past 12 months: 347 (354 now married, 0 unmarried) Women who did not have a birth in the past 12 months: 3,658 (2,400 now married, 1,233 unmarried)
Housing units in zip code 79360 with a mortgage: 1,900 (80 second mortgage, 86 both second mortgage and home equity loan) Median monthly owner costs for units with a mortgage: $1,675 Median monthly owner costs for units without a mortgage: $574
Residents with income below the poverty level in 2022:
This zip code:
13.1%
Whole state:
14.0%
Residents with income below 50% of the poverty level in 2022:
This zip code:
7.1%
Whole state:
7.4%
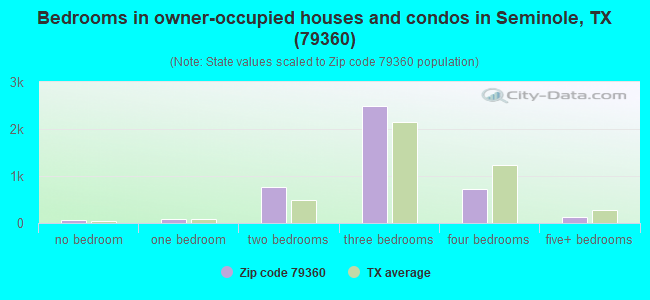
Median number of rooms in houses and condos:
Here:
6.0
State:
6.3
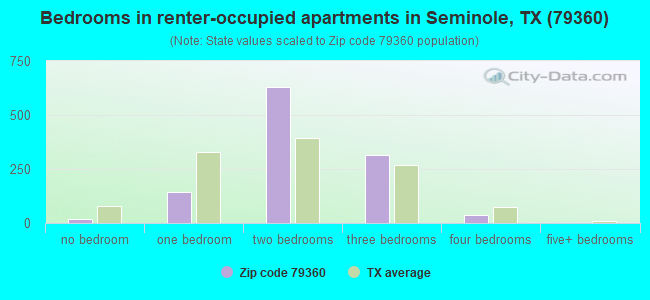
Median number of rooms in apartments:
Here:
4.2
State:
4.0
Notable locations in this zip code not listed on our city pages
Notable locations in zip code 79360: Brinson Ranch (A), Cedar Point Ranch (B), Cedar Point Windmill (C), Gaines County Courthouse (D), Seminole Volunteer Fire Department (E), Seminole Emergency Medical Service (F). Display/hide their locations on the map
Churches in zip code 79360 include: Trinity Baptist Church (A), Temple Baptist Church (B), First Baptist Church (C), First Presbyterian Church (D), Church of Christ (E). Display/hide their locations on the map
In group quarters: 137 (-1 institutionalized population)
Size of family households: 1,642 2-persons, 602 3-persons, 632 4-persons, 800 5-persons, 278 6-persons, 212 7-or-more-persons
Size of nonfamily households: 852 1-person, 366 2-persons, 24 3-persons
5,204 married couples with children.
248 single-parent households (70 men, 178 women).
44.0% of residents of 79360 zip code speak English at home.
19.4% of residents speak Spanish at home (53% very well, 31% well, 9% not well, 6% not at all).
40.1% of residents speak other Indo-European language at home (49% very well, 39% well, 9% not well, 3% not at all).
0.5% of residents speak Asian or Pacific Island language at home (84% very well, 16% not well).
0.1% of residents speak other language at home (100% very well).
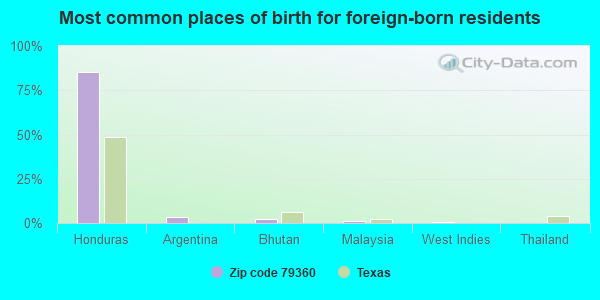
Foreign born population: 4,516 (26.1%) (43.8% of them are naturalized citizens)
This zip code:
26.1%
Whole state:
17.2%
85%Honduras
3%Argentina
3%Bhutan
1%Malaysia
0%West Indies
0%Thailand
0%Sudan
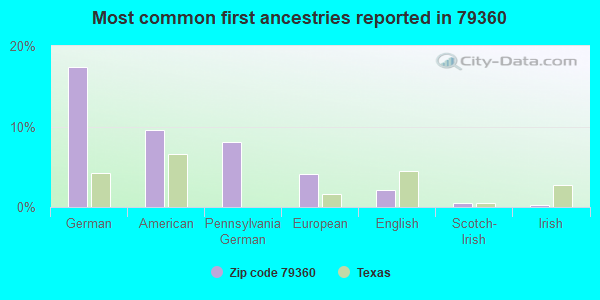
17%German
10%American
8%Pennsylvania German
4%European
2%English
1%Scotch-Irish
0%Irish
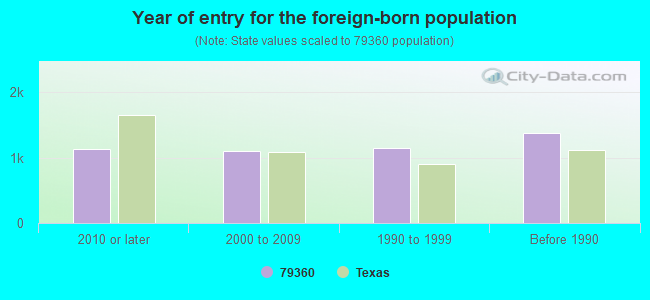
Year of entry for the foreign-born population
1,1302010 or later
1,1082000 to 2009
1,1561990 to 1999
1,373Before 1990
Facilities with environmental interests located in this zip code:
ANDERSON GRAIN CORP (RT 4 HWY 62 in SEMINOLE, TX)
(Integrated Compliance Information System) - ICIS-06-1997-0566, FORMAL ENFORCEMENT ACTION COMPLIANCE ACTIVITY (Tracking inspections of insecticide, fungicide, and rodenticide, and toxic substances) Business SIC classification: SPECIALTY CLEANING, POLISHING, AND SANITATION PREPARATIONS; FARM PRODUCT WAREHOUSING AND STORAGE; GRAIN AND FIELD BEANS
AMERADA HESS SEMINOLE GAS PROCESSING PLA (3.5 MILES NORTH, STATE HWY. 214 in SEMINOLE, TX)
AIR MAJOR (AIRS/AFS) CRITERIA AND HAZARDOUS AIR POLLUTANT INVENTORY (Inventory of air pollution sources) HAZARDOUS WASTE BIENNIAL REPORTER (Resource Conservation and Recovery Act (tracking hazardous waste)) Small Quantity Generators, between 100 kg and 1000 kg of hazardous waste/month (Resource Conservation and Recovery Act (tracking hazardous waste)) Business SIC classification: CRUDE PETROLEUM AND NATURAL GAS; NATURAL GAS LIQUIDS Business NAICS classification: NATURAL GAS LIQUID EXTRACTION. Organizations: AMERADA HESS CORPORATION (CONTACT/OPERATOR)
Alternative names: AMERADA HESS CORP (SEMINOLE GAS PLANT), SEMINOLE GAS PROCESSING PLANT
AMERADA HESS CORPORATION (HWY 214 2.5 MI NO OF in SEMINOLE, TX)
(Resource Conservation and Recovery Act (tracking hazardous waste)) Business NAICS classification: CRUDE PETROLEUM AND NATURAL GAS EXTRACTION. Alternative names: AMERADA HESS PUMP SHOP
ARCO PIPE LINE COMPANY (10 MILES OF in SEMINOLE, TX)
(Resource Conservation and Recovery Act (tracking hazardous waste)) Organizations: ARCO PIPELINE CO (CONTACT/OPERATOR)
Alternative names: ARCO PIPELINE CO WOOD STATION, NAVAJO PIPELINE WOOD STATION, TEPPCO CRUDE WOOD STATION
AIR MAJOR (AIRS/AFS) AIR MINOR (AIRS/AFS) Business SIC classification: CRUDE PETROLEUM AND NATURAL GAS
ADDISON FLYING SERVICE (RT 4 BOX 395 in SEMINOLE, TX)
(Resource Conservation and Recovery Act (tracking hazardous waste))
ANDERSON WELDING & MACHINE SVC (604 SE 2ND ST in SEMINOLE, TX)
Small Quantity Generators, between 100 kg and 1000 kg of hazardous waste/month (Resource Conservation and Recovery Act (tracking hazardous waste)) - notification Business NAICS classification: CONSUMER ELECTRONICS REPAIR AND MAINTENANCE.
Housing units lacking complete plumbing facilities: 2.7% Housing units lacking complete kitchen facilities: 4.5%
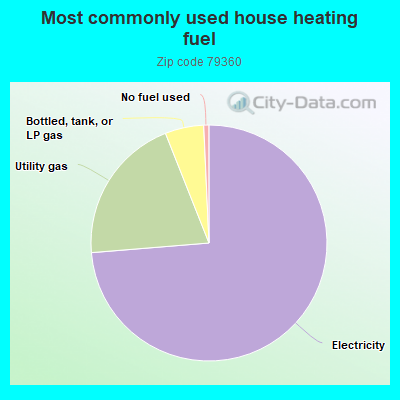
73.7%Electricity
20.3%Utility gas
5.3%Bottled, tank, or LP gas
0.7%No fuel used
Population in 1990: 10,423. Population change in the 1990s: +159 (+1.5%).
Place of birth for U.S.-born residents:
This state: 10,212
Northeast: 119
Midwest: 547
South: 494
West: 1,031
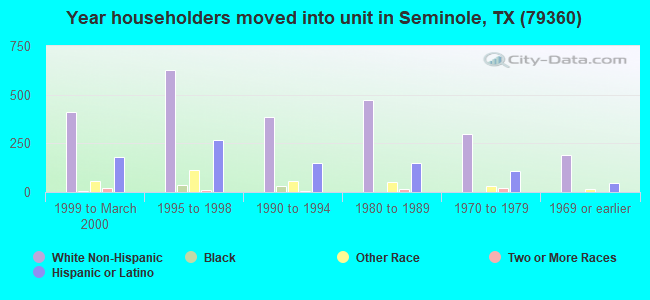
58% of the 79360 zip code residents lived in the same house 5 years ago. Out of people who lived in different houses, 70% lived in this county. Out of people who lived in different counties, 50% lived in Texas.
91% of the 79360 zip code residents lived in the same house 1 year ago. Out of people who lived in different houses, 31% moved from this county. Out of people who lived in different houses, 56% moved from different county within same state. Out of people who lived in different houses, 16% moved from different state.
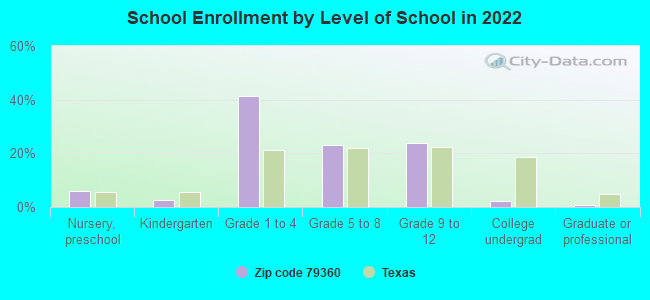
Private vs. public school enrollment:
Students in private schools in grades 1 to 8 (elementary and middle school): 1,077
Here:
39.0%
Texas:
8.8%
Students in private schools in grades 9 to 12 (high school): 65
Here:
6.7%
Texas:
8.0%
Students in private undergraduate colleges: 4
Here:
5.0%
Texas:
16.2%
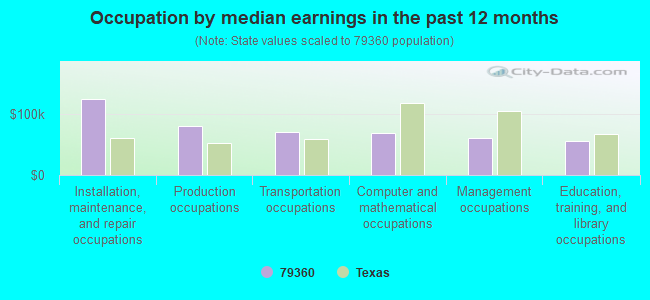
Occupation by median earnings in the past 12 months ($)
124,718Installation, maintenance, and repair occupations
80,793Production occupations
69,959Transportation occupations
69,198Computer and mathematical occupations
61,073Management occupations
56,062Education, training, and library occupations
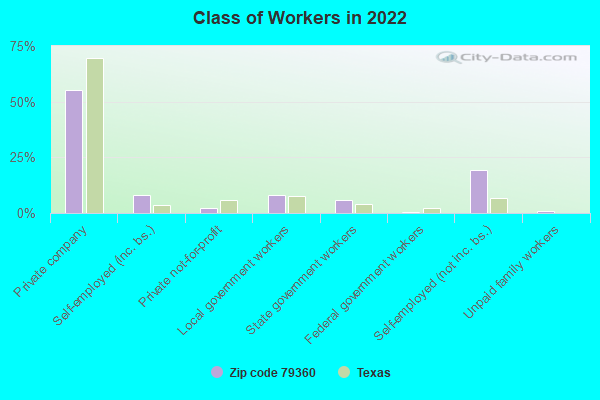
Top industries in this zip code by the number of employees in 2005:
Health Care and Social Assistance: General Medical and Surgical Hospitals (100-249: 1)
Other Services (except Public Administration): Commercial and Industrial Machinery and Equipment (except Automotive and Electronic) Repair and Maintenance (50-99: 1, 20-49: 2, 5-9: 1, 1-4: 3)
Other Services (except Public Administration): Religious Organizations (10-19: 1, 5-9: 7, 1-4: 9)
Wholesale Trade: Other Chemical and Allied Products Merchant Wholesalers (50-99: 1, 1-4: 1)
Wholesale Trade: Grain and Field Bean Merchant Wholesalers (50-99: 1)
Mining: Support Activities for Oil and Gas Operations (20-49: 1, 10-19: 1, 5-9: 1, 1-4: 3)
People in group quarters in 2010:
65 people in nursing facilities/skilled-nursing facilities
20 people in local jails and other municipal confinement facilities
People in group quarters in 2000:
68 people in nursing homes
25 people in local jails and other confinement facilities (including police lockups)
2 people in religious group quarters
Fatal accident statistics in 2014:
Fatal accident count: 3
Vehicles involved in fatal accidents: 5
Fatal accidents caused by drunken drivers: 0
Fatalities: 3
Persons involved in fatal accidents: 8
Pedestrians involved in fatal accidents: 0
Fatal accident statistics in 2013:
Fatal accident count: 6
Vehicles involved in fatal accidents: 9
Fatal accidents caused by drunken drivers: 3
Fatalities: 6
Persons involved in fatal accidents: 11
Pedestrians involved in fatal accidents: 0
2002 - 2018 National Fire Incident Reporting System (NFIRS) incidents
According to the data from the years 2002 - 2018 the average number of fires per year is 7. The highest number of reported fire incidents - 59 took place in 2003, and the least - 0 in 2004. The data has a dropping trend.
When looking into fire subcategories, the most reports belonged to: Outside Fires (65.8%), and Mobile Property/Vehicle Fires (15.8%).
Fire incident types reported to NFIRS in Zip Code 79360


+$21,741
-$9,403
(% of AGI for various income ranges: -186.3% for AGIs below $10k, 2.3% for AGIs $10k-25k, 0.1% for AGIs $25k-50k, 3.3% for AGIs $50k-75k, 5.3% for AGIs $75k-100k, 18.3% for AGIs over 100k) Nearest zip codes: 79323, 79359, 79714, 79378, 79342, 88242.
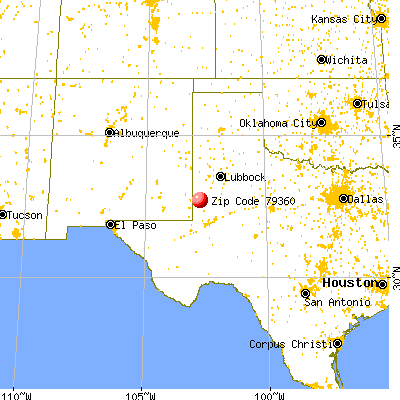
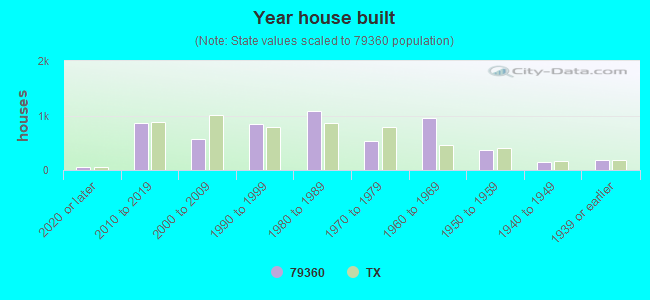


 According to the data from the years 2002 - 2018 the average number of fires per year is 7. The highest number of reported fire incidents - 59 took place in 2003, and the least - 0 in 2004. The data has a dropping trend.
 When looking into fire subcategories, the most reports belonged to: Outside Fires (65.8%), and Mobile Property/Vehicle Fires (15.8%).