Estimated zip code population in 2019: 1,442 Zip code population in 2010: 976 Zip code population in 2000: 465
Houses and condos: 602 Renter-occupied apartments: 39
% of renters here:
7%
State:
38%
March 2019 cost of living index in zip code 79012: 77.6 (low, U.S. average is 100)
Land area: 66.6 sq. mi. Water area: 0.1 sq. mi.
Population density: 22 people per square mile
(very low).
OSM Map
General Map
Google Map
MSN Map
OSM Map
General Map
Google Map
MSN Map
OSM Map
General Map
Google Map
MSN Map
OSM Map
General Map
Google Map
MSN Map
Please wait while loading the map...
Real estate property taxes paid for housing units in 2019:
This zip code:
1.6% ($4,575)
Texas:
1.7% ($3,390)
Median real estate property taxes paid for housing units with mortgages in 2019: $4,644 (1.7%) Median real estate property taxes paid for housing units with no mortgage in 2019: $4,456 (1.2%)
Business Search- 14 Million verified businesses
Males: 820
(56.9%)
Females: 621
(43.1%)
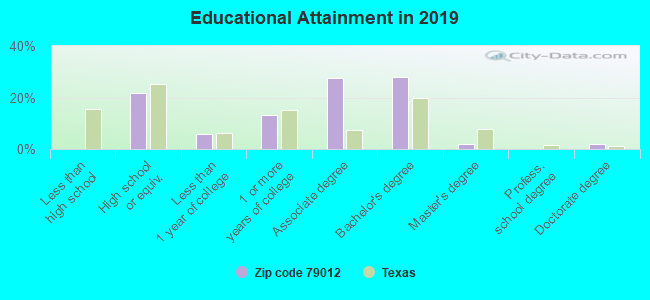
For population 25 years and over in 79012:
High school or higher: 100.9%
Bachelor's degree or higher: 32.3%
Graduate or professional degree: 4.0%
Mean travel time to work (commute): 26.3 minutes
For population 15 years and over in 79012:
Never married: 30.0%
Now married: 66.2%
Separated: 0.0%
Widowed: 0.0%
Divorced: 3.7%
Zip code 79012 compared to state average:
Median household income above state average.
Unemployed percentage significantly below state average.
Black race population percentage significantly below state average.
Hispanic race population percentage significantly below state average.
Foreign-born population percentage significantly below state average.
Renting percentage significantly below state average.
Length of stay since moving in significantly below state average.
Estimated median house/condo value in 2019: $288,047
79012:
$288,047
Texas:
$200,400
According to our research of Texas and other state lists, there was 1 registered sex offender living in 79012 zip code as of May 25, 2024. The ratio of all residents to sex offenders in zip code 79012 is 1,408 to 1. The ratio of registered sex offenders to all residents in this zip code is much lower than the state average.
Median resident age:
This zip code:
35.2 years
Texas median age:
35.1 years
Average household size:
This zip code:
2.7 people
Texas:
2.8 people
Averages for the 2012 tax year for zip code 79012, filed in 2013:
Average Adjusted Gross Income (AGI) in 2012: $94,012 (Individual Income Tax Returns)
Here:
$94,012
State:
$65,384
Salary/wage: $75,231 (reported on 86.4% of returns)
Here:
$75,231
State:
$52,524
(% of AGI for various income ranges: 79.4% for AGIs below $25k, 80.7% for AGIs $25k-50k, 78.7% for AGIs $50k-75k, 85.1% for AGIs $75k-100k, 89.3% for AGIs $100k-200k, 31.0% for AGIs over 200k)
Taxable interest for individuals: $659 (reported on 37.3% of returns)
This zip code:
$659
Texas:
$2,372
(% of AGI for various income ranges: 0.4% for AGIs below $25k, 1.0% for AGIs $25k-50k, 0.1% for AGIs $75k-100k, 0.5% for AGIs over 200k)
Ordinary dividends: $2,522 (reported on 15.3% of returns)
Here:
$2,522
State:
$9,721
Net capital gain/loss in AGI: +$14,156 (reported on 15.3% of returns)
Here:
+$14,156
State:
+$35,319
Profit/loss from business: +$16,121 (reported on 23.7% of returns)
Here:
+$16,121
State:
+$13,732
(% of AGI for various income ranges: 24.8% for AGIs below $25k, 4.7% for AGIs $50k-75k, 4.7% for AGIs $75k-100k, 5.8% for AGIs $100k-200k)
Taxable individual retirement arrangement distribution: $16,575 (reported on 6.8% of returns)
79012:
$16,575
Texas:
$19,511
Total itemized deductions: $23,404 (15% of AGI, reported on 42.4% of returns)
Here:
$23,404
State:
$24,724
Here:
15.0% of AGI
State:
15.9% of AGI
(% of AGI for various income ranges: 15.1% for AGIs $25k-50k, 15.3% for AGIs $50k-75k, 11.1% for AGIs $75k-100k, 12.4% for AGIs $100k-200k, 7.1% for AGIs over 200k)
Charity contributions: $7,286 (reported on 37.3% of returns)
Here:
$7,286
State:
$6,808
(% of AGI for various income ranges: 5.0% for AGIs $50k-75k, 2.1% for AGIs $75k-100k, 2.8% for AGIs $100k-200k, 3.6% for AGIs over 200k)
Taxes paid: $5,660 (reported on 42.4% of returns)
79012:
$5,660
State:
$6,921
(% of AGI for various income ranges: 4.9% for AGIs below $25k, 3.2% for AGIs $50k-75k, 2.8% for AGIs $75k-100k, 3.4% for AGIs $100k-200k, 1.4% for AGIs over 200k)
Earned income credit: $2,540 (reported on 8.5% of returns)
Here:
$2,540
State:
$2,570
(% of AGI for various income ranges: 7.7% for AGIs below $25k)
Percentage of individuals using paid preparers for their 2012 taxes: 50.8%
Here:
51%
State:
51%
(% for various income ranges: 37.5% for AGIs below $25k, 57.1% for AGIs $25k-50k, 66.7% for AGIs $50k-75k, 44.4% for AGIs $75k-100k, 52.9% for AGIs $100k-200k, 75.0% for AGIs over 200k)
Averages for the 2004 tax year for zip code 79012, filed in 2005:
Average Adjusted Gross Income (AGI) in 2004: $61,316 (Individual Income Tax Returns)
Here:
$61,316
State:
$47,881
Salary/wage: $57,187 (reported on 89.5% of returns)
Here:
$57,187
State:
$41,947
(% of AGI for various income ranges: 116.3% for AGIs below $10k, 76.9% for AGIs $10k-25k, 71.6% for AGIs $25k-50k, 92.2% for AGIs $50k-75k, 93.7% for AGIs $75k-100k, 75.2% for AGIs over 100k)
Taxable interest for individuals: $631 (reported on 46.1% of returns)
This zip code:
$631
Texas:
$2,255
(% of AGI for various income ranges: 1.5% for AGIs $10k-25k, 0.5% for AGIs $25k-50k, 0.4% for AGIs $50k-75k, 0.1% for AGIs $75k-100k, 0.6% for AGIs over 100k)
Taxable dividends: $294 (reported on 21.1% of returns)
Here:
$294
State:
$4,261
(% of AGI for various income ranges: 0.3% for AGIs $10k-25k, 0.1% for AGIs $50k-75k, 0.1% for AGIs $75k-100k, 0.1% for AGIs over 100k)
Net capital gain/loss: +$214 (reported on 17.3% of returns)
Here:
+$214
State:
+$16,110
(% of AGI for various income ranges: -0.6% for AGIs $50k-75k, -0.3% for AGIs $75k-100k, 0.7% for AGIs over 100k)
Profit/loss from business: +$12,508 (reported on 19.5% of returns)
Here:
+$12,508
State:
+$11,013
Total itemized deductions: $17,972 (21% of AGI, reported on 44.0% of returns)
Here:
$17,972
State:
$19,631
Here:
20.6% of AGI
State:
18.9% of AGI
(% of AGI for various income ranges: 14.1% for AGIs $25k-50k, 12.0% for AGIs $50k-75k, 14.9% for AGIs $75k-100k, 13.5% for AGIs over 100k)
Charity contributions deductions: $4,356 (5% of AGI, reported on 36.5% of returns)
Here:
$4,356
State:
$4,753
Here:
4.8% of AGI
State:
4.2% of AGI
(% of AGI for various income ranges: 1.5% for AGIs $25k-50k, 1.9% for AGIs $50k-75k, 2.6% for AGIs $75k-100k, 3.7% for AGIs over 100k)
Total tax: $7,416 (reported on 87.0% of returns)
79012:
$7,416
State:
$9,058
(% of AGI for various income ranges: 4.4% for AGIs $10k-25k, 6.2% for AGIs $25k-50k, 8.2% for AGIs $50k-75k, 9.0% for AGIs $75k-100k, 15.3% for AGIs over 100k)
Earned income credit: $1,545 (reported on 10.2% of returns)
Here:
$1,545
State:
$2,024
Percentage of individuals using paid preparers for their 2004 taxes: 52.9%
Here:
53%
State:
57%
(% for various income ranges: 69.8% for AGIs $10k-25k, 52.5% for AGIs $25k-50k, 46.6% for AGIs $50k-75k, 48.4% for AGIs $75k-100k, 69.8% for AGIs over 100k)
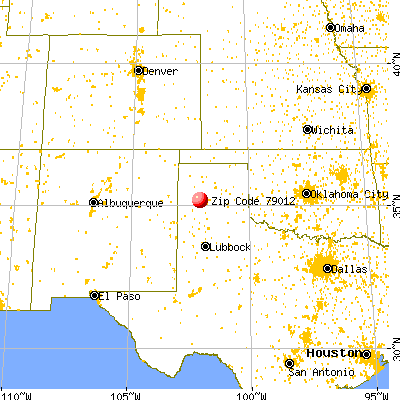
Notable locations in zip code 79012: Fryingpan Ranch (A), Storage Tank Windmill (B), Wooden Tower Windmill (C), Word Ranch (D), Blue Hole (E), Potter County Fire Rescue Station 1 (F), Bushland Volunteer Fire Department (G). Display/hide their locations on the map
Size of family households: 161 2-persons, 87 3-persons, 59 4-persons, 109 5-persons
Size of nonfamily households: 105 1-person
344 married couples with children.
127 single-parent households (127 women).
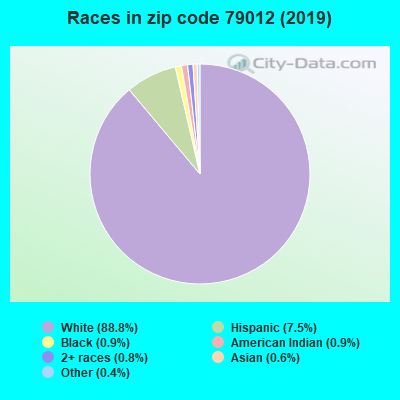
97.6% of residents of 79012 zip code speak English at home.
1.1% of residents speak Spanish at home (100% very well).
Foreign born population: 24 (1.7%) (100.0% of them are naturalized citizens)
This zip code:
1.7%
Whole state:
17.1%
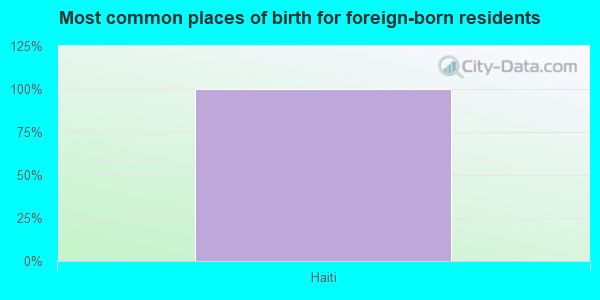
100%Haiti
30%German
19%American
10%Irish
2%French
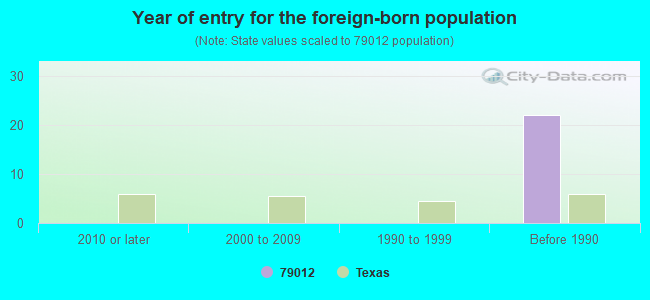
Year of entry for the foreign-born population
02010 or later
02000 to 2009
01990 to 1999
22Before 1990
Housing units lacking complete plumbing facilities: 6.1% Housing units lacking complete kitchen facilities: 5.9%
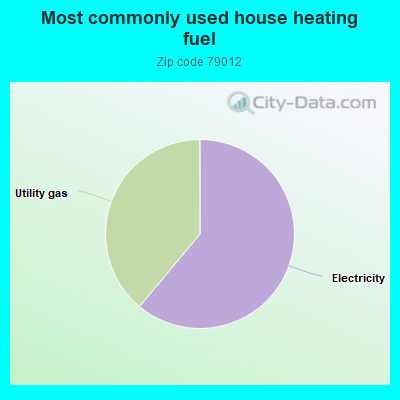
61.2%Electricity
39.0%Utility gas
Place of birth for U.S.-born residents:
This state: 933
Northeast: 39
Midwest: 141
South: 226
West: 75
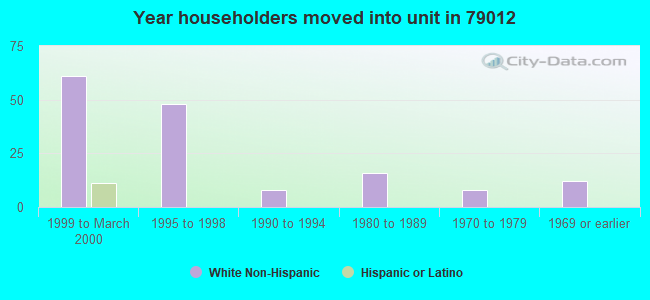
33% of the 79012 zip code residents lived in the same house 5 years ago. Out of people who lived in different houses, 37% lived in this county. Out of people who lived in different counties, 50% lived in Texas.
94% of the 79012 zip code residents lived in the same house 1 year ago. Out of people who lived in different houses, 26% moved from different county within same state. Out of people who lived in different houses, 78% moved from different state.
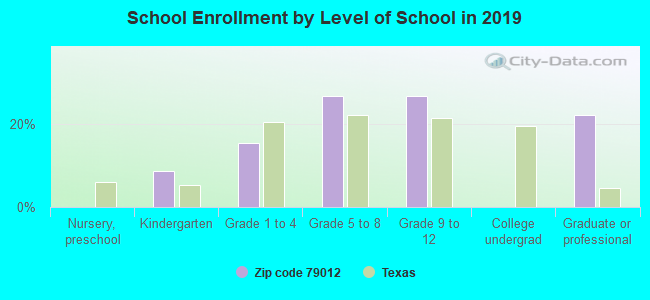
Private vs. public school enrollment:
Students in private schools in grades 1 to 8 (elementary and middle school):
Here:
0.0%
Texas:
7.0%
Students in private schools in grades 9 to 12 (high school):
Here:
0.0%
Texas:
6.6%
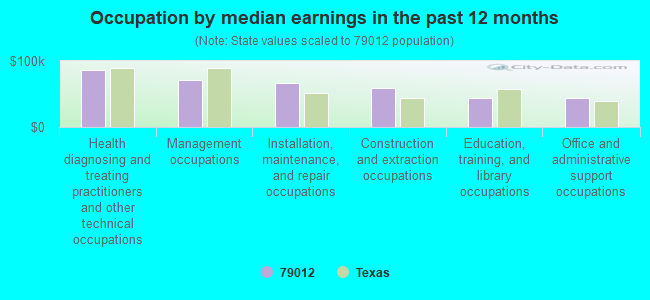
Occupation by median earnings in the past 12 months ($)
86,484Health diagnosing and treating practitioners and other technical occupations
71,672Management occupations
66,476Installation, maintenance, and repair occupations
59,392Construction and extraction occupations
44,594Education, training, and library occupations
43,631Office and administrative support occupations
Top industries in this zip code by the number of employees in 2005:
Wholesale Trade: Grain and Field Bean Merchant Wholesalers (10-19 employees: 1 establishment)
Construction: New Single-Family Housing Construction (except Operative Builders) (1-4: 2)
Construction: Manufacturing (1-4: 1)
Utilities: Water Supply and Irrigation Systems (1-4: 1)
Wholesale Trade: Metal Service Centers and Other Metal Merchant Wholesalers (1-4: 1)
Fatal accident statistics in 2014:
Fatal accident count: 1
Vehicles involved in fatal accidents: 2
Fatal accidents caused by drunken drivers: 0
Fatalities: 1
Persons involved in fatal accidents: 2
Pedestrians involved in fatal accidents: 0
Fatal accident statistics in 2013:
Fatal accident count: 2
Vehicles involved in fatal accidents: 3
Fatal accidents caused by drunken drivers: 0
Fatalities: 2
Persons involved in fatal accidents: 4
Pedestrians involved in fatal accidents: 0
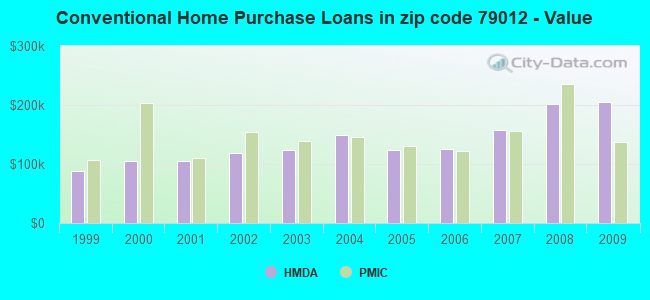
Home Mortgage Disclosure Act Aggregated Statistics For Year 2009 (Based on 2 partial tracts)
A) FHA, FSA/RHS & VA Home Purchase Loans
B) Conventional Home Purchase Loans
C) Refinancings
D) Home Improvement Loans
F) Non-occupant Loans on < 5 Family Dwellings (A B C & D)
G) Loans On Manufactured Home Dwelling (A B C & D)
Number
Average Value
Number
Average Value
Number
Average Value
Number
Average Value
Number
Average Value
Number
Average Value
LOANS ORIGINATED
4
$155,955
7
$204,370
19
$155,664
1
$87,470
1
$64,560
2
$71,050
APPLICATIONS APPROVED, NOT ACCEPTED
1
$53,830
3
$146,157
5
$147,320
0
$0
0
$0
0
$0
APPLICATIONS DENIED
1
$83,620
1
$151,390
4
$155,995
0
$0
0
$0
1
$101,090
APPLICATIONS WITHDRAWN
1
$67,600
0
$0
3
$165,647
0
$0
0
$0
0
$0
FILES CLOSED FOR INCOMPLETENESS
0
$0
0
$0
1
$159,720
0
$0
0
$0
0
$0
Aggregated Statistics For Year 2008 (Based on 2 partial tracts)
A) FHA, FSA/RHS & VA Home Purchase Loans
B) Conventional Home Purchase Loans
C) Refinancings
D) Home Improvement Loans
F) Non-occupant Loans on < 5 Family Dwellings (A B C & D)
G) Loans On Manufactured Home Dwelling (A B C & D)
Number
Average Value
Number
Average Value
Number
Average Value
Number
Average Value
Number
Average Value
Number
Average Value
LOANS ORIGINATED
4
$160,400
9
$201,549
9
$156,996
2
$37,165
1
$258,080
2
$95,000
APPLICATIONS APPROVED, NOT ACCEPTED
1
$94,840
3
$159,880
2
$154,355
1
$72,570
0
$0
1
$52,070
APPLICATIONS DENIED
1
$152,830
3
$158,543
3
$174,457
1
$21,790
0
$0
1
$77,540
APPLICATIONS WITHDRAWN
1
$80,420
1
$255,520
2
$154,355
0
$0
0
$0
0
$0
FILES CLOSED FOR INCOMPLETENESS
0
$0
0
$0
0
$0
0
$0
0
$0
0
$0
Aggregated Statistics For Year 2007 (Based on 2 partial tracts)
A) FHA, FSA/RHS & VA Home Purchase Loans
B) Conventional Home Purchase Loans
C) Refinancings
D) Home Improvement Loans
F) Non-occupant Loans on < 5 Family Dwellings (A B C & D)
G) Loans On Manufactured Home Dwelling (A B C & D)
Number
Average Value
Number
Average Value
Number
Average Value
Number
Average Value
Number
Average Value
Number
Average Value
LOANS ORIGINATED
2
$145,860
16
$158,058
9
$170,274
3
$41,813
2
$168,290
3
$88,910
APPLICATIONS APPROVED, NOT ACCEPTED
0
$0
3
$128,907
2
$130,405
0
$0
0
$0
1
$53,830
APPLICATIONS DENIED
1
$91,630
1
$95,320
4
$146,503
2
$44,215
0
$0
2
$51,825
APPLICATIONS WITHDRAWN
0
$0
1
$84,270
3
$132,860
0
$0
0
$0
0
$0
FILES CLOSED FOR INCOMPLETENESS
0
$0
0
$0
1
$169,810
0
$0
0
$0
0
$0
Aggregated Statistics For Year 2006 (Based on 2 partial tracts)
A) FHA, FSA/RHS & VA Home Purchase Loans
B) Conventional Home Purchase Loans
C) Refinancings
D) Home Improvement Loans
F) Non-occupant Loans on < 5 Family Dwellings (A B C & D)
G) Loans On Manufactured Home Dwelling (A B C & D)
Number
Average Value
Number
Average Value
Number
Average Value
Number
Average Value
Number
Average Value
Number
Average Value
LOANS ORIGINATED
3
$126,503
15
$125,522
8
$167,990
3
$33,697
1
$148,190
4
$65,243
APPLICATIONS APPROVED, NOT ACCEPTED
0
$0
5
$91,154
2
$90,595
0
$0
0
$0
3
$47,473
APPLICATIONS DENIED
0
$0
5
$94,678
6
$103,543
2
$20,585
0
$0
3
$64,827
APPLICATIONS WITHDRAWN
0
$0
2
$112,940
4
$162,563
0
$0
0
$0
0
$0
FILES CLOSED FOR INCOMPLETENESS
0
$0
0
$0
2
$126,240
0
$0
0
$0
0
$0
Aggregated Statistics For Year 2005 (Based on 2 partial tracts)
A) FHA, FSA/RHS & VA Home Purchase Loans
B) Conventional Home Purchase Loans
C) Refinancings
D) Home Improvement Loans
F) Non-occupant Loans on < 5 Family Dwellings (A B C & D)
G) Loans On Manufactured Home Dwelling (A B C & D)
Number
Average Value
Number
Average Value
Number
Average Value
Number
Average Value
Number
Average Value
Number
Average Value
LOANS ORIGINATED
2
$109,655
17
$123,561
10
$144,308
4
$24,070
1
$116,310
3
$73,210
APPLICATIONS APPROVED, NOT ACCEPTED
0
$0
3
$95,800
2
$209,620
1
$37,650
0
$0
1
$45,980
APPLICATIONS DENIED
0
$0
4
$112,900
7
$83,533
2
$24,190
0
$0
3
$42,507
APPLICATIONS WITHDRAWN
0
$0
2
$170,295
6
$124,983
0
$0
0
$0
0
$0
FILES CLOSED FOR INCOMPLETENESS
0
$0
0
$0
2
$128,160
0
$0
0
$0
0
$0
Aggregated Statistics For Year 2004 (Based on 2 partial tracts)
A) FHA, FSA/RHS & VA Home Purchase Loans
B) Conventional Home Purchase Loans
C) Refinancings
D) Home Improvement Loans
F) Non-occupant Loans on < 5 Family Dwellings (A B C & D)
G) Loans On Manufactured Home Dwelling (A B C & D)
Number
Average Value
Number
Average Value
Number
Average Value
Number
Average Value
Number
Average Value
Number
Average Value
LOANS ORIGINATED
4
$110,498
12
$149,507
16
$121,131
3
$30,597
1
$82,980
3
$84,800
APPLICATIONS APPROVED, NOT ACCEPTED
0
$0
3
$99,750
2
$169,730
0
$0
0
$0
1
$55,590
APPLICATIONS DENIED
0
$0
5
$80,548
9
$126,682
1
$70,330
1
$65,360
4
$51,023
APPLICATIONS WITHDRAWN
0
$0
1
$422,450
6
$87,870
0
$0
0
$0
1
$57,990
FILES CLOSED FOR INCOMPLETENESS
0
$0
0
$0
3
$72,570
0
$0
0
$0
0
$0
Aggregated Statistics For Year 2003 (Based on 2 partial tracts)
A) FHA, FSA/RHS & VA Home Purchase Loans
B) Conventional Home Purchase Loans
C) Refinancings
D) Home Improvement Loans
F) Non-occupant Loans on < 5 Family Dwellings (A B C & D)
Number
Average Value
Number
Average Value
Number
Average Value
Number
Average Value
Number
Average Value
LOANS ORIGINATED
3
$121,163
13
$123,120
26
$121,610
3
$17,730
1
$91,630
APPLICATIONS APPROVED, NOT ACCEPTED
0
$0
3
$97,563
3
$113,313
0
$0
0
$0
APPLICATIONS DENIED
0
$0
3
$79,620
10
$81,334
2
$34,925
0
$0
APPLICATIONS WITHDRAWN
0
$0
0
$0
6
$95,425
0
$0
0
$0
FILES CLOSED FOR INCOMPLETENESS
0
$0
1
$92,120
1
$105,250
0
$0
0
$0
Aggregated Statistics For Year 2002 (Based on 2 partial tracts)
A) FHA, FSA/RHS & VA Home Purchase Loans
B) Conventional Home Purchase Loans
C) Refinancings
D) Home Improvement Loans
F) Non-occupant Loans on < 5 Family Dwellings (A B C & D)
Number
Average Value
Number
Average Value
Number
Average Value
Number
Average Value
Number
Average Value
LOANS ORIGINATED
1
$111,340
12
$119,429
18
$122,206
2
$12,415
1
$78,980
APPLICATIONS APPROVED, NOT ACCEPTED
0
$0
3
$98,043
3
$107,707
0
$0
0
$0
APPLICATIONS DENIED
1
$59,430
3
$107,227
4
$109,095
1
$22,750
0
$0
APPLICATIONS WITHDRAWN
0
$0
1
$64,560
2
$128,480
0
$0
0
$0
FILES CLOSED FOR INCOMPLETENESS
0
$0
1
$105,890
1
$131,520
0
$0
0
$0
Aggregated Statistics For Year 2001 (Based on 2 partial tracts)
A) FHA, FSA/RHS & VA Home Purchase Loans
B) Conventional Home Purchase Loans
C) Refinancings
D) Home Improvement Loans
F) Non-occupant Loans on < 5 Family Dwellings (A B C & D)
Number
Average Value
Number
Average Value
Number
Average Value
Number
Average Value
Number
Average Value
LOANS ORIGINATED
2
$80,740
14
$105,904
20
$108,215
3
$26,967
2
$80,020
APPLICATIONS APPROVED, NOT ACCEPTED
0
$0
4
$90,993
4
$70,728
0
$0
0
$0
APPLICATIONS DENIED
0
$0
6
$52,225
8
$73,793
2
$13,295
0
$0
APPLICATIONS WITHDRAWN
0
$0
2
$104,050
4
$90,673
0
$0
0
$0
FILES CLOSED FOR INCOMPLETENESS
0
$0
0
$0
2
$67,605
0
$0
0
$0
Aggregated Statistics For Year 2000 (Based on 2 partial tracts)
A) FHA, FSA/RHS & VA Home Purchase Loans
B) Conventional Home Purchase Loans
C) Refinancings
D) Home Improvement Loans
F) Non-occupant Loans on < 5 Family Dwellings (A B C & D)
Number
Average Value
Number
Average Value
Number
Average Value
Number
Average Value
Number
Average Value
LOANS ORIGINATED
1
$78,020
15
$105,924
6
$94,252
2
$11,535
1
$107,490
APPLICATIONS APPROVED, NOT ACCEPTED
0
$0
5
$115,856
2
$48,060
1
$23,710
0
$0
APPLICATIONS DENIED
0
$0
7
$61,289
4
$92,915
1
$15,700
0
$0
APPLICATIONS WITHDRAWN
0
$0
0
$0
1
$109,420
0
$0
0
$0
FILES CLOSED FOR INCOMPLETENESS
0
$0
1
$86,030
1
$45,980
0
$0
0
$0
Aggregated Statistics For Year 1999 (Based on 1 partial tract)


 Nearest zip codes: 79098, 79124, 79010, 79119, 79121, 79106.