Estimated zip code population in 2022: 2,439 Zip code population in 2010: 2,038 Zip code population in 2000: 1,559
Houses and condos: 1,218 Renter-occupied apartments: 67
% of renters here:
7%
State:
38%
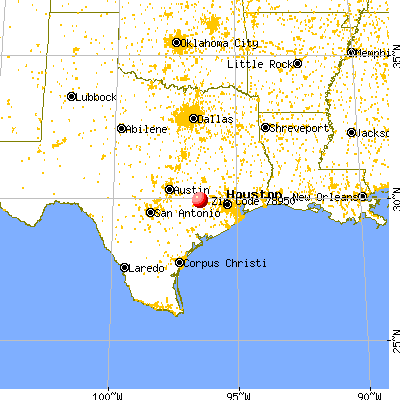
March 2022 cost of living index in zip code 78950: 77.2 (low, U.S. average is 100)
Land area: 110.3 sq. mi. Water area: 0.9 sq. mi.
Population density: 22 people per square mile
(very low).
OSM Map
General Map
Google Map
MSN Map
OSM Map
General Map
Google Map
MSN Map
OSM Map
General Map
Google Map
MSN Map
OSM Map
General Map
Google Map
MSN Map
Please wait while loading the map...
Real estate property taxes paid for housing units in 2022:
This zip code:
1.2% ($3,204)
Texas:
1.5% ($4,050)
Median real estate property taxes paid for housing units with mortgages in 2022: $4,228 (1.5%) Median real estate property taxes paid for housing units with no mortgage in 2022: $2,827 (1.1%)
Estimated median house/condo value in 2022: $269,383
78950:
$269,383
Texas:
$275,400
According to our research of Texas and other state lists, there were 6 registered sex offenders living in 78950 zip code as of May 24, 2024. The ratio of all residents to sex offenders in zip code 78950 is 438 to 1. The ratio of registered sex offenders to all residents in this zip code is near the state average.
Median resident age:
This zip code:
47.2 years
Texas median age:
35.6 years
Average household size:
This zip code:
2.6 people
Texas:
2.6 people
Averages for the 2020 tax year for zip code 78950, filed in 2021:
Average Adjusted Gross Income (AGI) in 2020: $97,699 (Individual Income Tax Returns)
Here:
$97,699
State:
$77,054
Salary/wage: $67,880 (reported on 69.7% of returns)
Here:
$67,880
State:
$62,766
(% of AGI for various income ranges: 1194.7% for AGIs below $25k, 3993.3% for AGIs $25k-50k, 5927.8% for AGIs $50k-75k, 9181.7% for AGIs $75k-100k, 16292.0% for AGIs $100k-200k)
Taxable interest for individuals: $3,538 (reported on 52.5% of returns)
This zip code:
$3,538
Texas:
$2,665
(% of AGI for various income ranges: 85.3% for AGIs below $25k, 96.7% for AGIs $25k-50k, 206.7% for AGIs $50k-75k, 96.7% for AGIs $75k-100k, 668.0% for AGIs $100k-200k)
Ordinary dividends: $17,438 (reported on 34.3% of returns)
Here:
$17,438
State:
$10,044
(% of AGI for various income ranges: 130.0% for AGIs below $25k, 172.5% for AGIs $25k-50k, 296.7% for AGIs $50k-75k, 203.3% for AGIs $75k-100k, 1135.0% for AGIs $100k-200k)
Net capital gain/loss in AGI: +$33,078 (reported on 27.3% of returns)
Here:
+$33,078
State:
+$39,590
(% of AGI for various income ranges: 37.3% for AGIs below $25k, 29.2% for AGIs $25k-50k, 290.0% for AGIs $50k-75k, 170.0% for AGIs $75k-100k, 463.0% for AGIs $100k-200k)
Profit/loss from business: +$18,816 (reported on 25.3% of returns)
Here:
+$18,816
State:
+$10,888
(% of AGI for various income ranges: 310.0% for AGIs below $25k, 175.0% for AGIs $25k-50k, 553.3% for AGIs $50k-75k, 508.3% for AGIs $75k-100k, 1070.0% for AGIs $100k-200k)
Taxable individual retirement arrangement distribution: $28,824 (reported on 17.2% of returns)
78950:
$28,824
Texas:
$24,740
(% of AGI for various income ranges: 257.3% for AGIs below $25k, 238.3% for AGIs $25k-50k, 780.0% for AGIs $50k-75k, 1755.0% for AGIs $100k-200k)
Total itemized deductions: $41,462 (reported on 8.1% of returns)
Here:
$41,462
State:
$40,428
(% of AGI for various income ranges: 532.0% for AGIs below $25k, 1401.7% for AGIs $75k-100k)
Charity contributions: $18,350 (reported on 6.1% of returns)
Here:
$18,350
State:
$18,201
(% of AGI for various income ranges: 351.7% for AGIs $75k-100k)
Taxes paid: $7,000 (reported on 8.1% of returns)
78950:
$7,000
State:
$7,821
(% of AGI for various income ranges: 86.0% for AGIs below $25k, 271.7% for AGIs $75k-100k)
Earned income credit: $2,127 (reported on 11.1% of returns)
Here:
$2,127
State:
$2,584
(% of AGI for various income ranges: 84.7% for AGIs below $25k, 89.2% for AGIs $25k-50k)
Percentage of individuals using paid preparers for their 2020 taxes: 90.9%
Here:
91%
State:
92%
(% for various income ranges: 89.7% for AGIs below $25k, 94.4% for AGIs $25k-50k, 92.9% for AGIs $50k-75k, 90.0% for AGIs $75k-100k, 89.5% for AGIs $100k-200k, 88.9% for AGIs over 200k)
Averages for the 2012 tax year for zip code 78950, filed in 2013:
Average Adjusted Gross Income (AGI) in 2012: $89,455 (Individual Income Tax Returns)
Here:
$89,455
State:
$65,384
Salary/wage: $61,798 (reported on 71.6% of returns)
Here:
$61,798
State:
$52,524
(% of AGI for various income ranges: 61.5% for AGIs below $25k, 70.8% for AGIs $25k-50k, 72.9% for AGIs $50k-75k, 65.4% for AGIs $75k-100k, 63.9% for AGIs $100k-200k, 28.8% for AGIs over 200k)
Taxable interest for individuals: $2,450 (reported on 56.8% of returns)
This zip code:
$2,450
Texas:
$2,372
(% of AGI for various income ranges: 4.9% for AGIs below $25k, 2.1% for AGIs $25k-50k, 1.0% for AGIs $50k-75k, 1.0% for AGIs $75k-100k, 2.3% for AGIs $100k-200k, 1.0% for AGIs over 200k)
Ordinary dividends: $6,832 (reported on 31.8% of returns)
Here:
$6,832
State:
$9,721
(% of AGI for various income ranges: 5.1% for AGIs below $25k, 1.0% for AGIs $25k-50k, 3.0% for AGIs $50k-75k, 2.2% for AGIs $75k-100k, 3.6% for AGIs $100k-200k, 1.7% for AGIs over 200k)
Net capital gain/loss in AGI: +$12,036 (reported on 25.0% of returns)
Here:
+$12,036
State:
+$35,319
(% of AGI for various income ranges: 1.3% for AGIs $75k-100k, 4.7% for AGIs $100k-200k, 4.8% for AGIs over 200k)
Profit/loss from business: +$21,008 (reported on 27.3% of returns)
Here:
+$21,008
State:
+$13,732
(% of AGI for various income ranges: 9.4% for AGIs below $25k, 11.3% for AGIs $25k-50k, 7.5% for AGIs $50k-75k, 9.0% for AGIs $100k-200k, 4.9% for AGIs over 200k)
Taxable individual retirement arrangement distribution: $19,893 (reported on 17.0% of returns)
78950:
$19,893
Texas:
$19,511
(% of AGI for various income ranges: 8.3% for AGIs below $25k, 2.5% for AGIs $25k-50k, 11.4% for AGIs $50k-75k, 9.1% for AGIs $100k-200k)
Total itemized deductions: $27,045 (13% of AGI, reported on 25.0% of returns)
Here:
$27,045
State:
$24,724
Here:
12.8% of AGI
State:
15.9% of AGI
(% of AGI for various income ranges: 18.0% for AGIs below $25k, 7.1% for AGIs $25k-50k, 7.0% for AGIs $50k-75k, 9.7% for AGIs $75k-100k, 8.6% for AGIs $100k-200k, 5.8% for AGIs over 200k)
Charity contributions: $7,100 (reported on 19.3% of returns)
Here:
$7,100
State:
$6,808
(% of AGI for various income ranges: 2.6% for AGIs below $25k, 1.0% for AGIs $50k-75k, 0.9% for AGIs $75k-100k, 1.8% for AGIs $100k-200k, 1.8% for AGIs over 200k)
Taxes paid: $6,914 (reported on 25.0% of returns)
78950:
$6,914
State:
$6,921
(% of AGI for various income ranges: 3.0% for AGIs below $25k, 1.6% for AGIs $25k-50k, 2.1% for AGIs $50k-75k, 2.7% for AGIs $75k-100k, 2.3% for AGIs $100k-200k, 1.5% for AGIs over 200k)
Earned income credit: $2,256 (reported on 10.2% of returns)
Here:
$2,256
State:
$2,570
(% of AGI for various income ranges: 4.1% for AGIs below $25k, 0.9% for AGIs $25k-50k)
Percentage of individuals using paid preparers for their 2012 taxes: 67.0%
Here:
67%
State:
51%
(% for various income ranges: 64.5% for AGIs below $25k, 64.7% for AGIs $25k-50k, 66.7% for AGIs $50k-75k, 75.0% for AGIs $75k-100k, 71.4% for AGIs $100k-200k, 66.7% for AGIs over 200k)
Averages for the 2004 tax year for zip code 78950, filed in 2005:
Average Adjusted Gross Income (AGI) in 2004: $53,790 (Individual Income Tax Returns)
Here:
$53,790
State:
$47,881
Salary/wage: $41,970 (reported on 75.9% of returns)
Here:
$41,970
State:
$41,947
(% of AGI for various income ranges: 82.6% for AGIs below $10k, 62.8% for AGIs $10k-25k, 74.1% for AGIs $25k-50k, 76.5% for AGIs $50k-75k, 75.6% for AGIs $75k-100k, 42.0% for AGIs over 100k)
Taxable interest for individuals: $2,511 (reported on 61.6% of returns)
This zip code:
$2,511
Texas:
$2,255
(% of AGI for various income ranges: 16.0% for AGIs below $10k, 7.9% for AGIs $10k-25k, 2.6% for AGIs $25k-50k, 1.2% for AGIs $50k-75k, 0.9% for AGIs $75k-100k, 2.8% for AGIs over 100k)
Taxable dividends: $4,202 (reported on 31.5% of returns)
Here:
$4,202
State:
$4,261
(% of AGI for various income ranges: 3.2% for AGIs below $10k, 4.2% for AGIs $10k-25k, 1.5% for AGIs $25k-50k, 1.8% for AGIs $50k-75k, 1.1% for AGIs $75k-100k, 3.1% for AGIs over 100k)
Net capital gain/loss: +$7,123 (reported on 26.7% of returns)
Here:
+$7,123
State:
+$16,110
(% of AGI for various income ranges: -3.3% for AGIs below $10k, -1.3% for AGIs $10k-25k, 2.1% for AGIs $25k-50k, 0.6% for AGIs $50k-75k, -0.1% for AGIs $75k-100k, 7.1% for AGIs over 100k)
Profit/loss from business: +$14,954 (reported on 24.9% of returns)
Here:
+$14,954
State:
+$11,013
(% of AGI for various income ranges: 9.7% for AGIs below $10k, 6.3% for AGIs $10k-25k, 6.6% for AGIs $25k-50k, 8.9% for AGIs $50k-75k, 4.9% for AGIs $75k-100k, 6.9% for AGIs over 100k)
IRA payment deduction: $3,419 (reported on 4.9% of returns)
78950:
$3,419
Texas:
$3,120
Total itemized deductions: $17,314 (20% of AGI, reported on 21.4% of returns)
Here:
$17,314
State:
$19,631
Here:
20.4% of AGI
State:
18.9% of AGI
(% of AGI for various income ranges: 10.9% for AGIs $10k-25k, 5.9% for AGIs $25k-50k, 7.9% for AGIs $50k-75k, 10.5% for AGIs $75k-100k, 5.4% for AGIs over 100k)
Charity contributions deductions: $3,764 (4% of AGI, reported on 16.8% of returns)
Here:
$3,764
State:
$4,753
Here:
4.2% of AGI
State:
4.2% of AGI
(% of AGI for various income ranges: 0.7% for AGIs $10k-25k, 1.2% for AGIs $25k-50k, 1.1% for AGIs $50k-75k, 1.8% for AGIs $75k-100k, 1.1% for AGIs over 100k)
Total tax: $9,107 (reported on 76.5% of returns)
78950:
$9,107
State:
$9,058
(% of AGI for various income ranges: 4.4% for AGIs below $10k, 4.2% for AGIs $10k-25k, 7.3% for AGIs $25k-50k, 9.1% for AGIs $50k-75k, 11.3% for AGIs $75k-100k, 18.4% for AGIs over 100k)
Earned income credit: $1,854 (reported on 9.3% of returns)
Here:
$1,854
State:
$2,024
Percentage of individuals using paid preparers for their 2004 taxes: 64.8%
Here:
65%
State:
57%
(% for various income ranges: 62.5% for AGIs below $10k, 59.1% for AGIs $10k-25k, 63.6% for AGIs $25k-50k, 73.8% for AGIs $50k-75k, 63.0% for AGIs $75k-100k, 74.2% for AGIs over 100k)
Household received Food Stamps/SNAP in the past 12 months: 104 Household did not receive Food Stamps/SNAP in the past 12 months: 834
Women who had a birth in the past 12 months: 18 (18 now married, 0 unmarried) Women who did not have a birth in the past 12 months: 359 (139 now married, 220 unmarried)
Housing units in zip code 78950 with a mortgage: 340 (5 second mortgage, 6 both second mortgage and home equity loan) Median monthly owner costs for units with a mortgage: $2,188 Median monthly owner costs for units without a mortgage: $650
Residents with income below the poverty level in 2022:
This zip code:
2.7%
Whole state:
14.0%
Residents with income below 50% of the poverty level in 2022:
This zip code:
2.7%
Whole state:
7.4%
Median number of rooms in houses and condos:
Here:
6.2
State:
6.3
Median number of rooms in apartments:
Here:
5.6
State:
4.0
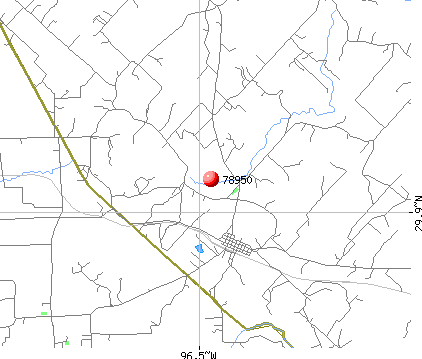
Notable locations in this zip code not listed on our city pages
Notable locations in zip code 78950: Gulf (A), Post Oak Point (B), Rock House (C), Frelsburg Volunteer Fire Department (D), New Ulm Volunteer Fire Department (E). Display/hide their locations on the map
Cemeteries: Star Hill Cemetery (1), Knolle Cemetery (2), Hoppe Cemetery (3), Heitman Cemetery (4), Shellburne Cemetery (5), Nelsonville Cemetery (6), New Ulm Cemetery (7). Display/hide their locations on the map
Streams, rivers, and creeks: Black Walnut Creek (A), Black Branch (B), Skull Creek (C), Sandy Creek (D), Pecan Branch (E), Long Branch (F), Hobson Branch (G), Bee Branch (H), Post Oak Point Creek (I). Display/hide their locations on the map
In group quarters: 21 (-1 institutionalized population)
Size of family households: 391 2-persons, 142 3-persons, 31 4-persons, 102 5-persons, 2 6-persons
Size of nonfamily households: 256 1-person, 16 2-persons
516 married couples with children.
17 single-parent households (10 men, 7 women).
90.9% of residents of 78950 zip code speak English at home.
6.0% of residents speak Spanish at home (91% very well, 7% well, 1% not well, 1% not at all).
3.3% of residents speak other Indo-European language at home (100% very well).
Foreign born population: 70 (2.9%) (45.3% of them are naturalized citizens)
This zip code:
2.9%
Whole state:
17.2%
77%Honduras
17%Germany
1%El Salvador
29%German
15%English
7%American
4%Irish
2%Danish
2%Czech
1%Dutch
Year of entry for the foreign-born population
32010 or later
92000 to 2009
01990 to 1999
64Before 1990
Public high school in in zip code 78950 not listed on the city page:
COLUMBUS ALTERNATIVE SCHOOL NEW ULM CAMPUS (Location: 7674 PECHACEK RD, Grades: 3-12)
Facilities with environmental interests located in this zip code:
AMP METALS AND PAPER (1195 CUMMINS CREEK RD in NEW ULM, TX)
TRANSPORTER (Resource Conservation and Recovery Act (tracking hazardous waste))
Housing units lacking complete plumbing facilities: 1.1%
50.5%Electricity
47.8%Bottled, tank, or LP gas
1.2%Solar energy
Population in 1990: 689. Population change in the 1990s: +870 (+126.3%).
Place of birth for U.S.-born residents:
This state: 2,030
Northeast: 98
Midwest: 81
South: 47
West: 75
76% of the 78950 zip code residents lived in the same house 5 years ago. Out of people who lived in different houses, 43% lived in this county. Out of people who lived in different counties, 50% lived in Texas.
99% of the 78950 zip code residents lived in the same house 1 year ago. Out of people who lived in different houses, 64% moved from this county. Out of people who lived in different houses, 50% moved from different county within same state.
Private vs. public school enrollment:
Students in private schools in grades 1 to 8 (elementary and middle school):
Here:
0.0%
Texas:
8.8%
Students in private schools in grades 9 to 12 (high school): 25
Here:
16.0%
Texas:
8.0%
Students in private undergraduate colleges: 11
Here:
48.2%
Texas:
16.2%
Occupation by median earnings in the past 12 months ($)
73,836Management occupations
71,926Installation, maintenance, and repair occupations
60,542Business and financial operations occupations
58,999Construction and extraction occupations
57,197Production occupations
52,930Education, training, and library occupations
Top industries in this zip code by the number of employees in 2005:


 Nearest zip codes: 78931, 78944, 78933, 78940, 78935, 78934.


 (Location: 7674 PECHACEK RD, Grades: 3-12)