Estimated zip code population in 2022: 25,621 Zip code population in 2010: 12,081 Zip code population in 2000: 7,100
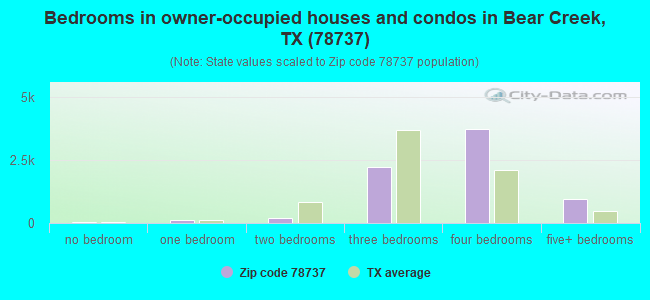
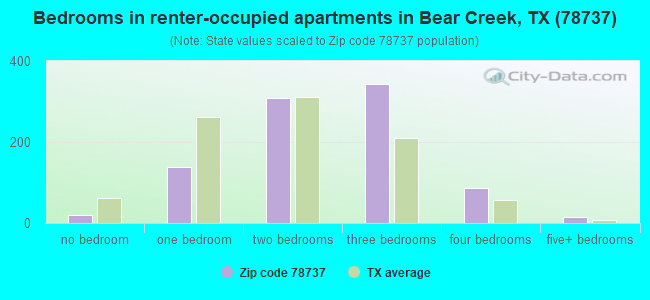
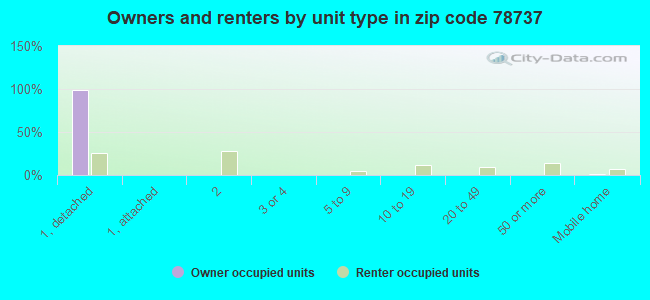
Houses and condos: 8,322 Renter-occupied apartments: 919
% of renters here:
11%
State:
38%
March 2022 cost of living index in zip code 78737: 85.1 (less than average, U.S. average is 100)
Land area: 38.2 sq. mi. Water area: 0.0 sq. mi.
Population density: 671 people per square mile
(low).
OSM Map
General Map
Google Map
MSN Map
OSM Map
General Map
Google Map
MSN Map
OSM Map
General Map
Google Map
MSN Map
OSM Map
General Map
Google Map
MSN Map
Please wait while loading the map...
Real estate property taxes paid for housing units in 2022:
This zip code:
1.4% ($10,460)
Texas:
1.5% ($4,050)
Median real estate property taxes paid for housing units with mortgages in 2022: $10,505 (1.4%) Median real estate property taxes paid for housing units with no mortgage in 2022: $9,099 (1.3%)
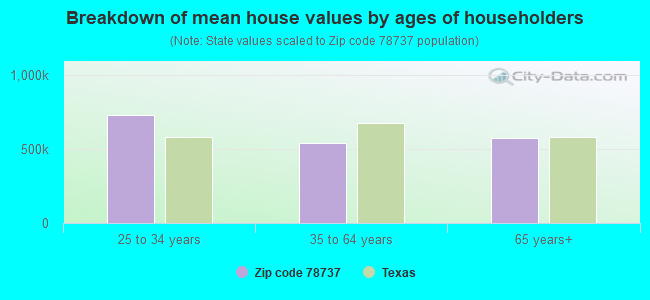
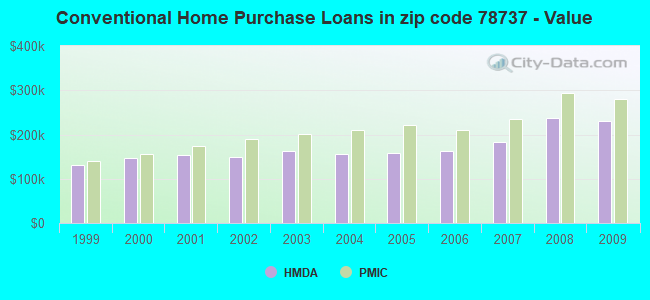
Estimated median house/condo value in 2022: $727,611
78737:
$727,611
Texas:
$275,400
According to our research of Texas and other state lists, there were 7 registered sex offenders living in 78737 zip code as of May 04, 2024. The ratio of all residents to sex offenders in zip code 78737 is 2,135 to 1. The ratio of registered sex offenders to all residents in this zip code is much lower than the state average.
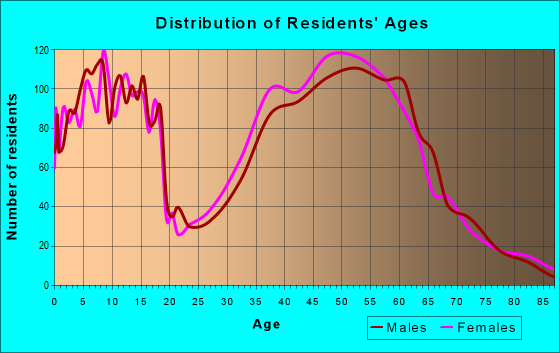
Median resident age:
This zip code:
37.3 years
Texas median age:
35.6 years
Average household size:
This zip code:
3.1 people
Texas:
2.6 people
Averages for the 2020 tax year for zip code 78737, filed in 2021:
Average Adjusted Gross Income (AGI) in 2020: $183,286 (Individual Income Tax Returns)
Here:
$183,286
State:
$77,054
Salary/wage: $143,493 (reported on 79.3% of returns)
Here:
$143,493
State:
$62,766
(% of AGI for various income ranges: 1107.4% for AGIs below $25k, 3603.3% for AGIs $25k-50k, 6132.3% for AGIs $50k-75k, 8846.8% for AGIs $75k-100k, 19718.6% for AGIs $100k-200k, 81448.7% for AGIs over 200k)
Taxable interest for individuals: $2,065 (reported on 52.4% of returns)
This zip code:
$2,065
Texas:
$2,665
(% of AGI for various income ranges: 31.3% for AGIs below $25k, 78.3% for AGIs $25k-50k, 125.4% for AGIs $50k-75k, 231.5% for AGIs $75k-100k, 208.4% for AGIs $100k-200k, 582.6% for AGIs over 200k)
Ordinary dividends: $8,180 (reported on 43.1% of returns)
Here:
$8,180
State:
$10,044
(% of AGI for various income ranges: 84.4% for AGIs below $25k, 168.1% for AGIs $25k-50k, 301.7% for AGIs $50k-75k, 450.2% for AGIs $75k-100k, 614.9% for AGIs $100k-200k, 2272.0% for AGIs over 200k)
Net capital gain/loss in AGI: +$62,226 (reported on 42.3% of returns)
Here:
+$62,226
State:
+$39,590
(% of AGI for various income ranges: 16.4% for AGIs below $25k, 105.9% for AGIs $25k-50k, 320.4% for AGIs $50k-75k, 344.9% for AGIs $75k-100k, 793.6% for AGIs $100k-200k, 26553.3% for AGIs over 200k)
Profit/loss from business: +$27,231 (reported on 24.1% of returns)
Here:
+$27,231
State:
+$10,888
(% of AGI for various income ranges: 158.5% for AGIs below $25k, 248.9% for AGIs $25k-50k, 556.7% for AGIs $50k-75k, 753.7% for AGIs $75k-100k, 1240.2% for AGIs $100k-200k, 4177.7% for AGIs over 200k)
Taxable individual retirement arrangement distribution: $30,619 (reported on 12.6% of returns)
78737:
$30,619
Texas:
$24,740
(% of AGI for various income ranges: 86.2% for AGIs below $25k, 228.1% for AGIs $25k-50k, 497.3% for AGIs $50k-75k, 932.2% for AGIs $75k-100k, 1000.1% for AGIs $100k-200k, 1699.9% for AGIs over 200k)
Self-employed (Keogh) retirement plans: $24,062 (reported on 2.1% of returns)
78737:
$24,062
Texas:
$29,298
(% of AGI for various income ranges: 80.2% for AGIs $100k-200k, 432.4% for AGIs over 200k)
Total itemized deductions: $36,710 (reported on 25.0% of returns)
Here:
$36,710
State:
$40,428
(% of AGI for various income ranges: 153.7% for AGIs below $25k, 368.3% for AGIs $25k-50k, 905.6% for AGIs $50k-75k, 1141.0% for AGIs $75k-100k, 1756.3% for AGIs $100k-200k, 5781.2% for AGIs over 200k)
Charity contributions: $12,255 (reported on 20.5% of returns)
Here:
$12,255
State:
$18,201
(% of AGI for various income ranges: 7.2% for AGIs below $25k, 43.2% for AGIs $25k-50k, 136.2% for AGIs $50k-75k, 176.1% for AGIs $75k-100k, 316.4% for AGIs $100k-200k, 2036.1% for AGIs over 200k)
Taxes paid: $9,155 (reported on 25.0% of returns)
78737:
$9,155
State:
$7,821
(% of AGI for various income ranges: 29.7% for AGIs below $25k, 92.3% for AGIs $25k-50k, 228.5% for AGIs $50k-75k, 326.8% for AGIs $75k-100k, 512.0% for AGIs $100k-200k, 1324.5% for AGIs over 200k)
Earned income credit: $1,652 (reported on 4.1% of returns)
Here:
$1,652
State:
$2,584
(% of AGI for various income ranges: 31.9% for AGIs below $25k, 38.4% for AGIs $25k-50k)
Percentage of individuals using paid preparers for their 2020 taxes: 92.0%
Here:
92%
State:
92%
(% for various income ranges: 90.8% for AGIs below $25k, 90.7% for AGIs $25k-50k, 90.1% for AGIs $50k-75k, 89.2% for AGIs $75k-100k, 92.3% for AGIs $100k-200k, 94.2% for AGIs over 200k)
Averages for the 2012 tax year for zip code 78737, filed in 2013:
Average Adjusted Gross Income (AGI) in 2012: $126,383 (Individual Income Tax Returns)
Here:
$126,383
State:
$65,384
Salary/wage: $95,384 (reported on 81.8% of returns)
Here:
$95,384
State:
$52,524
(% of AGI for various income ranges: 70.4% for AGIs below $25k, 67.4% for AGIs $25k-50k, 66.0% for AGIs $50k-75k, 68.3% for AGIs $75k-100k, 75.3% for AGIs $100k-200k, 50.1% for AGIs over 200k)
Taxable interest for individuals: $1,844 (reported on 52.8% of returns)
This zip code:
$1,844
Texas:
$2,372
(% of AGI for various income ranges: 1.8% for AGIs below $25k, 0.9% for AGIs $25k-50k, 1.1% for AGIs $50k-75k, 0.9% for AGIs $75k-100k, 0.7% for AGIs $100k-200k, 0.7% for AGIs over 200k)
Ordinary dividends: $5,960 (reported on 37.2% of returns)
Here:
$5,960
State:
$9,721
(% of AGI for various income ranges: 6.8% for AGIs below $25k, 3.3% for AGIs $25k-50k, 2.9% for AGIs $50k-75k, 1.6% for AGIs $75k-100k, 1.5% for AGIs $100k-200k, 1.5% for AGIs over 200k)
Net capital gain/loss in AGI: +$29,081 (reported on 34.8% of returns)
Here:
+$29,081
State:
+$35,319
(% of AGI for various income ranges: 0.5% for AGIs $25k-50k, 1.1% for AGIs $50k-75k, 0.8% for AGIs $75k-100k, 1.7% for AGIs $100k-200k, 15.2% for AGIs over 200k)
Profit/loss from business: +$24,275 (reported on 24.9% of returns)
Here:
+$24,275
State:
+$13,732
(% of AGI for various income ranges: 7.9% for AGIs below $25k, 7.1% for AGIs $25k-50k, 5.1% for AGIs $50k-75k, 6.9% for AGIs $75k-100k, 5.0% for AGIs $100k-200k, 4.0% for AGIs over 200k)
Taxable individual retirement arrangement distribution: $20,736 (reported on 11.8% of returns)
78737:
$20,736
Texas:
$19,511
(% of AGI for various income ranges: 4.2% for AGIs below $25k, 3.1% for AGIs $25k-50k, 4.0% for AGIs $50k-75k, 2.9% for AGIs $75k-100k, 2.8% for AGIs $100k-200k, 0.8% for AGIs over 200k)
Self-employment retirement plans: $20,458 (reported on 1.8% of returns)
78737:
$20,458
Texas:
$23,938
(% of AGI for various income ranges: 0.6% for AGIs $25k-50k, 0.2% for AGIs $100k-200k, 0.4% for AGIs over 200k)
Total itemized deductions: $27,116 (15% of AGI, reported on 56.5% of returns)
Here:
$27,116
State:
$24,724
Here:
14.6% of AGI
State:
15.9% of AGI
(% of AGI for various income ranges: 24.4% for AGIs below $25k, 17.4% for AGIs $25k-50k, 19.7% for AGIs $50k-75k, 17.0% for AGIs $75k-100k, 14.6% for AGIs $100k-200k, 7.8% for AGIs over 200k)
Charity contributions: $4,985 (reported on 46.9% of returns)
Here:
$4,985
State:
$6,808
(% of AGI for various income ranges: 1.3% for AGIs below $25k, 1.4% for AGIs $25k-50k, 1.9% for AGIs $50k-75k, 1.6% for AGIs $75k-100k, 2.0% for AGIs $100k-200k, 1.9% for AGIs over 200k)
Taxes paid: $9,838 (reported on 56.2% of returns)
78737:
$9,838
State:
$6,921
(% of AGI for various income ranges: 5.6% for AGIs below $25k, 5.3% for AGIs $25k-50k, 6.7% for AGIs $50k-75k, 6.2% for AGIs $75k-100k, 5.5% for AGIs $100k-200k, 2.9% for AGIs over 200k)
Earned income credit: $1,642 (reported on 6.2% of returns)
Here:
$1,642
State:
$2,570
(% of AGI for various income ranges: 3.2% for AGIs below $25k, 0.5% for AGIs $25k-50k)
Percentage of individuals using paid preparers for their 2012 taxes: 44.5%
Here:
44%
State:
51%
(% for various income ranges: 33.1% for AGIs below $25k, 42.7% for AGIs $25k-50k, 45.6% for AGIs $50k-75k, 45.2% for AGIs $75k-100k, 44.9% for AGIs $100k-200k, 65.0% for AGIs over 200k)
Averages for the 2004 tax year for zip code 78737, filed in 2005:
Average Adjusted Gross Income (AGI) in 2004: $83,803 (Individual Income Tax Returns)
Here:
$83,803
State:
$47,881
Salary/wage: $75,405 (reported on 81.4% of returns)
Here:
$75,405
State:
$41,947
(% of AGI for various income ranges: 200.9% for AGIs below $10k, 75.8% for AGIs $10k-25k, 70.0% for AGIs $25k-50k, 70.5% for AGIs $50k-75k, 74.5% for AGIs $75k-100k, 72.9% for AGIs over 100k)
Taxable interest for individuals: $1,829 (reported on 63.4% of returns)
This zip code:
$1,829
Texas:
$2,255
(% of AGI for various income ranges: 28.8% for AGIs below $10k, 2.8% for AGIs $10k-25k, 2.3% for AGIs $25k-50k, 1.3% for AGIs $50k-75k, 1.6% for AGIs $75k-100k, 1.0% for AGIs over 100k)
Taxable dividends: $2,932 (reported on 42.0% of returns)
Here:
$2,932
State:
$4,261
(% of AGI for various income ranges: 12.1% for AGIs below $10k, 2.1% for AGIs $10k-25k, 1.8% for AGIs $25k-50k, 1.1% for AGIs $50k-75k, 1.4% for AGIs $75k-100k, 1.4% for AGIs over 100k)
Net capital gain/loss: +$7,933 (reported on 39.1% of returns)
Here:
+$7,933
State:
+$16,110
(% of AGI for various income ranges: -10.4% for AGIs below $10k, -0.4% for AGIs $10k-25k, 0.5% for AGIs $25k-50k, 0.9% for AGIs $50k-75k, 1.5% for AGIs $75k-100k, 5.1% for AGIs over 100k)
Profit/loss from business: +$20,029 (reported on 26.0% of returns)
Here:
+$20,029
State:
+$11,013
(% of AGI for various income ranges: 7.1% for AGIs below $10k, 9.7% for AGIs $10k-25k, 8.7% for AGIs $25k-50k, 6.5% for AGIs $50k-75k, 6.2% for AGIs $75k-100k, 5.8% for AGIs over 100k)
IRA payment deduction: $3,581 (reported on 3.6% of returns)
78737:
$3,581
Texas:
$3,120
(% of AGI for various income ranges: 0.5% for AGIs $25k-50k, 0.4% for AGIs $50k-75k, 0.2% for AGIs $75k-100k, 0.1% for AGIs over 100k)
Self-employed pension: $15,584 (reported on 3.0% of returns)
Here:
$15,584
Texas:
$16,401
(% of AGI for various income ranges: 0.5% for AGIs $50k-75k, 0.3% for AGIs $75k-100k, 0.7% for AGIs over 100k)
Total itemized deductions: $22,921 (19% of AGI, reported on 54.4% of returns)
Here:
$22,921
State:
$19,631
Here:
18.9% of AGI
State:
18.9% of AGI
(% of AGI for various income ranges: 53.9% for AGIs below $10k, 16.8% for AGIs $10k-25k, 20.4% for AGIs $25k-50k, 20.0% for AGIs $50k-75k, 17.7% for AGIs $75k-100k, 12.8% for AGIs over 100k)
Charity contributions deductions: $4,023 (3% of AGI, reported on 47.5% of returns)
Here:
$4,023
State:
$4,753
Here:
3.2% of AGI
State:
4.2% of AGI
(% of AGI for various income ranges: 0.7% for AGIs below $10k, 1.5% for AGIs $10k-25k, 1.9% for AGIs $25k-50k, 2.4% for AGIs $50k-75k, 2.1% for AGIs $75k-100k, 2.4% for AGIs over 100k)
Total tax: $16,146 (reported on 83.8% of returns)
78737:
$16,146
State:
$9,058
(% of AGI for various income ranges: 6.3% for AGIs below $10k, 5.3% for AGIs $10k-25k, 7.7% for AGIs $25k-50k, 9.5% for AGIs $50k-75k, 10.8% for AGIs $75k-100k, 19.4% for AGIs over 100k)
Earned income credit: $1,286 (reported on 5.0% of returns)
Here:
$1,286
State:
$2,024
Percentage of individuals using paid preparers for their 2004 taxes: 45.4%
Here:
45%
State:
57%
(% for various income ranges: 36.1% for AGIs below $10k, 40.4% for AGIs $10k-25k, 44.7% for AGIs $25k-50k, 51.5% for AGIs $50k-75k, 44.7% for AGIs $75k-100k, 51.0% for AGIs over 100k)
Likely homosexual households (counted as self-reported same-sex unmarried-partner households)
Lesbian couples: 0.2% of all households
Gay men: 0.0% of all households
Household received Food Stamps/SNAP in the past 12 months: 88 Household did not receive Food Stamps/SNAP in the past 12 months: 8,037
Women who had a birth in the past 12 months: 171 (161 now married, 12 unmarried) Women who did not have a birth in the past 12 months: 4,728 (3,292 now married, 1,398 unmarried)
Housing units in zip code 78737 with a mortgage: 5,352 (285 second mortgage, 9 home equity loan, 220 both second mortgage and home equity loan) Houses without a mortgage: 111
Median monthly owner costs for units with a mortgage: $3,347 Median monthly owner costs for units without a mortgage: $1,131
Residents with income below the poverty level in 2022:
This zip code:
6.4%
Whole state:
14.0%
Residents with income below 50% of the poverty level in 2022:
This zip code:
3.4%
Whole state:
7.4%
Median number of rooms in houses and condos:
Here:
7.6
State:
6.3
Median number of rooms in apartments:
Here:
4.0
State:
4.0
Notable locations in this zip code not listed on our city pages
Notable locations in zip code 78737: Heissner Ranch (A), Koenig Ranch (B), Sawyer Ranch (C), Signal Hill Ranch (D), Driftwood Volunteer Fire Department (E). Display/hide their locations on the map
7,266 married couples with children.
1,315 single-parent households (810 men, 505 women).
88.1% of residents of 78737 zip code speak English at home.
6.1% of residents speak Spanish at home (86% very well, 12% well, 3% not well).
2.6% of residents speak other Indo-European language at home (76% very well, 17% well, 7% not well).
3.3% of residents speak Asian or Pacific Island language at home (86% very well, 1% well, 12% not well).
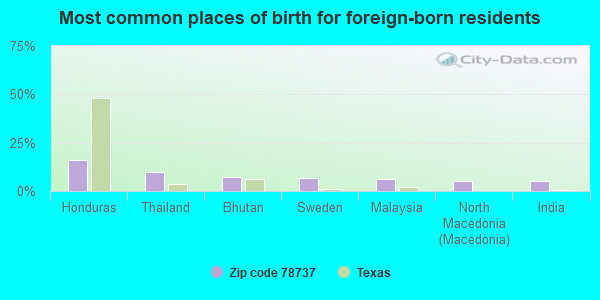
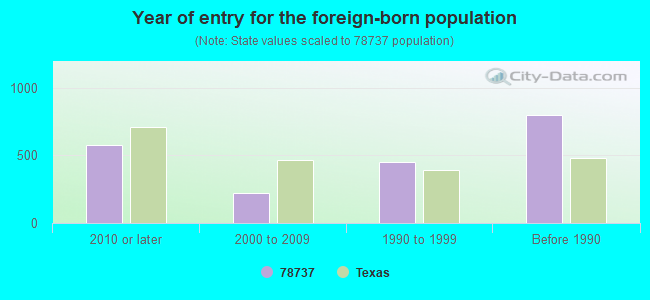
Foreign born population: 1,832 (7.2%) (80.5% of them are naturalized citizens)
This zip code:
7.2%
Whole state:
17.2%
16%Honduras
10%Thailand
7%Bhutan
7%Sweden
6%Malaysia
5%North Macedonia (Macedonia)
5%India
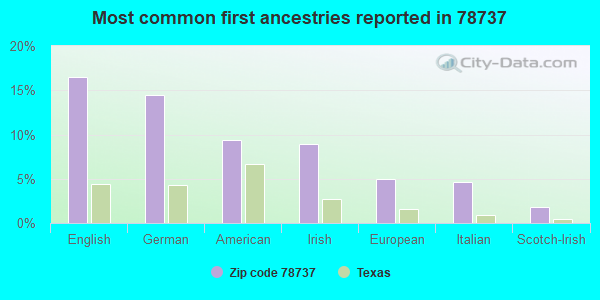
17%English
14%German
9%American
9%Irish
5%European
5%Italian
2%Scotch-Irish
Year of entry for the foreign-born population
5762010 or later
2242000 to 2009
4511990 to 1999
798Before 1990
Housing units lacking complete plumbing facilities: 0.8% Housing units lacking complete kitchen facilities: 1.5%
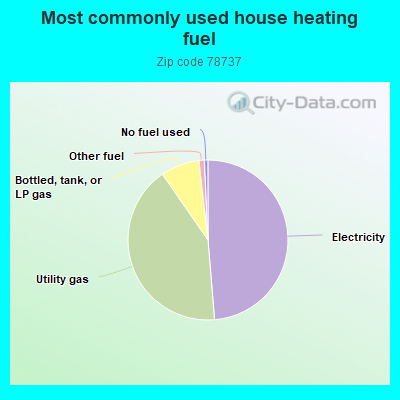
48.5%Electricity
41.5%Utility gas
7.8%Bottled, tank, or LP gas
1.1%Other fuel
0.7%No fuel used
Population in 1990: 4,135. Population change in the 1990s: +2,965 (+71.7%).
Place of birth for U.S.-born residents:
This state: 14,053
Northeast: 1,629
Midwest: 2,490
South: 2,833
West: 2,603
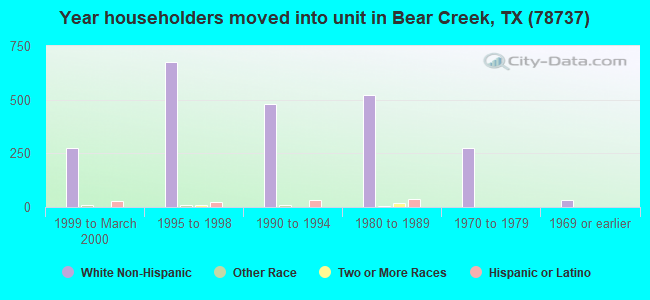
60% of the 78737 zip code residents lived in the same house 5 years ago. Out of people who lived in different houses, 35% lived in this county. Out of people who lived in different counties, 50% lived in Texas.
90% of the 78737 zip code residents lived in the same house 1 year ago. Out of people who lived in different houses, 21% moved from this county. Out of people who lived in different houses, 44% moved from different county within same state. Out of people who lived in different houses, 38% moved from different state. Out of people who lived in different houses, 3% moved from abroad.
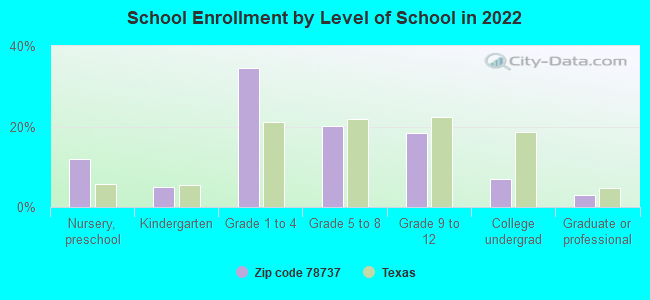
Private vs. public school enrollment:
Students in private schools in grades 1 to 8 (elementary and middle school): 762
Here:
16.1%
Texas:
8.8%
Students in private schools in grades 9 to 12 (high school): 62
Here:
3.9%
Texas:
8.0%
Students in private undergraduate colleges: 30
Here:
5.1%
Texas:
16.2%
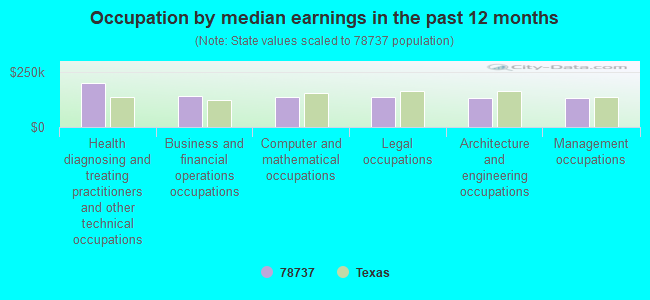
Occupation by median earnings in the past 12 months ($)
199,910Health diagnosing and treating practitioners and other technical occupations
139,252Business and financial operations occupations
137,435Computer and mathematical occupations
137,120Legal occupations
132,514Architecture and engineering occupations
130,497Management occupations
Companies with federal contracts located in this zip code (AUSTIN, TX):
RED RIVER SERVICE CORPORATION (9304 LEDGESTONE TERRACE; small business) : $7,106,452 in 40 contractsfrom 2002 to 2006
Contracts for Maintenance, Repair and Rebuilding of Equipment -- Communication, Detection, and Coherent Radiation Equipment, Trash/Garbage Collection Services - Including Portable Sanitation Services, Telecommunications Network Management Services by Air Force Signed by year:2000: $0; 2001: $0; 2002: $1,206,489; 2003: $987,850; 2004: $1,674,092; 2005: $981,106; 2006: $2,256,915.
Biggest contracts:
$1,705,500 with Air Force for Maintenance, Repair and Rebuilding of Equipment -- Communication, Detection, and Coherent Radiation Equipment. Taking place in AZ. Signed on 2006-04-27. Completion date: 2006-09-30.
$590,615 with Air Force for Trash/Garbage Collection Services - Including Portable Sanitation Services. Taking place in ND. Signed on 2002-10-01. Completion date: 2003-09-30.
$573,010 with Air Force for Maintenance, Repair and Rebuilding of Equipment -- Communication, Detection, and Coherent Radiation Equipment. Taking place in AZ. Signed on 2005-10-01. Completion date: 2006-09-30.
$573,010, same as above.Signed on 2004-10-20. Completion date: 2005-09-30.
ARM AUTOMATION INC (14141 W HWY 290 STE 700; small business) : $497,951 in 4 contractsfrom 2000 to 2004
$286,000 with ENERGY, Department of for Other Environmental Protection -- Basic Research (R&D). Signed on 2001-09-15. Completion date: 2003-09-15.
$140,000 with ENERGY, Department of for Other Environmental Protection -- Advanced Development (R&D). Signed on 2000-07-15. Completion date: 2000-12-15.
$65,951 with Army for Defense Aircraft -- Management and Support (R&D). Signed on 2004-12-09. Completion date: 2005-06-10.
$6,000 with ENERGY, Department of for Other Environmental Protection -- Advanced Development (R&D). Signed on 2001-09-15. Completion date: 2001-07-15.
ENSEMBLE TECHNOLOGIES, INCORPO (15410 FOX RUN; small business)
$64,862 with Air Force for Defense Electronics and Communication Equipment -- Management and Support (R&D). Signed on 2001-05-14. Completion date: 2001-11-21.
DORB CONTROLS INC (12010 HWY 290 W STE150; small business)
$29,100 with Army for Maintenance, Repair and Rebuilding of Equipment -- Refrigeration, Air Conditioning, and Air Circulating Equipment. Signed on 2006-03-08. Completion date: 2006-06-06.
ROBERTS, CAROLYN K (33 CARRIAGE HOUSE LN; small business)
$28,233 with Navy for Antennas, Waveguides, and Related Equipment. Signed on 2004-05-17. Completion date: 2004-06-12.
EIMS LTD (14121 W HIGHWAY 290 STE 4; small business) : $23,730 in 3 contractsfrom 2004 to 2005
$11,550 with Navy for ADP Input/Output and Storage Devices. Signed on 2004-12-13. Completion date: 2004-12-30.
$9,870 with Navy for ADP Supplies. Signed on 2005-11-03. Completion date: 2005-11-21.
$2,310 with Navy for ADP Input/Output and Storage Devices. Signed on 2004-12-29. Completion date: 2005-01-14.
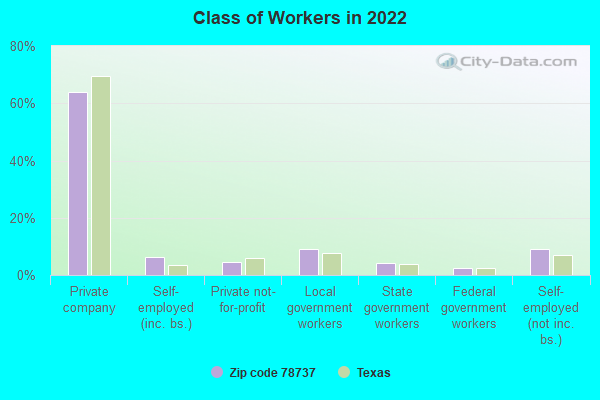
Top industries in this zip code by the number of employees in 2005:
Construction: All Other Specialty Trade Contractors (100-249 employees: 1 establishment, 10-19 employees: 1 establishment, 5-9 employees: 1 establishment)
Construction: Highway, Street, and Bridge Construction (50-99: 1, 5-9: 1, 1-4: 1)
Educational Services: Elementary and Secondary Schools (50-99: 1, 1-4: 1)
Health Care and Social Assistance: Offices of Physicians (except Mental Health Specialists) (20-49: 1, 5-9: 3, 1-4: 4)
2002 - 2018 National Fire Incident Reporting System (NFIRS) incidents
Based on the data from the years 2002 - 2018 the average number of fire incidents per year is 21. The highest number of reported fires - 43 took place in 2018, and the least - 3 in 2002. The data has a growing trend.
When looking into fire subcategories, the most incidents belonged to: Outside Fires (65.1%), and Structure Fires (22.7%).
Fire incident types reported to NFIRS in Zip Code 78737
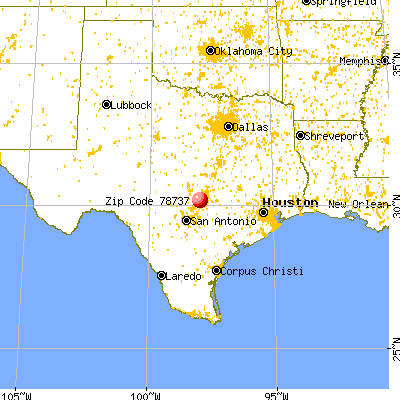


 Nearest zip codes: 78739, 78736, 78652, 78749, 78619, 78735.
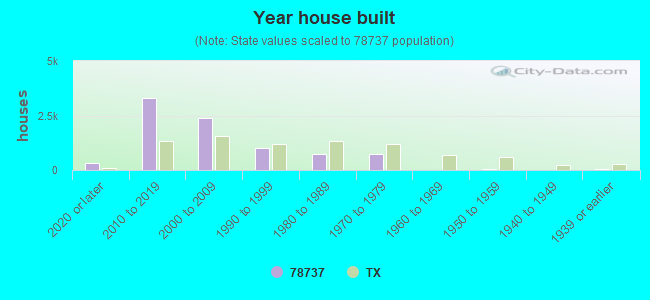


 : $7,106,452 in 40 contracts from 2002 to 2006

 Based on the data from the years 2002 - 2018 the average number of fire incidents per year is 21. The highest number of reported fires - 43 took place in 2018, and the least - 3 in 2002. The data has a growing trend.
 When looking into fire subcategories, the most incidents belonged to: Outside Fires (65.1%), and Structure Fires (22.7%).