Estimated zip code population in 2022: 14,064 Zip code population in 2010: 13,122 Zip code population in 2000: 6,480
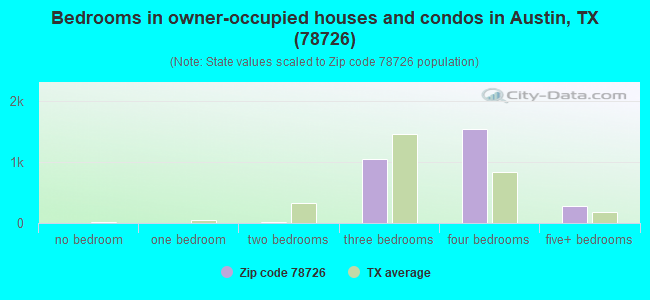
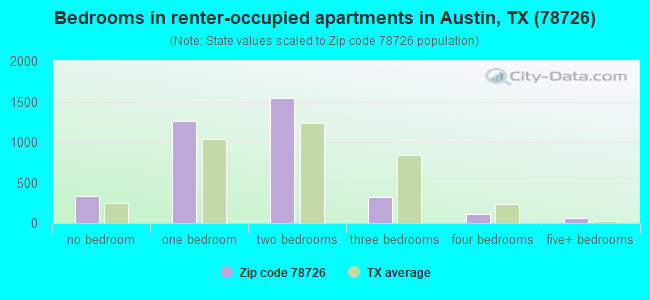
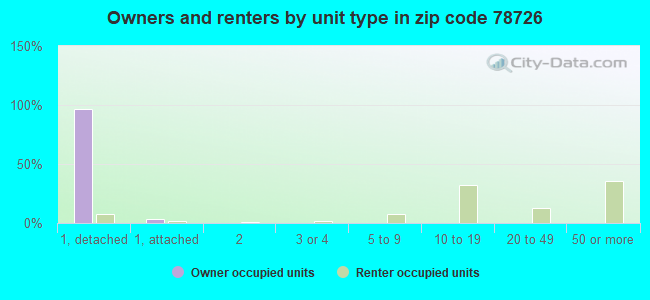
Houses and condos: 6,742 Renter-occupied apartments: 3,603
% of renters here:
56%
State:
38%
March 2022 cost of living index in zip code 78726: 96.5 (near average, U.S. average is 100)
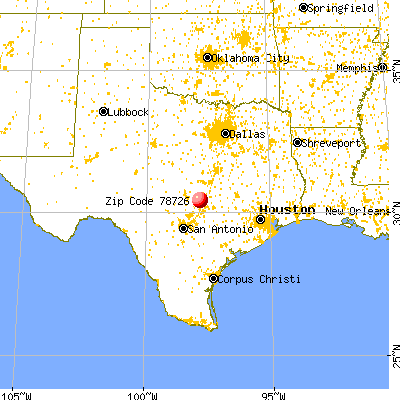
Land area: 10.9 sq. mi. Water area: 0.0 sq. mi.
Population density: 1,294 people per square mile
(low).
OSM Map
General Map
Google Map
MSN Map
OSM Map
General Map
Google Map
MSN Map
OSM Map
General Map
Google Map
MSN Map
OSM Map
General Map
Google Map
MSN Map
Please wait while loading the map...
Real estate property taxes paid for housing units in 2022:
This zip code:
1.5% ($10,460)
Texas:
1.5% ($4,050)
Median real estate property taxes paid for housing units with mortgages in 2022: $10,505 (1.5%) Median real estate property taxes paid for housing units with no mortgage in 2022: $9,338 (1.6%)
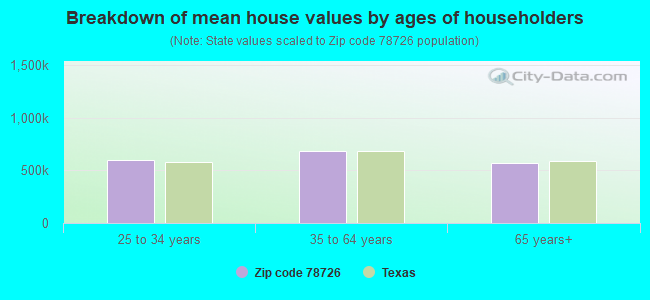
Estimated median house/condo value in 2022: $685,607
78726:
$685,607
Texas:
$275,400
According to our research of Texas and other state lists, there were 2 registered sex offenders living in 78726 zip code as of May 04, 2024. The ratio of all residents to sex offenders in zip code 78726 is 7,062 to 1. The ratio of registered sex offenders to all residents in this zip code is much lower than the state average.
Median resident age:
This zip code:
36.4 years
Texas median age:
35.6 years
Average household size:
This zip code:
2.1 people
Texas:
2.6 people
Averages for the 2020 tax year for zip code 78726, filed in 2021:
Average Adjusted Gross Income (AGI) in 2020: $124,158 (Individual Income Tax Returns)
Here:
$124,158
State:
$77,054
Salary/wage: $101,692 (reported on 88.2% of returns)
Here:
$101,692
State:
$62,766
(% of AGI for various income ranges: 1207.1% for AGIs below $25k, 3806.6% for AGIs $25k-50k, 6691.9% for AGIs $50k-75k, 9525.5% for AGIs $75k-100k, 19233.1% for AGIs $100k-200k, 102269.5% for AGIs over 200k)
Taxable interest for individuals: $2,123 (reported on 33.7% of returns)
This zip code:
$2,123
Texas:
$2,665
(% of AGI for various income ranges: 14.4% for AGIs below $25k, 12.9% for AGIs $25k-50k, 35.4% for AGIs $50k-75k, 70.0% for AGIs $75k-100k, 157.5% for AGIs $100k-200k, 896.2% for AGIs over 200k)
Ordinary dividends: $7,528 (reported on 30.0% of returns)
Here:
$7,528
State:
$10,044
(% of AGI for various income ranges: 17.4% for AGIs below $25k, 32.3% for AGIs $25k-50k, 69.3% for AGIs $50k-75k, 200.0% for AGIs $75k-100k, 553.4% for AGIs $100k-200k, 2978.1% for AGIs over 200k)
Net capital gain/loss in AGI: +$47,215 (reported on 29.2% of returns)
Here:
+$47,215
State:
+$39,590
(% of AGI for various income ranges: 18.9% for AGIs below $25k, 20.1% for AGIs $25k-50k, 115.3% for AGIs $50k-75k, 282.8% for AGIs $75k-100k, 988.3% for AGIs $100k-200k, 24257.3% for AGIs over 200k)
Profit/loss from business: +$15,223 (reported on 19.2% of returns)
Here:
+$15,223
State:
+$10,888
(% of AGI for various income ranges: 118.6% for AGIs below $25k, 121.8% for AGIs $25k-50k, 225.6% for AGIs $50k-75k, 442.1% for AGIs $75k-100k, 674.1% for AGIs $100k-200k, 2846.5% for AGIs over 200k)
Taxable individual retirement arrangement distribution: $32,393 (reported on 6.2% of returns)
78726:
$32,393
Texas:
$24,740
(% of AGI for various income ranges: 25.6% for AGIs below $25k, 35.7% for AGIs $25k-50k, 124.6% for AGIs $50k-75k, 360.7% for AGIs $75k-100k, 849.5% for AGIs $100k-200k, 1752.7% for AGIs over 200k)
Self-employed (Keogh) retirement plans: $21,014 (reported on 1.0% of returns)
78726:
$21,014
Texas:
$29,298
(% of AGI for various income ranges: 34.9% for AGIs $100k-200k, 341.9% for AGIs over 200k)
Total itemized deductions: $36,310 (reported on 11.0% of returns)
Here:
$36,310
State:
$40,428
(% of AGI for various income ranges: 127.7% for AGIs $25k-50k, 109.1% for AGIs $50k-75k, 649.3% for AGIs $75k-100k, 1168.8% for AGIs $100k-200k, 4594.6% for AGIs over 200k)
Charity contributions: $12,655 (reported on 9.2% of returns)
Here:
$12,655
State:
$18,201
(% of AGI for various income ranges: 12.9% for AGIs $25k-50k, 10.4% for AGIs $50k-75k, 92.4% for AGIs $75k-100k, 257.6% for AGIs $100k-200k, 1671.6% for AGIs over 200k)
Taxes paid: $9,331 (reported on 10.9% of returns)
78726:
$9,331
State:
$7,821
(% of AGI for various income ranges: 26.3% for AGIs $25k-50k, 36.2% for AGIs $50k-75k, 178.6% for AGIs $75k-100k, 358.6% for AGIs $100k-200k, 1063.2% for AGIs over 200k)
Earned income credit: $2,125 (reported on 12.0% of returns)
Here:
$2,125
State:
$2,584
(% of AGI for various income ranges: 78.3% for AGIs below $25k, 50.4% for AGIs $25k-50k)
Percentage of individuals using paid preparers for their 2020 taxes: 93.4%
Here:
93%
State:
92%
(% for various income ranges: 92.2% for AGIs below $25k, 93.6% for AGIs $25k-50k, 95.5% for AGIs $50k-75k, 95.2% for AGIs $75k-100k, 92.2% for AGIs $100k-200k, 93.5% for AGIs over 200k)
Averages for the 2012 tax year for zip code 78726, filed in 2013:
Average Adjusted Gross Income (AGI) in 2012: $88,875 (Individual Income Tax Returns)
Here:
$88,875
State:
$65,384
Salary/wage: $80,775 (reported on 89.3% of returns)
Here:
$80,775
State:
$52,524
(% of AGI for various income ranges: 84.1% for AGIs below $25k, 90.0% for AGIs $25k-50k, 85.1% for AGIs $50k-75k, 80.2% for AGIs $75k-100k, 84.4% for AGIs $100k-200k, 76.3% for AGIs over 200k)
Taxable interest for individuals: $1,617 (reported on 36.5% of returns)
This zip code:
$1,617
Texas:
$2,372
(% of AGI for various income ranges: 1.0% for AGIs below $25k, 0.3% for AGIs $25k-50k, 0.5% for AGIs $50k-75k, 0.8% for AGIs $75k-100k, 0.5% for AGIs $100k-200k, 0.8% for AGIs over 200k)
Ordinary dividends: $5,585 (reported on 27.8% of returns)
Here:
$5,585
State:
$9,721
(% of AGI for various income ranges: 2.2% for AGIs below $25k, 0.5% for AGIs $25k-50k, 1.2% for AGIs $50k-75k, 1.2% for AGIs $75k-100k, 1.8% for AGIs $100k-200k, 2.1% for AGIs over 200k)
Net capital gain/loss in AGI: +$11,529 (reported on 25.6% of returns)
Here:
+$11,529
State:
+$35,319
(% of AGI for various income ranges: 0.2% for AGIs $50k-75k, 0.3% for AGIs $75k-100k, 1.4% for AGIs $100k-200k, 6.7% for AGIs over 200k)
Profit/loss from business: +$15,981 (reported on 16.8% of returns)
Here:
+$15,981
State:
+$13,732
(% of AGI for various income ranges: 7.4% for AGIs below $25k, 4.8% for AGIs $25k-50k, 4.4% for AGIs $50k-75k, 2.3% for AGIs $75k-100k, 3.4% for AGIs $100k-200k, 1.8% for AGIs over 200k)
Taxable individual retirement arrangement distribution: $23,642 (reported on 7.5% of returns)
78726:
$23,642
Texas:
$19,511
(% of AGI for various income ranges: 2.3% for AGIs below $25k, 1.3% for AGIs $25k-50k, 2.3% for AGIs $50k-75k, 2.6% for AGIs $75k-100k, 2.1% for AGIs $100k-200k, 1.9% for AGIs over 200k)
Self-employment retirement plans: $28,217 (reported on 0.9% of returns)
78726:
$28,217
Texas:
$23,938
(% of AGI for various income ranges: 0.3% for AGIs $100k-200k, 0.5% for AGIs over 200k)
Total itemized deductions: $25,780 (14% of AGI, reported on 31.8% of returns)
Here:
$25,780
State:
$24,724
Here:
13.9% of AGI
State:
15.9% of AGI
(% of AGI for various income ranges: 7.0% for AGIs below $25k, 3.9% for AGIs $25k-50k, 8.4% for AGIs $50k-75k, 11.1% for AGIs $75k-100k, 12.5% for AGIs $100k-200k, 8.4% for AGIs over 200k)
Charity contributions: $5,080 (reported on 26.4% of returns)
Here:
$5,080
State:
$6,808
(% of AGI for various income ranges: 0.5% for AGIs below $25k, 0.4% for AGIs $25k-50k, 1.1% for AGIs $50k-75k, 1.3% for AGIs $75k-100k, 1.9% for AGIs $100k-200k, 1.7% for AGIs over 200k)
Taxes paid: $10,519 (reported on 31.2% of returns)
78726:
$10,519
State:
$6,921
(% of AGI for various income ranges: 2.3% for AGIs below $25k, 1.2% for AGIs $25k-50k, 2.6% for AGIs $50k-75k, 4.0% for AGIs $75k-100k, 5.0% for AGIs $100k-200k, 3.7% for AGIs over 200k)
Earned income credit: $1,786 (reported on 10.2% of returns)
Here:
$1,786
State:
$2,570
(% of AGI for various income ranges: 3.6% for AGIs below $25k, 0.6% for AGIs $25k-50k)
Percentage of individuals using paid preparers for their 2012 taxes: 32.0%
Here:
32%
State:
51%
(% for various income ranges: 26.8% for AGIs below $25k, 27.1% for AGIs $25k-50k, 32.9% for AGIs $50k-75k, 36.2% for AGIs $75k-100k, 36.0% for AGIs $100k-200k, 47.8% for AGIs over 200k)
Averages for the 2004 tax year for zip code 78726, filed in 2005:
Average Adjusted Gross Income (AGI) in 2004: $75,363 (Individual Income Tax Returns)
Here:
$75,363
State:
$47,881
Salary/wage: $69,261 (reported on 90.4% of returns)
Here:
$69,261
State:
$41,947
(% of AGI for various income ranges: 112.7% for AGIs below $10k, 91.4% for AGIs $10k-25k, 90.2% for AGIs $25k-50k, 83.8% for AGIs $50k-75k, 85.5% for AGIs $75k-100k, 80.7% for AGIs over 100k)
Taxable interest for individuals: $1,233 (reported on 44.2% of returns)
This zip code:
$1,233
Texas:
$2,255
(% of AGI for various income ranges: 5.0% for AGIs below $10k, 1.1% for AGIs $10k-25k, 0.9% for AGIs $25k-50k, 0.8% for AGIs $50k-75k, 1.1% for AGIs $75k-100k, 0.6% for AGIs over 100k)
Taxable dividends: $2,440 (reported on 31.3% of returns)
Here:
$2,440
State:
$4,261
(% of AGI for various income ranges: 3.9% for AGIs below $10k, 0.7% for AGIs $10k-25k, 0.9% for AGIs $25k-50k, 1.1% for AGIs $50k-75k, 1.1% for AGIs $75k-100k, 1.0% for AGIs over 100k)
Net capital gain/loss: +$11,763 (reported on 30.8% of returns)
Here:
+$11,763
State:
+$16,110
(% of AGI for various income ranges: -1.3% for AGIs below $10k, 0.6% for AGIs $10k-25k, -0.1% for AGIs $25k-50k, 0.7% for AGIs $50k-75k, 0.8% for AGIs $75k-100k, 7.0% for AGIs over 100k)
Profit/loss from business: +$16,206 (reported on 15.2% of returns)
Here:
+$16,206
State:
+$11,013
(% of AGI for various income ranges: 9.4% for AGIs below $10k, 3.7% for AGIs $10k-25k, 2.8% for AGIs $25k-50k, 4.6% for AGIs $50k-75k, 2.3% for AGIs $75k-100k, 3.2% for AGIs over 100k)
IRA payment deduction: $3,093 (reported on 2.8% of returns)
78726:
$3,093
Texas:
$3,120
(% of AGI for various income ranges: 0.1% for AGIs $10k-25k, 0.1% for AGIs $25k-50k, 0.2% for AGIs $50k-75k, 0.2% for AGIs $75k-100k, 0.1% for AGIs over 100k)
Self-employed pension: $12,254 (reported on 1.3% of returns)
Here:
$12,254
Texas:
$16,401
Total itemized deductions: $24,359 (17% of AGI, reported on 36.8% of returns)
Here:
$24,359
State:
$19,631
Here:
17.3% of AGI
State:
18.9% of AGI
(% of AGI for various income ranges: 17.8% for AGIs below $10k, 5.1% for AGIs $10k-25k, 7.8% for AGIs $25k-50k, 12.3% for AGIs $50k-75k, 17.4% for AGIs $75k-100k, 12.2% for AGIs over 100k)
Charity contributions deductions: $4,801 (3% of AGI, reported on 32.6% of returns)
Here:
$4,801
State:
$4,753
Here:
3.3% of AGI
State:
4.2% of AGI
(% of AGI for various income ranges: 0.6% for AGIs below $10k, 0.3% for AGIs $10k-25k, 0.9% for AGIs $25k-50k, 1.5% for AGIs $50k-75k, 1.9% for AGIs $75k-100k, 2.5% for AGIs over 100k)
Total tax: $13,940 (reported on 84.6% of returns)
78726:
$13,940
State:
$9,058
(% of AGI for various income ranges: 3.6% for AGIs below $10k, 5.6% for AGIs $10k-25k, 9.0% for AGIs $25k-50k, 11.2% for AGIs $50k-75k, 10.3% for AGIs $75k-100k, 18.8% for AGIs over 100k)
Earned income credit: $1,394 (reported on 7.0% of returns)
Here:
$1,394
State:
$2,024
Percentage of individuals using paid preparers for their 2004 taxes: 33.8%
Here:
34%
State:
57%
(% for various income ranges: 32.7% for AGIs below $10k, 31.9% for AGIs $10k-25k, 31.7% for AGIs $25k-50k, 36.0% for AGIs $50k-75k, 32.7% for AGIs $75k-100k, 37.3% for AGIs over 100k)
Likely homosexual households (counted as self-reported same-sex unmarried-partner households)
Lesbian couples: 0.8% of all households
Gay men: 0.6% of all households
Household received Food Stamps/SNAP in the past 12 months: 184 Household did not receive Food Stamps/SNAP in the past 12 months: 6,258
Women who had a birth in the past 12 months: 212 (63 now married, 144 unmarried) Women who did not have a birth in the past 12 months: 3,414 (1,962 now married, 1,437 unmarried)
Housing units in zip code 78726 with a mortgage: 1,943 (105 second mortgage, 110 both second mortgage and home equity loan) Houses without a mortgage: 92
Median monthly owner costs for units with a mortgage: $3,370 Median monthly owner costs for units without a mortgage: $1,194
Residents with income below the poverty level in 2022:
This zip code:
10.2%
Whole state:
14.0%
Residents with income below 50% of the poverty level in 2022:
This zip code:
3.5%
Whole state:
7.4%
Median number of rooms in houses and condos:
Here:
8.1
State:
6.3
Median number of rooms in apartments:
Here:
3.4
State:
4.0
Notable locations in this zip code not listed on our city pages
Notable locations in zip code 78726: Austin Fire Department Station 39 (A), Austin / Travis County Emergency Medical Service - Rescue 16 (B), 3M Austin Center Emergency Response Team (C). Display/hide their locations on the map
In group quarters: 279 (-1 institutionalized population)
Size of family households: 1,479 2-persons, 902 3-persons, 994 4-persons, 146 5-persons, 11 6-persons, 70 7-or-more-persons
Size of nonfamily households: 2,255 1-person, 658 2-persons
2,072 married couples with children.
539 single-parent households (16 men, 523 women).
70.6% of residents of 78726 zip code speak English at home.
9.4% of residents speak Spanish at home (58% very well, 22% well, 20% not well).
6.8% of residents speak other Indo-European language at home (55% very well, 21% well, 24% not well).
9.4% of residents speak Asian or Pacific Island language at home (80% very well, 15% well, 5% not well).
4.1% of residents speak other language at home (64% very well, 24% well, 12% not well).
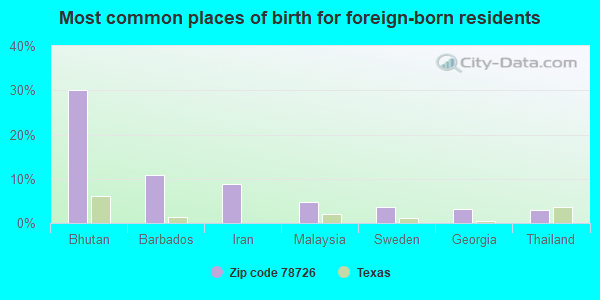
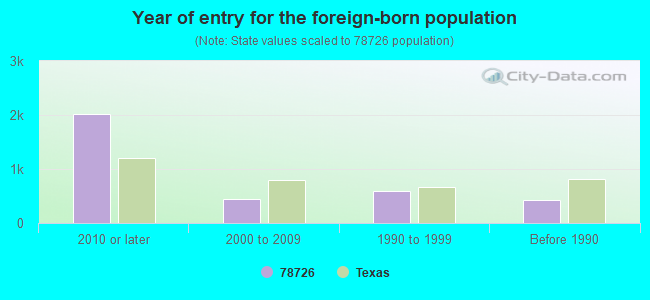
Foreign born population: 3,033 (21.6%) (49.7% of them are naturalized citizens)
Facilities with environmental interests located in this zip code:
3M AUSTIN CENTER (6801 RIVERPLACE BLVD in AUSTIN, TX)
AIR MAJOR (AIRS/AFS) AIR MINOR (AIRS/AFS) CRITERIA AND HAZARDOUS AIR POLLUTANT INVENTORY (Inventory of air pollution sources) HAZARDOUS WASTE BIENNIAL REPORTER (Resource Conservation and Recovery Act (tracking hazardous waste)) Large Quantity Generators, more that 1000 kg of hazardous waste/month (Resource Conservation and Recovery Act (tracking hazardous waste)) - notification Business SIC classification: TELEPHONE AND TELEGRAPH APPARATUS; INSTRUMENTS FOR MEASURING AND TESTING OF ELECTRICITY AND ELECTRICAL SIGNALS; COMMERCIAL PHYSICAL AND BIOLOGICAL RESEARCH Organizations: 3M COMPANY (CONTACT/OPERATOR)
Alternative names: 3 M. COMPANY, 3M COMPANY
ANTHEATER CO INC (12400 FM 2769 CEDAR PARK in AUSTIN, TX)
(Integrated Compliance Information System) - ICIS-06-1995-0056, FORMAL ENFORCEMENT ACTION Business SIC classification: CHEMICALS AND ALLIED PRODUCTS
AUSTIN HORNSBY BEND POND (9511 RANCH ROAD 620 N in AUSTIN, TX)
(Resource Conservation and Recovery Act (tracking hazardous waste)) Alternative names: AUSTIN CITY OF HORNSBY BEND PONDS
Housing units lacking complete plumbing facilities: 0.1% Housing units lacking complete kitchen facilities: 1.9%
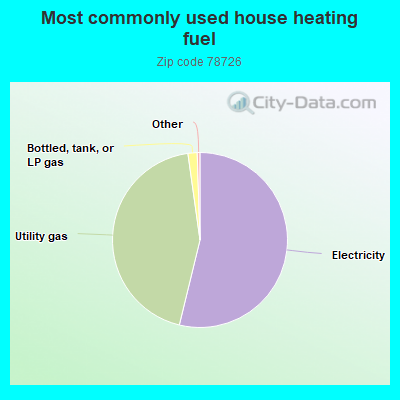
53.8%Electricity
44.0%Utility gas
1.7%Bottled, tank, or LP gas
Population in 1990: 871. Population change in the 1990s: +5,609 (+644.0%).
Place of birth for U.S.-born residents:
This state: 5,555
Northeast: 1,130
Midwest: 1,609
South: 916
West: 1,672
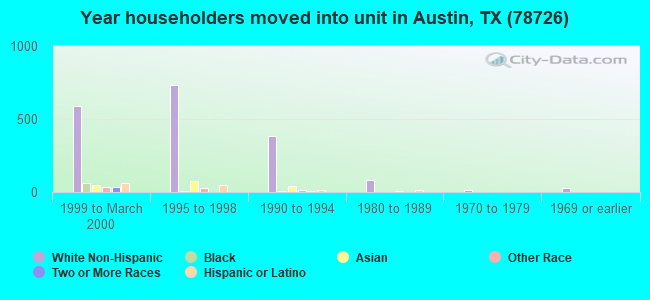
35% of the 78726 zip code residents lived in the same house 5 years ago. Out of people who lived in different houses, 27% lived in this county. Out of people who lived in different counties, 50% lived in Texas.
79% of the 78726 zip code residents lived in the same house 1 year ago. Out of people who lived in different houses, 38% moved from this county. Out of people who lived in different houses, 31% moved from different county within same state. Out of people who lived in different houses, 18% moved from different state. Out of people who lived in different houses, 15% moved from abroad.
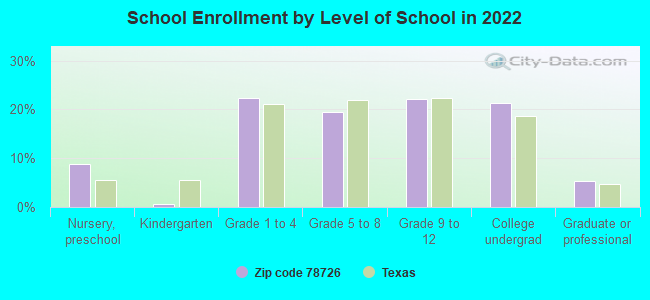
Private vs. public school enrollment:
Students in private schools in grades 1 to 8 (elementary and middle school): 171
Here:
13.1%
Texas:
8.8%
Students in private schools in grades 9 to 12 (high school):
Here:
0.0%
Texas:
8.0%
Students in private undergraduate colleges: 221
Here:
33.3%
Texas:
16.2%
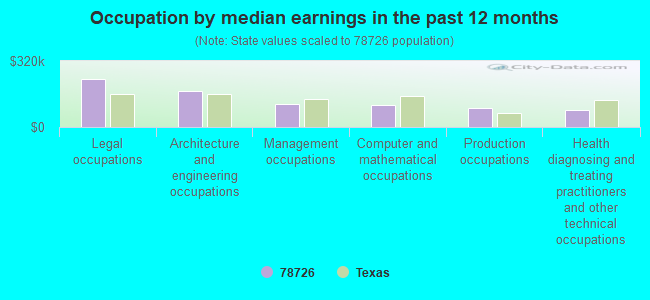
Occupation by median earnings in the past 12 months ($)
230,442Legal occupations
173,804Architecture and engineering occupations
113,356Management occupations
106,532Computer and mathematical occupations
92,748Production occupations
84,146Health diagnosing and treating practitioners and other technical occupations
Companies with federal contracts located in this zip code (AUSTIN, TX):
PHOENIX MANAGEMENT, INC (11825 BUCKNER ROAD; small business) : $275,498,454 in 458 contractsfrom 1999 to 2006
Contracts for Logistics Support Services, Operation of Government-Owned Facilities -- Other Administrative Facilities and Service Buildings, Other Professional Services, Operation of Government-Owned Facilities -- Miscellaneous Buildings, and moreby Air Force, Army, Navy Signed by year:2000: $14,239,734; 2001: $32,476,005; 2002: $35,925,853; 2003: $36,836,193; 2004: $32,580,617; 2005: $94,390,031; 2006: $16,752,277.
Biggest contracts:
$52,771,071 with Air Force for Logistics Support Services. Taking place in CO. Signed on 2005-10-01. Completion date: 2006-09-30.
$12,110,105, same as above.Signed on 2004-10-01. Completion date: 2005-09-30.
$11,289,900, same as above.Signed on 2003-10-03. Completion date: 2004-09-30.
$10,018,000 with Air Force for Operation of Government-Owned Facilities -- Other Administrative Facilities and Service Buildings. Taking place in MA. Signed on 2005-03-01. Completion date: 2006-02-28.
NANO SCIENCE DIAGNOSTICS, INC (10520 CANYON VISTA WAY; small business) : $874,963 in 4 contractsfrom 2003 to 2005
$412,767 with Army for Other Research and Development -- Applied Research and Exploratory Development (R&D). Signed on 2004-08-26. Completion date: 2005-08-25.
$337,219, same as above.Signed on 2005-07-28. Completion date: 2006-08-25.
$99,992, same as above.Signed on 2003-08-20. Completion date: 2004-02-19.
$24,985 with Army for Chemical/Biological Studies and Analyses. Signed on 2004-05-21. Completion date: 2004-11-24.
SIXSIGMA US (7301 RR 620N; small business) : $155,650 in 6 contractsfrom 2003 to 2006
Contracts for Program Review/Development Services, Training/Curriculum Development, Policy Review/Development Services, Other Education and Training Services, and moreby Army, Air Force Signed by year:2000: $0; 2001: $0; 2002: $0; 2003: $56,000; 2004: $39,800; 2005: $51,850; 2006: $8,000.
Biggest contracts:
$56,000 with Army for Program Review/Development Services. Signed on 2003-09-07. Completion date: 2004-10-01.
$39,800 with Army for Training/Curriculum Development. Signed on 2004-09-08. Completion date: 2005-04-15.
$36,400, same as above.Signed on 2005-09-14. Completion date: 2006-09-30.
$9,600 with Army for Policy Review/Development Services. Taking place in MN. Signed on 2005-09-21. Completion date: 2005-11-04.
AUSTIN COURT & FLOORS INC (10208 RANCH ROAD 620 N; small business) : $70,145 in 2 contractsfrom 2003 to 2004
$36,695 with Air Force for Maintenance, Repair or Alteration of Real Property -- Recreation Facilities (Non-Building). Signed on 2003-06-02. Completion date: 2003-08-29.
$33,450 with Air Force for Floor Coverings. Signed on 2004-09-23. Completion date: 2004-10-22.
3M COMPANY (6801 RIVER PLACE BLVD; small business)
$60,100 with Navy for Other Defense -- Applied Research and Exploratory Development (R&D). Signed on 2001-10-01. Completion date: 2001-12-24.
PROCESS NETWORKS PLUS, INC (10713 RANCH ROAD 620 N) : $40,540 in 2 contractsin 2002
$23,740 with Army for ADPE System Configuration. Signed on 2002-09-30. Completion date: 2002-11-29.
$16,800 with Army for Maintenance, Repair or Alteration of Real Property -- Restoration of real property. Signed on 2002-09-30. Completion date: 2003-09-30.
Top industries in this zip code by the number of employees in 2005:
Management of Companies and Enterprises: Corporate, Subsidiary, and Regional Managing Offices (over 1000 employees: 1 establishment)
Administrative and Support and Waste Management and Remediation Services: Office Administrative Services (500-999: 1, 1-4: 1)
Administrative and Support and Waste Management and Remediation Services: Temporary Help Services (250-499: 1, 1-4: 1)
Real Estate and Rental and Leasing: Lessors of Residential Buildings and Dwellings (100-249: 1, 5-9: 3)
Other Services (except Public Administration): Religious Organizations (50-99: 1, 20-49: 2, 10-19: 1, 5-9: 1)
Construction: Electrical Contractors (50-99: 1)
Information: Software Publishers (50-99: 1)
Finance and Insurance: Third Party Administration of Insurance and Pension Funds (50-99: 1)
People in group quarters in 2010:
209 people in college/university student housing
Fatal accident statistics in 2014:
Fatal accident count: 1
Vehicles involved in fatal accidents: 2
Fatal accidents caused by drunken drivers: 0
Fatalities: 1
Persons involved in fatal accidents: 4
Pedestrians involved in fatal accidents: 0
Fatal accident statistics in 2013:
Fatal accident count: 1
Vehicles involved in fatal accidents: 2
Fatal accidents caused by drunken drivers: 0
Fatalities: 1
Persons involved in fatal accidents: 2
Pedestrians involved in fatal accidents: 0
Home Mortgage Disclosure Act Aggregated Statistics For Year 2009 (Based on 4 partial tracts)
A) FHA, FSA/RHS & VA Home Purchase Loans
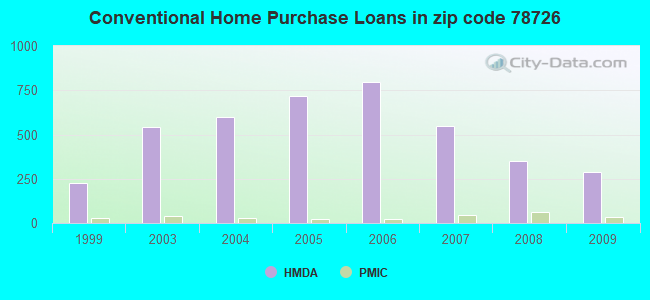
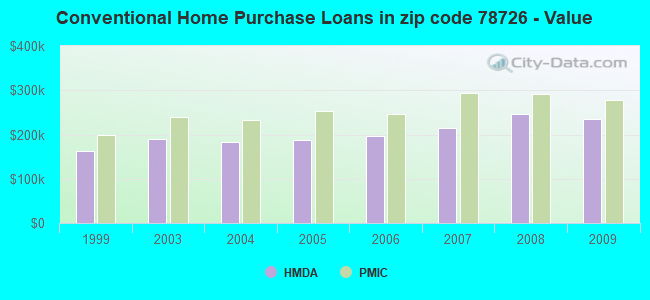
B) Conventional Home Purchase Loans
C) Refinancings
D) Home Improvement Loans
E) Loans on Dwellings For 5+ Families
F) Non-occupant Loans on < 5 Family Dwellings (A B C & D)
Number
Average Value
Number
Average Value
Number
Average Value
Number
Average Value
Number
Average Value
Number
Average Value
LOANS ORIGINATED
38
$254,199
286
$235,627
888
$254,258
31
$108,393
2
$12,692,160
8
$291,970
APPLICATIONS APPROVED, NOT ACCEPTED
2
$221,300
26
$258,418
48
$227,069
2
$147,410
0
$0
3
$132,863
APPLICATIONS DENIED
2
$265,330
29
$234,594
139
$251,165
17
$107,428
0
$0
4
$283,455
APPLICATIONS WITHDRAWN
7
$267,519
36
$257,643
169
$253,566
5
$137,844
0
$0
7
$229,611
FILES CLOSED FOR INCOMPLETENESS
0
$0
7
$316,686
49
$271,814
4
$43,822
0
$0
0
$0
Aggregated Statistics For Year 2008 (Based on 4 partial tracts)
A) FHA, FSA/RHS & VA Home Purchase Loans
B) Conventional Home Purchase Loans
C) Refinancings
D) Home Improvement Loans
F) Non-occupant Loans on < 5 Family Dwellings (A B C & D)
G) Loans On Manufactured Home Dwelling (A B C & D)
Number
Average Value
Number
Average Value
Number
Average Value
Number
Average Value
Number
Average Value
Number
Average Value
LOANS ORIGINATED
17
$250,672
348
$245,839
278
$235,977
43
$106,571
14
$322,896
0
$0
APPLICATIONS APPROVED, NOT ACCEPTED
1
$252,560
24
$208,846
34
$236,343
7
$101,476
3
$173,000
1
$77,870
APPLICATIONS DENIED
4
$286,508
38
$210,871
73
$246,430
26
$128,132
12
$238,045
0
$0
APPLICATIONS WITHDRAWN
1
$235,660
55
$270,920
64
$260,882
16
$120,584
8
$279,681
0
$0
FILES CLOSED FOR INCOMPLETENESS
1
$171,800
7
$317,234
13
$253,812
0
$0
1
$373,270
0
$0
Aggregated Statistics For Year 2007 (Based on 4 partial tracts)
A) FHA, FSA/RHS & VA Home Purchase Loans
B) Conventional Home Purchase Loans
C) Refinancings
D) Home Improvement Loans
E) Loans on Dwellings For 5+ Families
F) Non-occupant Loans on < 5 Family Dwellings (A B C & D)
G) Loans On Manufactured Home Dwelling (A B C & D)
Number
Average Value
Number
Average Value
Number
Average Value
Number
Average Value
Number
Average Value
Number
Average Value
Number
Average Value
LOANS ORIGINATED
12
$253,175
548
$215,725
176
$278,498
44
$70,925
2
$25,689,420
33
$249,312
4
$43,035
APPLICATIONS APPROVED, NOT ACCEPTED
2
$154,705
69
$247,047
24
$245,250
12
$85,412
0
$0
7
$304,186
3
$192,553
APPLICATIONS DENIED
0
$0
57
$222,385
89
$289,792
21
$58,283
0
$0
16
$206,221
2
$19,835
APPLICATIONS WITHDRAWN
2
$260,350
47
$225,445
47
$323,673
6
$174,767
0
$0
10
$329,475
0
$0
FILES CLOSED FOR INCOMPLETENESS
0
$0
11
$251,180
20
$315,680
4
$77,350
0
$0
0
$0
0
$0
Aggregated Statistics For Year 2006 (Based on 4 partial tracts)
A) FHA, FSA/RHS & VA Home Purchase Loans
B) Conventional Home Purchase Loans
C) Refinancings
D) Home Improvement Loans
F) Non-occupant Loans on < 5 Family Dwellings (A B C & D)
G) Loans On Manufactured Home Dwelling (A B C & D)
Number
Average Value
Number
Average Value
Number
Average Value
Number
Average Value
Number
Average Value
Number
Average Value
LOANS ORIGINATED
6
$240,738
799
$196,297
146
$246,279
40
$88,600
75
$209,611
2
$67,530
APPLICATIONS APPROVED, NOT ACCEPTED
0
$0
96
$171,401
14
$305,589
9
$40,886
7
$188,309
0
$0
APPLICATIONS DENIED
0
$0
66
$191,898
71
$240,508
26
$79,505
6
$289,700
0
$0
APPLICATIONS WITHDRAWN
1
$285,100
91
$210,612
78
$234,092
5
$270,344
13
$205,015
2
$130,175
FILES CLOSED FOR INCOMPLETENESS
0
$0
15
$245,987
20
$311,032
2
$19,845
4
$190,710
0
$0
Aggregated Statistics For Year 2005 (Based on 4 partial tracts)
A) FHA, FSA/RHS & VA Home Purchase Loans
B) Conventional Home Purchase Loans
C) Refinancings
D) Home Improvement Loans
E) Loans on Dwellings For 5+ Families
F) Non-occupant Loans on < 5 Family Dwellings (A B C & D)
G) Loans On Manufactured Home Dwelling (A B C & D)
Number
Average Value
Number
Average Value
Number
Average Value
Number
Average Value
Number
Average Value
Number
Average Value
Number
Average Value
LOANS ORIGINATED
8
$204,459
715
$188,189
241
$226,417
31
$102,702
0
$0
49
$188,452
0
$0
APPLICATIONS APPROVED, NOT ACCEPTED
0
$0
72
$183,921
26
$187,722
11
$45,224
2
$6,508,800
6
$216,703
2
$31,670
APPLICATIONS DENIED
2
$208,890
86
$239,971
100
$214,299
23
$70,322
0
$0
7
$263,797
2
$59,220
APPLICATIONS WITHDRAWN
0
$0
75
$240,918
87
$272,148
6
$213,622
0
$0
4
$207,958
0
$0
FILES CLOSED FOR INCOMPLETENESS
2
$257,910
11
$164,516
49
$247,154
0
$0
0
$0
2
$259,615
0
$0
Aggregated Statistics For Year 2004 (Based on 4 partial tracts)
A) FHA, FSA/RHS & VA Home Purchase Loans
B) Conventional Home Purchase Loans
C) Refinancings
D) Home Improvement Loans
F) Non-occupant Loans on < 5 Family Dwellings (A B C & D)
G) Loans On Manufactured Home Dwelling (A B C & D)
Number
Average Value
Number
Average Value
Number
Average Value
Number
Average Value
Number
Average Value
Number
Average Value
LOANS ORIGINATED
8
$187,876
600
$182,616
428
$216,083
47
$74,311
35
$172,206
2
$45,760
APPLICATIONS APPROVED, NOT ACCEPTED
0
$0
103
$169,704
63
$194,488
2
$40,790
10
$191,298
0
$0
APPLICATIONS DENIED
4
$116,918
58
$163,256
128
$221,638
20
$115,822
8
$227,324
1
$114,950
APPLICATIONS WITHDRAWN
3
$115,807
59
$211,604
93
$220,422
5
$107,500
9
$139,062
0
$0
FILES CLOSED FOR INCOMPLETENESS
0
$0
17
$168,078
14
$256,159
0
$0
0
$0
0
$0
Aggregated Statistics For Year 2003 (Based on 4 partial tracts)
A) FHA, FSA/RHS & VA Home Purchase Loans
B) Conventional Home Purchase Loans
C) Refinancings
D) Home Improvement Loans
E) Loans on Dwellings For 5+ Families
F) Non-occupant Loans on < 5 Family Dwellings (A B C & D)
Number
Average Value
Number
Average Value
Number
Average Value
Number
Average Value
Number
Average Value
Number
Average Value
LOANS ORIGINATED
11
$172,676
542
$189,805
1,351
$199,808
46
$59,412
2
$15,604,850
31
$207,387
APPLICATIONS APPROVED, NOT ACCEPTED
1
$76,630
64
$166,278
132
$182,044
10
$46,928
0
$0
6
$247,698
APPLICATIONS DENIED
4
$115,182
43
$174,668
193
$208,512
22
$37,626
0
$0
7
$412,493
APPLICATIONS WITHDRAWN
2
$157,070
62
$191,447
206
$228,433
8
$81,845
0
$0
4
$85,422
FILES CLOSED FOR INCOMPLETENESS
0
$0
7
$299,260
25
$209,520
0
$0
0
$0
0
$0
Aggregated Statistics For Year 1999 (Based on 1 partial tract)
A) FHA, FSA/RHS & VA Home Purchase Loans
B) Conventional Home Purchase Loans
C) Refinancings
D) Home Improvement Loans
F) Non-occupant Loans on < 5 Family Dwellings (A B C & D)
Detailed PMIC statistics for the following Tracts:0017.14
, 0017.65
2002 - 2018 National Fire Incident Reporting System (NFIRS) incidents
Based on the data from the years 2002 - 2018 the average number of fire incidents per year is 19. The highest number of reported fires - 31 took place in 2015, and the least - 8 in 2017. The data has a growing trend.
When looking into fire subcategories, the most incidents belonged to: Outside Fires (45.0%), and Structure Fires (28.1%).
Fire incident types reported to NFIRS in Zip Code 78726


 Nearest zip codes: 78750, 78730, 78613, 78732, 78759, 78729.
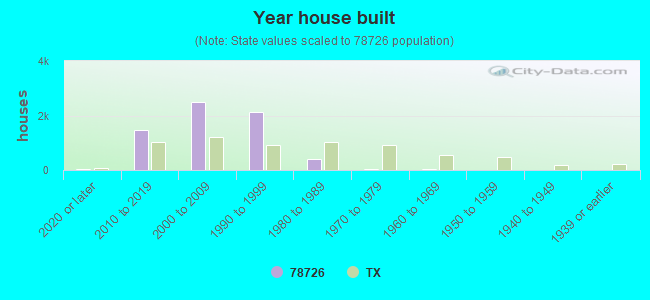


 Based on the data from the years 2002 - 2018 the average number of fire incidents per year is 19. The highest number of reported fires - 31 took place in 2015, and the least - 8 in 2017. The data has a growing trend.
 When looking into fire subcategories, the most incidents belonged to: Outside Fires (45.0%), and Structure Fires (28.1%).