Estimated zip code population in 2022: 10,725 Zip code population in 2010: 11,425 Zip code population in 2000: 10,124
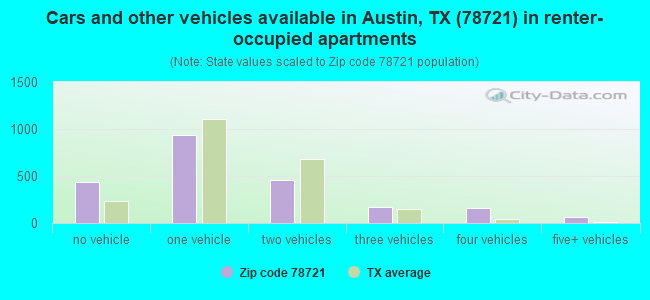
Houses and condos: 4,731 Renter-occupied apartments: 2,224
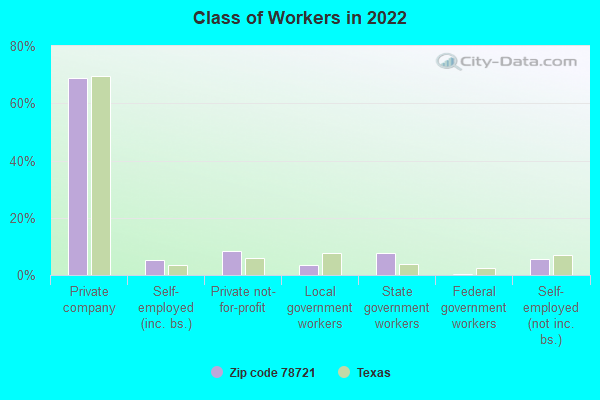
% of renters here:
50%
State:
38%
March 2022 cost of living index in zip code 78721: 96.0 (near average, U.S. average is 100)
Land area: 3.7 sq. mi. Water area: 0.0 sq. mi.
Population density: 2,897 people per square mile
(average).
OSM Map
General Map
Google Map
MSN Map
OSM Map
General Map
Google Map
MSN Map
OSM Map
General Map
Google Map
MSN Map
OSM Map
General Map
Google Map
MSN Map
Please wait while loading the map...
Real estate property taxes paid for housing units in 2022:
This zip code:
1.3% ($6,658)
Texas:
1.5% ($4,050)
Median real estate property taxes paid for housing units with mortgages in 2022: $7,531 (1.4%) Median real estate property taxes paid for housing units with no mortgage in 2022: $3,661 (0.8%)
Business Search- 14 Million verified businesses
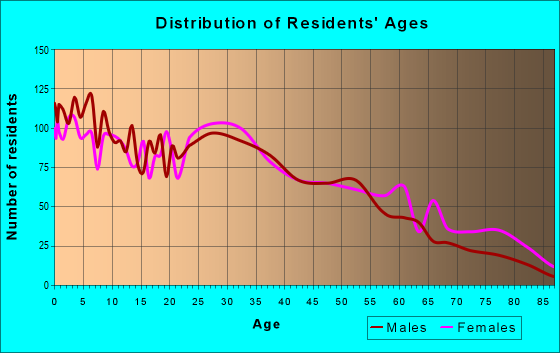
Males: 5,401
(50.4%)
Females: 5,324
(49.6%)
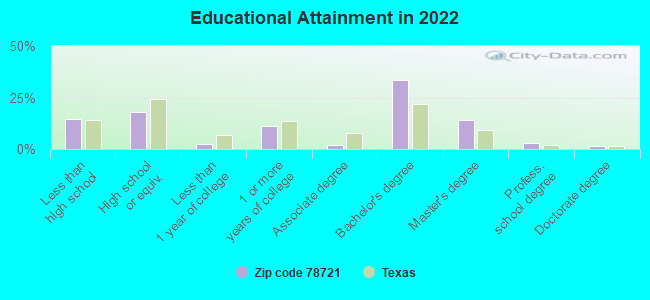
For population 25 years and over in 78721:
High school or higher: 86.8%
Bachelor's degree or higher: 52.4%
Graduate or professional degree: 18.3%
Unemployed: 2.5%
Mean travel time to work (commute): 23.9 minutes
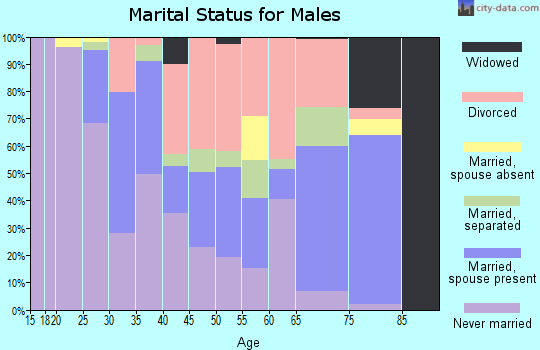
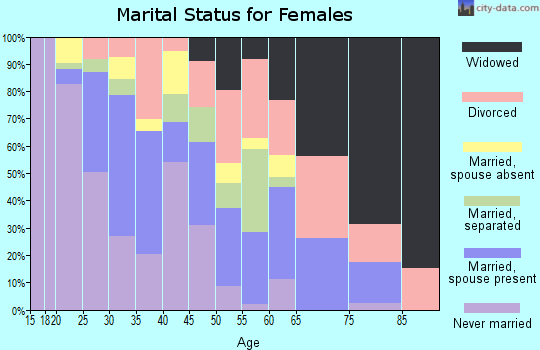
For population 15 years and over in 78721:
Never married: 46.4%
Now married: 37.5%
Separated: 3.7%
Widowed: 3.3%
Divorced: 9.1%
Zip code 78721 compared to state average:
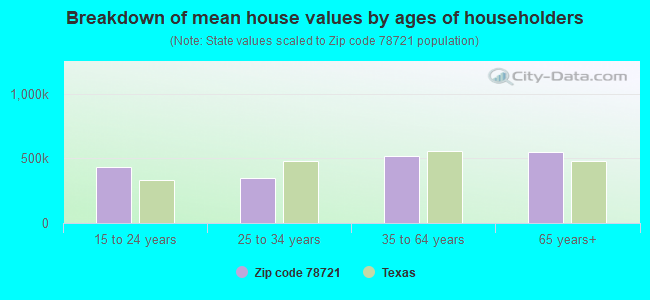
Median house value above state average.
Unemployed percentage below state average.
Length of stay since moving in significantly below state average.
Percentage of population with a bachelor's degree or higher above state average.
Averages for the 2020 tax year for zip code 78721, filed in 2021:
Average Adjusted Gross Income (AGI) in 2020: $62,876 (Individual Income Tax Returns)
Here:
$62,876
State:
$77,054
Salary/wage: $59,114 (reported on 88.0% of returns)
Here:
$59,114
State:
$62,766
(% of AGI for various income ranges: 1114.8% for AGIs below $25k, 3725.6% for AGIs $25k-50k, 7176.5% for AGIs $50k-75k, 11278.6% for AGIs $75k-100k, 19797.3% for AGIs $100k-200k, 68092.0% for AGIs over 200k)
Taxable interest for individuals: $441 (reported on 20.1% of returns)
This zip code:
$441
Texas:
$2,665
(% of AGI for various income ranges: 1.8% for AGIs below $25k, 9.2% for AGIs $25k-50k, 6.6% for AGIs $50k-75k, 14.3% for AGIs $75k-100k, 40.4% for AGIs $100k-200k, 98.0% for AGIs over 200k)
Ordinary dividends: $1,891 (reported on 16.1% of returns)
Here:
$1,891
State:
$10,044
(% of AGI for various income ranges: 6.9% for AGIs below $25k, 15.5% for AGIs $25k-50k, 28.4% for AGIs $50k-75k, 68.3% for AGIs $75k-100k, 89.0% for AGIs $100k-200k, 691.0% for AGIs over 200k)
Net capital gain/loss in AGI: +$17,712 (reported on 15.7% of returns)
Here:
+$17,712
State:
+$39,590
(% of AGI for various income ranges: 1.6% for AGIs below $25k, 18.6% for AGIs $25k-50k, 50.8% for AGIs $50k-75k, 128.3% for AGIs $75k-100k, 465.8% for AGIs $100k-200k, 13544.0% for AGIs over 200k)
Profit/loss from business: +$13,207 (reported on 19.1% of returns)
Here:
+$13,207
State:
+$10,888
(% of AGI for various income ranges: 193.6% for AGIs below $25k, 204.3% for AGIs $25k-50k, 222.9% for AGIs $50k-75k, 465.7% for AGIs $75k-100k, 830.8% for AGIs $100k-200k, 2519.0% for AGIs over 200k)
Taxable individual retirement arrangement distribution: $17,321 (reported on 2.3% of returns)
78721:
$17,321
Texas:
$24,740
(% of AGI for various income ranges: 6.9% for AGIs below $25k, 14.7% for AGIs $25k-50k, 107.6% for AGIs $50k-75k, 227.3% for AGIs $100k-200k, 358.0% for AGIs over 200k)
Self-employed (Keogh) retirement plans: $11,300 (reported on 0.5% of returns)
78721:
$11,300
Texas:
$29,298
(% of AGI for various income ranges: 24.6% for AGIs $25k-50k)
Total itemized deductions: $22,711 (reported on 9.4% of returns)
Here:
$22,711
State:
$40,428
(% of AGI for various income ranges: 35.5% for AGIs below $25k, 65.0% for AGIs $25k-50k, 247.3% for AGIs $50k-75k, 518.9% for AGIs $75k-100k, 982.7% for AGIs $100k-200k, 3436.0% for AGIs over 200k)
Charity contributions: $4,219 (reported on 5.9% of returns)
Here:
$4,219
State:
$18,201
(% of AGI for various income ranges: 10.2% for AGIs $25k-50k, 17.9% for AGIs $50k-75k, 39.7% for AGIs $75k-100k, 87.3% for AGIs $100k-200k, 709.0% for AGIs over 200k)
Taxes paid: $7,852 (reported on 9.2% of returns)
78721:
$7,852
State:
$7,821
(% of AGI for various income ranges: 29.6% for AGIs $25k-50k, 77.1% for AGIs $50k-75k, 192.3% for AGIs $75k-100k, 367.3% for AGIs $100k-200k, 1075.0% for AGIs over 200k)
Earned income credit: $2,342 (reported on 19.8% of returns)
Here:
$2,342
State:
$2,584
(% of AGI for various income ranges: 124.7% for AGIs below $25k, 64.5% for AGIs $25k-50k)
Percentage of individuals using paid preparers for their 2020 taxes: 93.1%
Here:
93%
State:
92%
(% for various income ranges: 90.8% for AGIs below $25k, 93.0% for AGIs $25k-50k, 92.7% for AGIs $50k-75k, 94.1% for AGIs $75k-100k, 97.4% for AGIs $100k-200k, 96.6% for AGIs over 200k)
Averages for the 2012 tax year for zip code 78721, filed in 2013:
Average Adjusted Gross Income (AGI) in 2012: $28,133 (Individual Income Tax Returns)
Here:
$28,133
State:
$65,384
Salary/wage: $26,708 (reported on 86.6% of returns)
Here:
$26,708
State:
$52,524
(% of AGI for various income ranges: 78.2% for AGIs below $25k, 87.5% for AGIs $25k-50k, 84.2% for AGIs $50k-75k, 85.5% for AGIs $75k-100k, 63.7% for AGIs $100k-200k)
Taxable interest for individuals: $283 (reported on 11.6% of returns)
This zip code:
$283
Texas:
$2,372
(% of AGI for various income ranges: 0.1% for AGIs $25k-50k, 0.2% for AGIs $50k-75k, 0.2% for AGIs $100k-200k)
Ordinary dividends: $3,184 (reported on 4.8% of returns)
Here:
$3,184
State:
$9,721
(% of AGI for various income ranges: 1.0% for AGIs below $25k, 0.2% for AGIs $25k-50k, 0.7% for AGIs $50k-75k, 0.4% for AGIs $75k-100k, 0.7% for AGIs $100k-200k)
Net capital gain/loss in AGI: +$3,867 (reported on 3.5% of returns)
Here:
+$3,867
State:
+$35,319
(% of AGI for various income ranges: 0.3% for AGIs $25k-50k, 0.5% for AGIs $50k-75k, 2.7% for AGIs $100k-200k)
Profit/loss from business: +$10,440 (reported on 17.1% of returns)
Here:
+$10,440
State:
+$13,732
(% of AGI for various income ranges: 12.8% for AGIs below $25k, 4.0% for AGIs $25k-50k, 2.4% for AGIs $50k-75k, 3.1% for AGIs $75k-100k, 7.9% for AGIs $100k-200k)
Taxable individual retirement arrangement distribution: $6,875 (reported on 2.3% of returns)
78721:
$6,875
Texas:
$19,511
(% of AGI for various income ranges: 0.4% for AGIs below $25k, 0.5% for AGIs $25k-50k, 1.4% for AGIs $50k-75k)
Total itemized deductions: $13,476 (26% of AGI, reported on 10.7% of returns)
Here:
$13,476
State:
$24,724
Here:
25.5% of AGI
State:
15.9% of AGI
(% of AGI for various income ranges: 2.2% for AGIs below $25k, 5.3% for AGIs $25k-50k, 7.0% for AGIs $50k-75k, 7.3% for AGIs $75k-100k, 7.5% for AGIs $100k-200k)
Charity contributions: $2,452 (reported on 6.0% of returns)
Here:
$2,452
State:
$6,808
(% of AGI for various income ranges: 0.2% for AGIs below $25k, 0.5% for AGIs $25k-50k, 0.7% for AGIs $50k-75k, 0.9% for AGIs $75k-100k, 1.1% for AGIs $100k-200k)
Taxes paid: $4,317 (reported on 10.3% of returns)
78721:
$4,317
State:
$6,921
(% of AGI for various income ranges: 0.6% for AGIs below $25k, 1.6% for AGIs $25k-50k, 2.2% for AGIs $50k-75k, 2.4% for AGIs $75k-100k, 2.6% for AGIs $100k-200k)
Earned income credit: $2,437 (reported on 36.8% of returns)
Here:
$2,437
State:
$2,570
(% of AGI for various income ranges: 9.8% for AGIs below $25k, 1.6% for AGIs $25k-50k)
Percentage of individuals using paid preparers for their 2012 taxes: 36.4%
Here:
36%
State:
51%
(% for various income ranges: 37.3% for AGIs below $25k, 34.5% for AGIs $25k-50k, 39.0% for AGIs $50k-75k, 28.6% for AGIs $75k-100k, 44.4% for AGIs $100k-200k)
Averages for the 2004 tax year for zip code 78721, filed in 2005:
Average Adjusted Gross Income (AGI) in 2004: $21,434 (Individual Income Tax Returns)
Here:
$21,434
State:
$47,881
Salary/wage: $20,193 (reported on 88.0% of returns)
Here:
$20,193
State:
$41,947
(% of AGI for various income ranges: 86.1% for AGIs below $10k, 85.3% for AGIs $10k-25k, 85.6% for AGIs $25k-50k, 77.2% for AGIs $50k-75k, 99.3% for AGIs $75k-100k)
Taxable interest for individuals: $383 (reported on 12.3% of returns)
This zip code:
$383
Texas:
$2,255
(% of AGI for various income ranges: 0.6% for AGIs below $10k, 0.2% for AGIs $10k-25k, 0.2% for AGIs $25k-50k, 0.2% for AGIs $50k-75k, 0.7% for AGIs $75k-100k)
Taxable dividends: $441 (reported on 2.5% of returns)
Here:
$441
State:
$4,261
(% of AGI for various income ranges: 0.3% for AGIs below $10k, 0.0% for AGIs $10k-25k, 0.0% for AGIs $25k-50k, 0.1% for AGIs $50k-75k)
Profit/loss from business: +$7,161 (reported on 10.2% of returns)
Here:
+$7,161
State:
+$11,013
(% of AGI for various income ranges: 9.0% for AGIs below $10k, 4.9% for AGIs $10k-25k, 2.4% for AGIs $25k-50k, 1.5% for AGIs $50k-75k)
IRA payment deduction: $2,000 (reported on 0.6% of returns)
78721:
$2,000
Texas:
$3,120
Total itemized deductions: $12,502 (31% of AGI, reported on 7.2% of returns)
Here:
$12,502
State:
$19,631
Here:
30.6% of AGI
State:
18.9% of AGI
(% of AGI for various income ranges: 2.6% for AGIs below $10k, 2.2% for AGIs $10k-25k, 4.5% for AGIs $25k-50k, 6.8% for AGIs $50k-75k, 16.3% for AGIs $75k-100k)
Charity contributions deductions: $3,474 (8% of AGI, reported on 5.1% of returns)
Here:
$3,474
State:
$4,753
Here:
8.1% of AGI
State:
4.2% of AGI
(% of AGI for various income ranges: 0.3% for AGIs $10k-25k, 0.8% for AGIs $25k-50k, 1.9% for AGIs $50k-75k, 4.3% for AGIs $75k-100k)
Total tax: $2,251 (reported on 50.9% of returns)
78721:
$2,251
State:
$9,058
(% of AGI for various income ranges: 1.9% for AGIs below $10k, 2.8% for AGIs $10k-25k, 5.6% for AGIs $25k-50k, 8.8% for AGIs $50k-75k, 12.1% for AGIs $75k-100k, 18.6% for AGIs over 100k)
Earned income credit: $2,061 (reported on 45.6% of returns)
Here:
$2,061
State:
$2,024
Percentage of individuals using paid preparers for their 2004 taxes: 64.5%
Here:
65%
State:
57%
(% for various income ranges: 62.8% for AGIs below $10k, 69.4% for AGIs $10k-25k, 60.8% for AGIs $25k-50k, 57.1% for AGIs $50k-75k, 69.2% for AGIs $75k-100k)
Likely homosexual households (counted as self-reported same-sex unmarried-partner households)
Lesbian couples: 0.8% of all households
Gay men: 0.2% of all households
Household received Food Stamps/SNAP in the past 12 months: 690 Household did not receive Food Stamps/SNAP in the past 12 months: 3,794
Women who had a birth in the past 12 months: 135 (105 now married, 30 unmarried) Women who did not have a birth in the past 12 months: 3,166 (1,120 now married, 2,054 unmarried)
Housing units in zip code 78721 with a mortgage: 1,578 (76 second mortgage, 77 both second mortgage and home equity loan) Houses without a mortgage: 44
Median monthly owner costs for units with a mortgage: $2,316 Median monthly owner costs for units without a mortgage: $692
Residents with income below the poverty level in 2022:
This zip code:
18.4%
Whole state:
14.0%
Residents with income below 50% of the poverty level in 2022:
This zip code:
11.7%
Whole state:
7.4%
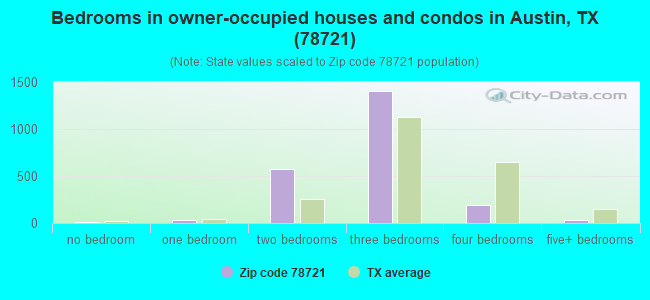
Median number of rooms in houses and condos:
Here:
5.0
State:
6.3
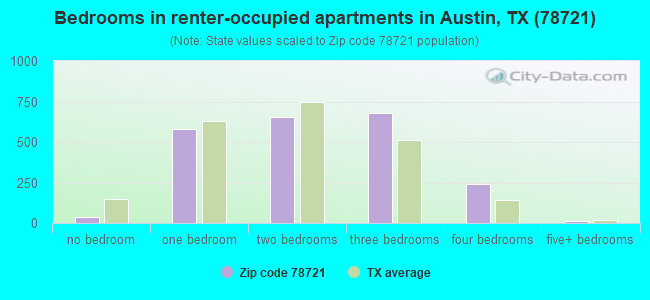
Median number of rooms in apartments:
Here:
4.3
State:
4.0
Notable locations in this zip code not listed on our city pages
Notable locations in zip code 78721: Austin Fire Department Station 5 (A), MetroCare Services Austin (B), American Medical Response of Texas (C), Austin / Travis County Emergency Medical Service - Medic 04 (D). Display/hide their locations on the map
Churches in zip code 78721 include: Bethlehem Apostolic Church (A), Greater Mount Moriah Primative Baptist Church (B), Greater Galilee Baptist Church (C), Webberville Baptist Church (D), United Missionary Baptist Church (E), True Vine Baptist Church (F), True Light Missionary Baptist Church (G), Solid Rock Baptist Church (H), Saint Johns Progressive Baptist Church (I). Display/hide their locations on the map
782 married couples with children.
829 single-parent households (101 men, 728 women).
67.4% of residents of 78721 zip code speak English at home.
28.4% of residents speak Spanish at home (65% very well, 13% well, 16% not well, 6% not at all).
2.9% of residents speak other Indo-European language at home (100% very well).
0.8% of residents speak Asian or Pacific Island language at home (93% very well, 7% well).
0.1% of residents speak other language at home (100% very well).
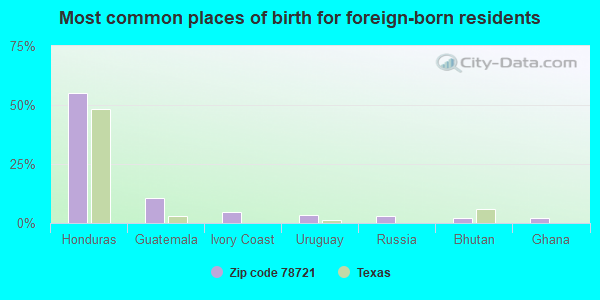
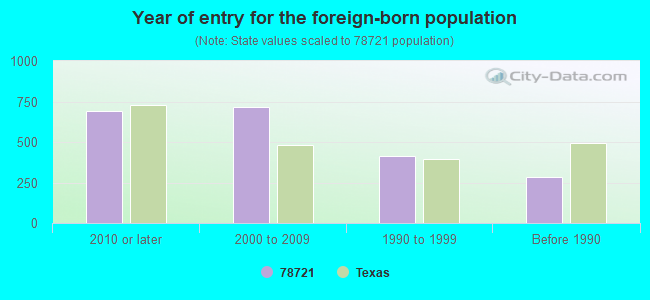
Foreign born population: 1,813 (16.9%) (27.8% of them are naturalized citizens)
Facilities with environmental interests located in this zip code:
4511 SPRINGDALE VENTURE (4511 SPRINGDALE RD in AUSTIN, TX)
(Integrated Compliance Information System) - ICIS-06-1998-0132, FORMAL ENFORCEMENT ACTION, ICIS-06-1998-0156, Business SIC classification: GENERAL CONTRACTORS-NONRESIDENTIAL BUILDINGS, OTHER THAN INDUSTRIAL BUILDINGS AND WAREHOUSES
AUSTIN READY MIX (1001 ED BLUESTEIN BLVD. in AUSTIN, TX)
COMPLIANCE ACTIVITY (Tracking inspections of insecticide, fungicide, and rodenticide, and toxic substances) National Pollutant Discharge Elimination System NON-MAJOR (Tracking pollutant discharge elimination systems) - permit Business SIC classification: CRUSHED AND BROKEN LIMESTONE; READY-MIXED CONCRETE; BRICK, STONE, AND RELATED CONSTRUCTION MATERIALS Organizations: CAPITOL AGGREGATES LTD (CONTACT/OWNER)
, CAPITOL AGGREGATES, LTD (CONTACT/OWNER)
Alternative names: CAPITOL AGGREGATES INC
AUSTIN ISD (1112 ARTHUR STILES RD in AUSTIN, TX)
(Resource Conservation and Recovery Act (tracking hazardous waste)) Alternative names: JOHNSTON HIGH SCHOOL
AUSTIN TERMINAL (1150 JAIN LN in AUSTIN, TX)
(Resource Conservation and Recovery Act (tracking hazardous waste)) Organizations: COASTAL STATES CRUDE GATHERING (CONTACT/OPERATOR)
Alternative names: COASTAL STATES AUSTIN TERM
Housing units lacking complete plumbing facilities: 0.9% Housing units lacking complete kitchen facilities: 1.4%
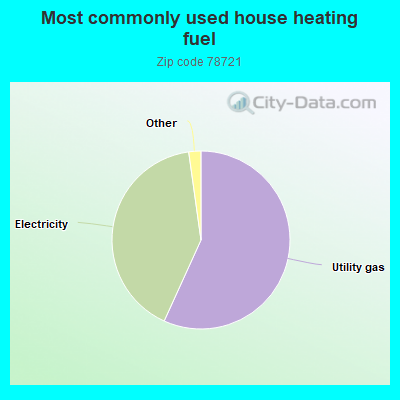
56.8%Utility gas
41.0%Electricity
0.8%Solar energy
0.8%No fuel used
0.7%Bottled, tank, or LP gas
Population in 1990: 9,091. Population change in the 1990s: +1,033 (+11.4%).
Place of birth for U.S.-born residents:
This state: 5,659
Northeast: 523
Midwest: 944
South: 677
West: 841
58% of the 78721 zip code residents lived in the same house 5 years ago. Out of people who lived in different houses, 81% lived in this county. Out of people who lived in different counties, 50% lived in Texas.
81% of the 78721 zip code residents lived in the same house 1 year ago. Out of people who lived in different houses, 60% moved from this county. Out of people who lived in different houses, 12% moved from different county within same state. Out of people who lived in different houses, 23% moved from different state. Out of people who lived in different houses, 3% moved from abroad.
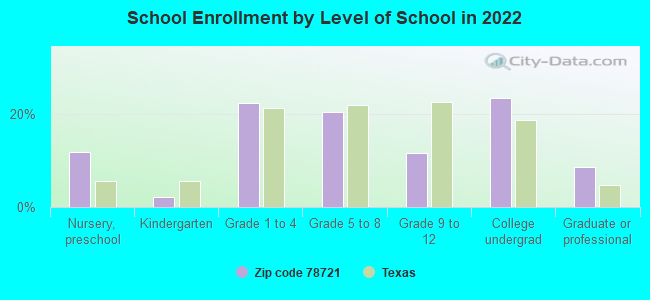
Private vs. public school enrollment:
Students in private schools in grades 1 to 8 (elementary and middle school): 220
Here:
22.9%
Texas:
8.8%
Students in private schools in grades 9 to 12 (high school):
Here:
0.0%
Texas:
8.0%
Students in private undergraduate colleges: 12
Here:
2.5%
Texas:
16.2%
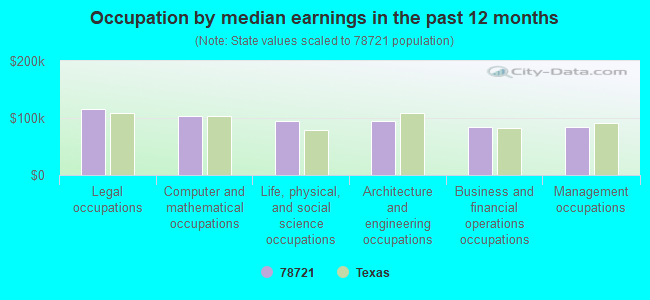
Occupation by median earnings in the past 12 months ($)
115,558Legal occupations
103,082Computer and mathematical occupations
94,963Life, physical, and social science occupations
94,600Architecture and engineering occupations
84,425Business and financial operations occupations
83,602Management occupations
Companies with federal contracts located in this zip code:
TEXAS LINEN COMPANY LTD (1307 SMITH RD in AUSTIN, TX) : $279,543 in 5 contractsfrom 2004 to 2005
Contracts for Laundry and DryCleaning Services by Navy Signed by year:2000: $0; 2001: $0; 2002: $0; 2003: $0; 2004: $39,717; 2005: $239,826; 2006: $0.
Biggest contracts:
$142,463 with Navy for Laundry and DryCleaning Services. Signed on 2005-02-04. Completion date: 2005-09-30.
$113,800, same as above.Signed on 2005-02-22. Completion date: 2005-09-30.
$39,717, same as above.Signed on 2004-10-27. Completion date: 2004-12-31.
$2,897, same as above.Signed on 2005-01-26. Completion date: 2005-09-30.
Top industries in this zip code by the number of employees in 2005:
Other Services (except Public Administration): Linen Supply (100-249 employees: 1 establishment)
Wholesale Trade: General Line Grocery Merchant Wholesalers (100-249: 1)
Administrative and Support and Waste Management and Remediation Services: Armored Car Services (50-99: 1, 10-19: 1, 5-9: 1)
Other Services (except Public Administration): Industrial Launderers (50-99: 1)
Other Services (except Public Administration): Religious Organizations (20-49: 1, 10-19: 1, 5-9: 3, 1-4: 1)
Wholesale Trade: Other Electronic Parts and Equipment Merchant Wholesalers (20-49: 1, 10-19: 1)
People in group quarters in 2010:
56 people in emergency and transitional shelters (with sleeping facilities) for people experiencing homelessness
53 people in nursing facilities/skilled-nursing facilities
34 people in group homes intended for adults
People in group quarters in 2000:
51 people in other noninstitutional group quarters
46 people in nursing homes
3 people in homes for the mentally retarded
Fatal accident statistics in 2014:
Fatal accident count: 1
Vehicles involved in fatal accidents: 2
Fatal accidents caused by drunken drivers: 0
Fatalities: 1
Persons involved in fatal accidents: 2
Pedestrians involved in fatal accidents: 0
Fatal accident statistics in 2013:
Fatal accident count: 3
Vehicles involved in fatal accidents: 5
Fatal accidents caused by drunken drivers: 2
Fatalities: 4
Persons involved in fatal accidents: 5
Pedestrians involved in fatal accidents: 0
Home Mortgage Disclosure Act Aggregated Statistics For Year 2009 (Based on 1 full and 4 partial tracts)
A) FHA, FSA/RHS & VA Home Purchase Loans
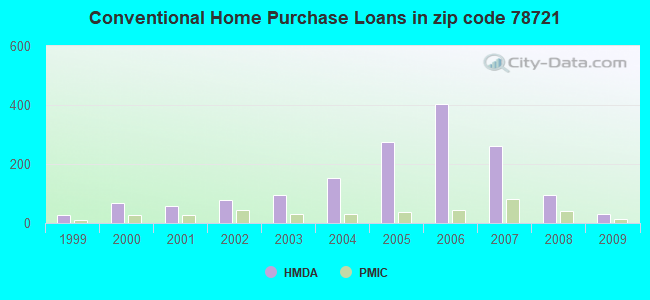
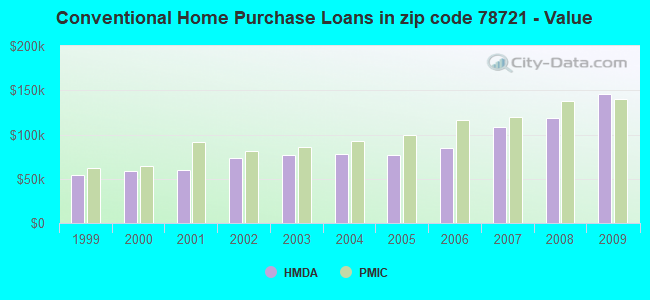
B) Conventional Home Purchase Loans
C) Refinancings
D) Home Improvement Loans
F) Non-occupant Loans on < 5 Family Dwellings (A B C & D)
Number
Average Value
Number
Average Value
Number
Average Value
Number
Average Value
Number
Average Value
LOANS ORIGINATED
79
$140,453
30
$145,915
99
$115,884
9
$65,586
23
$121,210
APPLICATIONS APPROVED, NOT ACCEPTED
3
$104,737
4
$71,782
18
$118,967
6
$8,133
3
$138,653
APPLICATIONS DENIED
9
$132,844
19
$107,524
65
$101,368
33
$41,853
17
$101,161
APPLICATIONS WITHDRAWN
10
$126,124
10
$187,192
31
$104,469
5
$129,004
8
$114,346
FILES CLOSED FOR INCOMPLETENESS
2
$160,120
0
$0
10
$101,453
9
$44,950
2
$81,330
Aggregated Statistics For Year 2008 (Based on 1 full and 4 partial tracts)
A) FHA, FSA/RHS & VA Home Purchase Loans
B) Conventional Home Purchase Loans
C) Refinancings
D) Home Improvement Loans
E) Loans on Dwellings For 5+ Families
F) Non-occupant Loans on < 5 Family Dwellings (A B C & D)
G) Loans On Manufactured Home Dwelling (A B C & D)
Number
Average Value
Number
Average Value
Number
Average Value
Number
Average Value
Number
Average Value
Number
Average Value
Number
Average Value
LOANS ORIGINATED
38
$143,014
94
$118,443
82
$102,875
24
$39,744
1
$11,207,000
48
$100,316
2
$45,750
APPLICATIONS APPROVED, NOT ACCEPTED
1
$84,060
7
$92,017
20
$114,267
6
$29,683
0
$0
2
$131,000
4
$42,842
APPLICATIONS DENIED
5
$130,054
53
$100,349
125
$109,512
61
$39,812
0
$0
42
$128,956
6
$59,650
APPLICATIONS WITHDRAWN
7
$137,756
9
$167,394
37
$118,503
9
$14,569
0
$0
10
$123,996
0
$0
FILES CLOSED FOR INCOMPLETENESS
3
$147,193
4
$196,248
11
$94,220
6
$63,558
0
$0
3
$68,100
0
$0
Aggregated Statistics For Year 2007 (Based on 1 full and 4 partial tracts)
A) FHA, FSA/RHS & VA Home Purchase Loans
B) Conventional Home Purchase Loans
C) Refinancings
D) Home Improvement Loans
F) Non-occupant Loans on < 5 Family Dwellings (A B C & D)
G) Loans On Manufactured Home Dwelling (A B C & D)
Number
Average Value
Number
Average Value
Number
Average Value
Number
Average Value
Number
Average Value
Number
Average Value
LOANS ORIGINATED
8
$103,758
261
$108,822
104
$96,555
38
$57,364
170
$105,088
1
$50,910
APPLICATIONS APPROVED, NOT ACCEPTED
2
$133,225
35
$117,419
27
$74,909
3
$12,420
19
$107,620
6
$52,710
APPLICATIONS DENIED
7
$131,349
82
$94,383
176
$92,204
89
$34,786
51
$99,589
8
$71,904
APPLICATIONS WITHDRAWN
3
$147,783
35
$95,351
75
$90,188
11
$56,158
26
$79,341
0
$0
FILES CLOSED FOR INCOMPLETENESS
1
$145,000
13
$76,874
20
$105,165
1
$20,000
9
$83,354
0
$0
Aggregated Statistics For Year 2006 (Based on 1 full and 4 partial tracts)
A) FHA, FSA/RHS & VA Home Purchase Loans
B) Conventional Home Purchase Loans
C) Refinancings
D) Home Improvement Loans
F) Non-occupant Loans on < 5 Family Dwellings (A B C & D)
G) Loans On Manufactured Home Dwelling (A B C & D)
Number
Average Value
Number
Average Value
Number
Average Value
Number
Average Value
Number
Average Value
Number
Average Value
LOANS ORIGINATED
44
$115,207
404
$85,147
167
$97,365
16
$51,424
247
$97,445
2
$44,445
APPLICATIONS APPROVED, NOT ACCEPTED
0
$0
61
$87,201
36
$74,987
5
$37,872
40
$103,781
2
$35,580
APPLICATIONS DENIED
1
$75,000
110
$76,483
256
$93,239
66
$32,893
97
$95,750
5
$82,646
APPLICATIONS WITHDRAWN
6
$110,112
64
$99,017
161
$85,487
11
$62,853
50
$90,136
0
$0
FILES CLOSED FOR INCOMPLETENESS
2
$106,000
18
$77,127
21
$87,390
0
$0
7
$87,581
0
$0
Aggregated Statistics For Year 2005 (Based on 1 full and 4 partial tracts)
A) FHA, FSA/RHS & VA Home Purchase Loans
B) Conventional Home Purchase Loans
C) Refinancings
D) Home Improvement Loans
F) Non-occupant Loans on < 5 Family Dwellings (A B C & D)
G) Loans On Manufactured Home Dwelling (A B C & D)
Number
Average Value
Number
Average Value
Number
Average Value
Number
Average Value
Number
Average Value
Number
Average Value
LOANS ORIGINATED
23
$99,466
275
$76,622
157
$78,676
40
$83,310
181
$85,769
5
$76,046
APPLICATIONS APPROVED, NOT ACCEPTED
1
$103,010
50
$74,060
43
$69,518
15
$60,795
24
$85,114
9
$30,859
APPLICATIONS DENIED
4
$83,098
102
$79,065
294
$77,350
73
$33,536
89
$72,123
13
$53,540
APPLICATIONS WITHDRAWN
4
$63,172
68
$84,557
126
$89,083
22
$157,328
22
$93,615
1
$28,000
FILES CLOSED FOR INCOMPLETENESS
1
$103,010
2
$144,860
79
$78,528
0
$0
11
$86,343
0
$0
Aggregated Statistics For Year 2004 (Based on 1 full and 4 partial tracts)
A) FHA, FSA/RHS & VA Home Purchase Loans
B) Conventional Home Purchase Loans
C) Refinancings
D) Home Improvement Loans
F) Non-occupant Loans on < 5 Family Dwellings (A B C & D)
G) Loans On Manufactured Home Dwelling (A B C & D)
Number
Average Value
Number
Average Value
Number
Average Value
Number
Average Value
Number
Average Value
Number
Average Value
LOANS ORIGINATED
22
$97,958
153
$78,031
219
$80,560
32
$37,577
120
$86,457
4
$79,505
APPLICATIONS APPROVED, NOT ACCEPTED
4
$85,882
47
$72,643
33
$72,247
1
$31,970
18
$75,521
9
$70,486
APPLICATIONS DENIED
8
$95,545
68
$59,377
333
$68,667
65
$26,231
50
$75,630
18
$38,656
APPLICATIONS WITHDRAWN
8
$78,022
31
$76,026
165
$81,391
6
$22,013
25
$82,486
3
$109,007
FILES CLOSED FOR INCOMPLETENESS
3
$86,980
12
$60,357
53
$70,335
0
$0
3
$60,330
0
$0
Aggregated Statistics For Year 2003 (Based on 1 full and 4 partial tracts)
A) FHA, FSA/RHS & VA Home Purchase Loans
B) Conventional Home Purchase Loans
C) Refinancings
D) Home Improvement Loans
F) Non-occupant Loans on < 5 Family Dwellings (A B C & D)
Number
Average Value
Number
Average Value
Number
Average Value
Number
Average Value
Number
Average Value
LOANS ORIGINATED
42
$93,336
94
$77,264
240
$70,072
18
$19,308
100
$78,560
APPLICATIONS APPROVED, NOT ACCEPTED
1
$68,000
23
$73,803
41
$57,795
7
$38,623
16
$71,199
APPLICATIONS DENIED
12
$101,512
93
$68,065
334
$67,191
33
$21,487
75
$79,465
APPLICATIONS WITHDRAWN
4
$81,845
27
$80,345
199
$67,558
4
$25,615
21
$78,891
FILES CLOSED FOR INCOMPLETENESS
0
$0
9
$95,006
15
$82,727
0
$0
4
$99,212
Aggregated Statistics For Year 2002 (Based on 1 full and 4 partial tracts)
A) FHA, FSA/RHS & VA Home Purchase Loans
B) Conventional Home Purchase Loans
C) Refinancings
D) Home Improvement Loans
F) Non-occupant Loans on < 5 Family Dwellings (A B C & D)
Number
Average Value
Number
Average Value
Number
Average Value
Number
Average Value
Number
Average Value
LOANS ORIGINATED
31
$86,766
78
$73,550
167
$64,914
27
$18,867
70
$71,624
APPLICATIONS APPROVED, NOT ACCEPTED
3
$131,600
35
$44,801
35
$56,051
9
$14,001
15
$63,174
APPLICATIONS DENIED
11
$88,195
85
$62,023
150
$60,986
75
$15,599
38
$67,528
APPLICATIONS WITHDRAWN
12
$83,018
14
$99,109
144
$62,381
6
$30,947
26
$82,591
FILES CLOSED FOR INCOMPLETENESS
3
$58,917
6
$75,253
22
$72,275
0
$0
3
$79,637
Aggregated Statistics For Year 2001 (Based on 1 full and 4 partial tracts)
A) FHA, FSA/RHS & VA Home Purchase Loans
B) Conventional Home Purchase Loans
C) Refinancings
D) Home Improvement Loans
E) Loans on Dwellings For 5+ Families
F) Non-occupant Loans on < 5 Family Dwellings (A B C & D)
Number
Average Value
Number
Average Value
Number
Average Value
Number
Average Value
Number
Average Value
Number
Average Value
LOANS ORIGINATED
44
$75,675
57
$59,957
125
$53,067
37
$12,901
1
$1,539,200
42
$55,219
APPLICATIONS APPROVED, NOT ACCEPTED
3
$93,757
33
$47,611
29
$59,697
6
$28,817
0
$0
9
$56,499
APPLICATIONS DENIED
8
$90,064
96
$49,566
113
$51,630
46
$16,443
0
$0
19
$54,655
APPLICATIONS WITHDRAWN
8
$92,054
23
$93,145
113
$51,964
17
$13,466
0
$0
17
$58,125
FILES CLOSED FOR INCOMPLETENESS
1
$47,360
5
$65,196
13
$58,232
0
$0
0
$0
3
$47,457
Aggregated Statistics For Year 2000 (Based on 1 full and 4 partial tracts)
A) FHA, FSA/RHS & VA Home Purchase Loans
B) Conventional Home Purchase Loans
C) Refinancings
D) Home Improvement Loans
E) Loans on Dwellings For 5+ Families
F) Non-occupant Loans on < 5 Family Dwellings (A B C & D)
Number
Average Value
Number
Average Value
Number
Average Value
Number
Average Value
Number
Average Value
Number
Average Value
LOANS ORIGINATED
55
$78,199
67
$58,217
63
$48,332
17
$22,118
0
$0
28
$48,480
APPLICATIONS APPROVED, NOT ACCEPTED
4
$62,038
16
$46,274
20
$32,197
6
$17,805
0
$0
6
$42,573
APPLICATIONS DENIED
22
$53,535
124
$49,098
70
$45,056
41
$15,659
1
$1,776,000
17
$37,671
APPLICATIONS WITHDRAWN
9
$69,329
20
$126,701
47
$44,796
4
$11,972
0
$0
7
$58,650
FILES CLOSED FOR INCOMPLETENESS
2
$69,470
3
$40,240
27
$56,193
0
$0
0
$0
5
$46,710
Aggregated Statistics For Year 1999 (Based on 1 full and 2 partial tracts)
A) FHA, FSA/RHS & VA Home Purchase Loans
B) Conventional Home Purchase Loans
C) Refinancings
D) Home Improvement Loans
F) Non-occupant Loans on < 5 Family Dwellings (A B C & D)
2002 - 2018 National Fire Incident Reporting System (NFIRS) incidents
Based on the data from the years 2002 - 2018 the average number of fire incidents per year is 54. The highest number of reported fires - 93 took place in 2011, and the least - 9 in 2017. The data has a dropping trend.
When looking into fire subcategories, the most incidents belonged to: Outside Fires (62.6%), and Structure Fires (20.8%).
Fire incident types reported to NFIRS in Zip Code 78721


 Nearest zip codes: 78702, 78723, 78742, 78722, 78712, 78741.


 Based on the data from the years 2002 - 2018 the average number of fire incidents per year is 54. The highest number of reported fires - 93 took place in 2011, and the least - 9 in 2017. The data has a dropping trend.
 When looking into fire subcategories, the most incidents belonged to: Outside Fires (62.6%), and Structure Fires (20.8%).