Estimated zip code population in 2022: 31,301 Zip code population in 2010: 28,736 Zip code population in 2000: 24,868
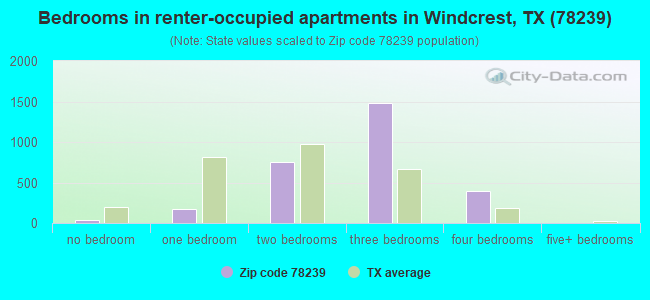
Houses and condos: 11,286 Renter-occupied apartments: 2,892
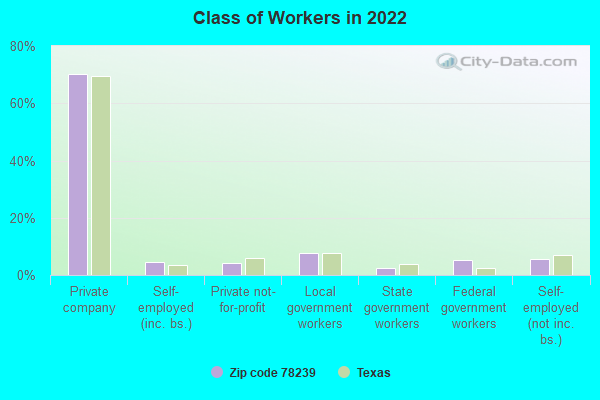
% of renters here:
27%
State:
38%
March 2022 cost of living index in zip code 78239: 87.8 (less than average, U.S. average is 100)
Land area: 6.6 sq. mi. Water area: 0.0 sq. mi.
Population density: 4,716 people per square mile
(average).
OSM Map
General Map
Google Map
MSN Map
OSM Map
General Map
Google Map
MSN Map
OSM Map
General Map
Google Map
MSN Map
OSM Map
General Map
Google Map
MSN Map
Please wait while loading the map...
Real estate property taxes paid for housing units in 2022:
This zip code:
1.4% ($3,284)
Texas:
1.5% ($4,050)
Median real estate property taxes paid for housing units with mortgages in 2022: $3,588 (1.5%) Median real estate property taxes paid for housing units with no mortgage in 2022: $2,865 (1.3%)
Averages for the 2020 tax year for zip code 78239, filed in 2021:
Average Adjusted Gross Income (AGI) in 2020: $49,327 (Individual Income Tax Returns)
Here:
$49,327
State:
$77,054
Salary/wage: $40,324 (reported on 77.2% of returns)
Here:
$40,324
State:
$62,766
(% of AGI for various income ranges: 1094.5% for AGIs below $25k, 3337.0% for AGIs $25k-50k, 5922.2% for AGIs $50k-75k, 7971.8% for AGIs $75k-100k, 12771.4% for AGIs $100k-200k, 40596.0% for AGIs over 200k)
Taxable interest for individuals: $1,873 (reported on 22.9% of returns)
This zip code:
$1,873
Texas:
$2,665
(% of AGI for various income ranges: 10.6% for AGIs below $25k, 16.4% for AGIs $25k-50k, 51.4% for AGIs $50k-75k, 109.3% for AGIs $75k-100k, 287.0% for AGIs $100k-200k, 2174.0% for AGIs over 200k)
Ordinary dividends: $7,252 (reported on 11.3% of returns)
Here:
$7,252
State:
$10,044
(% of AGI for various income ranges: 9.0% for AGIs below $25k, 14.7% for AGIs $25k-50k, 59.9% for AGIs $50k-75k, 167.4% for AGIs $75k-100k, 514.3% for AGIs $100k-200k, 8776.0% for AGIs over 200k)
Net capital gain/loss in AGI: +$13,146 (reported on 10.5% of returns)
Here:
+$13,146
State:
+$39,590
(% of AGI for various income ranges: 5.2% for AGIs below $25k, 9.8% for AGIs $25k-50k, 44.0% for AGIs $50k-75k, 185.7% for AGIs $75k-100k, 693.7% for AGIs $100k-200k, 22798.0% for AGIs over 200k)
Profit/loss from business: +$8,311 (reported on 17.6% of returns)
Here:
+$8,311
State:
+$10,888
(% of AGI for various income ranges: 159.4% for AGIs below $25k, 142.7% for AGIs $25k-50k, 175.1% for AGIs $50k-75k, 176.3% for AGIs $75k-100k, 393.6% for AGIs $100k-200k, 3852.0% for AGIs over 200k)
Taxable individual retirement arrangement distribution: $13,786 (reported on 7.7% of returns)
78239:
$13,786
Texas:
$24,740
(% of AGI for various income ranges: 28.0% for AGIs below $25k, 48.2% for AGIs $25k-50k, 152.7% for AGIs $50k-75k, 283.7% for AGIs $75k-100k, 582.8% for AGIs $100k-200k, 5752.0% for AGIs over 200k)
Self-employed (Keogh) retirement plans: $10,200 (reported on 0.1% of returns)
78239:
$10,200
Texas:
$29,298
(% of AGI for various income ranges: 12.6% for AGIs $50k-75k)
Total itemized deductions: $33,564 (reported on 4.6% of returns)
Here:
$33,564
State:
$40,428
(% of AGI for various income ranges: 24.8% for AGIs below $25k, 75.6% for AGIs $25k-50k, 261.7% for AGIs $50k-75k, 360.7% for AGIs $75k-100k, 953.1% for AGIs $100k-200k, 7002.0% for AGIs over 200k)
Charity contributions: $12,787 (reported on 3.7% of returns)
Here:
$12,787
State:
$18,201
(% of AGI for various income ranges: 2.4% for AGIs below $25k, 11.2% for AGIs $25k-50k, 53.6% for AGIs $50k-75k, 96.2% for AGIs $75k-100k, 323.8% for AGIs $100k-200k, 3974.0% for AGIs over 200k)
Taxes paid: $5,648 (reported on 4.3% of returns)
78239:
$5,648
State:
$7,821
(% of AGI for various income ranges: 3.7% for AGIs below $25k, 12.7% for AGIs $25k-50k, 49.0% for AGIs $50k-75k, 65.6% for AGIs $75k-100k, 147.4% for AGIs $100k-200k, 734.0% for AGIs over 200k)
Earned income credit: $2,505 (reported on 23.2% of returns)
Here:
$2,505
State:
$2,584
(% of AGI for various income ranges: 128.7% for AGIs below $25k, 84.2% for AGIs $25k-50k, 2.1% for AGIs $50k-75k)
Percentage of individuals using paid preparers for their 2020 taxes: 91.5%
Here:
91%
State:
92%
(% for various income ranges: 91.1% for AGIs below $25k, 92.7% for AGIs $25k-50k, 92.2% for AGIs $50k-75k, 90.2% for AGIs $75k-100k, 90.1% for AGIs $100k-200k, 85.7% for AGIs over 200k)
Averages for the 2012 tax year for zip code 78239, filed in 2013:
Average Adjusted Gross Income (AGI) in 2012: $43,953 (Individual Income Tax Returns)
Here:
$43,953
State:
$65,384
Salary/wage: $35,585 (reported on 78.5% of returns)
Here:
$35,585
State:
$52,524
(% of AGI for various income ranges: 77.2% for AGIs below $25k, 78.4% for AGIs $25k-50k, 66.9% for AGIs $50k-75k, 60.4% for AGIs $75k-100k, 50.4% for AGIs $100k-200k, 33.6% for AGIs over 200k)
Taxable interest for individuals: $1,944 (reported on 27.2% of returns)
This zip code:
$1,944
Texas:
$2,372
(% of AGI for various income ranges: 0.7% for AGIs below $25k, 0.6% for AGIs $25k-50k, 0.9% for AGIs $50k-75k, 1.4% for AGIs $75k-100k, 1.7% for AGIs $100k-200k, 2.9% for AGIs over 200k)
Ordinary dividends: $5,587 (reported on 13.9% of returns)
Here:
$5,587
State:
$9,721
(% of AGI for various income ranges: 0.8% for AGIs below $25k, 0.6% for AGIs $25k-50k, 1.1% for AGIs $50k-75k, 1.5% for AGIs $75k-100k, 3.2% for AGIs $100k-200k, 5.2% for AGIs over 200k)
Net capital gain/loss in AGI: +$3,269 (reported on 10.8% of returns)
Here:
+$3,269
State:
+$35,319
(% of AGI for various income ranges: 0.2% for AGIs $25k-50k, 0.1% for AGIs $50k-75k, 0.5% for AGIs $75k-100k, 1.5% for AGIs $100k-200k, 5.1% for AGIs over 200k)
Profit/loss from business: +$7,771 (reported on 15.3% of returns)
Here:
+$7,771
State:
+$13,732
(% of AGI for various income ranges: 8.8% for AGIs below $25k, 2.6% for AGIs $25k-50k, 1.3% for AGIs $50k-75k, 0.8% for AGIs $75k-100k, 1.7% for AGIs $100k-200k, 4.3% for AGIs over 200k)
Taxable individual retirement arrangement distribution: $10,860 (reported on 10.0% of returns)
78239:
$10,860
Texas:
$19,511
(% of AGI for various income ranges: 1.9% for AGIs below $25k, 1.6% for AGIs $25k-50k, 1.8% for AGIs $50k-75k, 2.7% for AGIs $75k-100k, 3.4% for AGIs $100k-200k, 4.6% for AGIs over 200k)
Self-employment retirement plans: $14,700 (reported on 0.1% of returns)
78239:
$14,700
Texas:
$23,938
Total itemized deductions: $20,474 (27% of AGI, reported on 20.2% of returns)
Here:
$20,474
State:
$24,724
Here:
26.6% of AGI
State:
15.9% of AGI
(% of AGI for various income ranges: 6.0% for AGIs below $25k, 7.9% for AGIs $25k-50k, 9.1% for AGIs $50k-75k, 9.7% for AGIs $75k-100k, 12.6% for AGIs $100k-200k, 9.2% for AGIs over 200k)
Charity contributions: $5,112 (reported on 15.6% of returns)
Here:
$5,112
State:
$6,808
(% of AGI for various income ranges: 0.6% for AGIs below $25k, 1.1% for AGIs $25k-50k, 1.5% for AGIs $50k-75k, 2.1% for AGIs $75k-100k, 2.7% for AGIs $100k-200k, 3.4% for AGIs over 200k)
Taxes paid: $4,246 (reported on 19.8% of returns)
78239:
$4,246
State:
$6,921
(% of AGI for various income ranges: 1.1% for AGIs below $25k, 1.8% for AGIs $25k-50k, 2.1% for AGIs $50k-75k, 2.0% for AGIs $75k-100k, 2.3% for AGIs $100k-200k, 1.7% for AGIs over 200k)
Earned income credit: $2,568 (reported on 26.5% of returns)
Here:
$2,568
State:
$2,570
(% of AGI for various income ranges: 9.6% for AGIs below $25k, 1.6% for AGIs $25k-50k)
Percentage of individuals using paid preparers for their 2012 taxes: 41.1%
Here:
41%
State:
51%
(% for various income ranges: 40.3% for AGIs below $25k, 39.2% for AGIs $25k-50k, 42.1% for AGIs $50k-75k, 39.8% for AGIs $75k-100k, 48.1% for AGIs $100k-200k, 66.7% for AGIs over 200k)
Averages for the 2004 tax year for zip code 78239, filed in 2005:
Average Adjusted Gross Income (AGI) in 2004: $38,680 (Individual Income Tax Returns)
Here:
$38,680
State:
$47,881
Salary/wage: $31,251 (reported on 77.5% of returns)
Here:
$31,251
State:
$41,947
(% of AGI for various income ranges: 154.8% for AGIs below $10k, 76.9% for AGIs $10k-25k, 73.7% for AGIs $25k-50k, 63.4% for AGIs $50k-75k, 54.6% for AGIs $75k-100k, 42.7% for AGIs over 100k)
Taxable interest for individuals: $2,569 (reported on 39.4% of returns)
This zip code:
$2,569
Texas:
$2,255
(% of AGI for various income ranges: 5.3% for AGIs below $10k, 2.0% for AGIs $10k-25k, 1.8% for AGIs $25k-50k, 2.3% for AGIs $50k-75k, 2.3% for AGIs $75k-100k, 4.2% for AGIs over 100k)
Taxable dividends: $3,541 (reported on 21.2% of returns)
Here:
$3,541
State:
$4,261
(% of AGI for various income ranges: 3.2% for AGIs below $10k, 0.9% for AGIs $10k-25k, 1.1% for AGIs $25k-50k, 1.3% for AGIs $50k-75k, 2.1% for AGIs $75k-100k, 3.8% for AGIs over 100k)
Net capital gain/loss: +$4,201 (reported on 17.2% of returns)
Here:
+$4,201
State:
+$16,110
(% of AGI for various income ranges: -0.3% for AGIs below $10k, -0.0% for AGIs $10k-25k, 0.3% for AGIs $25k-50k, 0.7% for AGIs $50k-75k, 1.3% for AGIs $75k-100k, 6.3% for AGIs over 100k)
Profit/loss from business: +$7,331 (reported on 13.4% of returns)
Here:
+$7,331
State:
+$11,013
(% of AGI for various income ranges: 4.8% for AGIs below $10k, 5.0% for AGIs $10k-25k, 1.7% for AGIs $25k-50k, 1.4% for AGIs $50k-75k, 1.0% for AGIs $75k-100k, 4.3% for AGIs over 100k)
IRA payment deduction: $3,039 (reported on 2.3% of returns)
78239:
$3,039
Texas:
$3,120
(% of AGI for various income ranges: 0.5% for AGIs below $10k, 0.1% for AGIs $10k-25k, 0.3% for AGIs $25k-50k, 0.1% for AGIs $50k-75k, 0.2% for AGIs $75k-100k, 0.2% for AGIs over 100k)
Self-employed pension: $8,944 (reported on 0.3% of returns)
Here:
$8,944
Texas:
$16,401
Total itemized deductions: $14,975 (22% of AGI, reported on 22.2% of returns)
Here:
$14,975
State:
$19,631
Here:
22.4% of AGI
State:
18.9% of AGI
(% of AGI for various income ranges: 11.4% for AGIs below $10k, 5.6% for AGIs $10k-25k, 8.4% for AGIs $25k-50k, 9.1% for AGIs $50k-75k, 9.7% for AGIs $75k-100k, 9.0% for AGIs over 100k)
Charity contributions deductions: $4,124 (6% of AGI, reported on 18.9% of returns)
Here:
$4,124
State:
$4,753
Here:
5.9% of AGI
State:
4.2% of AGI
(% of AGI for various income ranges: 0.9% for AGIs below $10k, 0.8% for AGIs $10k-25k, 1.4% for AGIs $25k-50k, 1.9% for AGIs $50k-75k, 2.8% for AGIs $75k-100k, 3.0% for AGIs over 100k)
Total tax: $5,380 (reported on 71.5% of returns)
78239:
$5,380
State:
$9,058
(% of AGI for various income ranges: 4.3% for AGIs below $10k, 3.6% for AGIs $10k-25k, 6.3% for AGIs $25k-50k, 9.4% for AGIs $50k-75k, 11.6% for AGIs $75k-100k, 16.9% for AGIs over 100k)
Earned income credit: $2,002 (reported on 23.0% of returns)
Here:
$2,002
State:
$2,024
Percentage of individuals using paid preparers for their 2004 taxes: 52.9%
Here:
53%
State:
57%
(% for various income ranges: 51.8% for AGIs below $10k, 56.6% for AGIs $10k-25k, 52.1% for AGIs $25k-50k, 50.8% for AGIs $50k-75k, 47.8% for AGIs $75k-100k, 55.2% for AGIs over 100k)
Likely homosexual households (counted as self-reported same-sex unmarried-partner households)
Lesbian couples: 0.5% of all households
Gay men: 0.0% of all households
Household received Food Stamps/SNAP in the past 12 months: 1,632 Household did not receive Food Stamps/SNAP in the past 12 months: 8,941
Women who had a birth in the past 12 months: 574 (291 now married, 276 unmarried) Women who did not have a birth in the past 12 months: 6,626 (2,395 now married, 4,247 unmarried)
Housing units in zip code 78239 with a mortgage: 4,836 (322 second mortgage, 290 both second mortgage and home equity loan) Houses without a mortgage: 37
Median monthly owner costs for units with a mortgage: $1,416 Median monthly owner costs for units without a mortgage: $595
Residents with income below the poverty level in 2022:
This zip code:
13.3%
Whole state:
14.0%
Residents with income below 50% of the poverty level in 2022:
This zip code:
7.6%
Whole state:
7.4%
Median number of rooms in houses and condos:
Here:
6.5
State:
6.3
Median number of rooms in apartments:
Here:
5.2
State:
4.0
Notable locations in this zip code not listed on our city pages
Notable locations in zip code 78239: San Antonio Raceway (A), Christian World Learning Center (B), Windcrest Volunteer Fire Department (C), Windcrest City Police Department (D), Camelot Volunteer Fire and Rescue (E). Display/hide their locations on the map
Churches in zip code 78239 include: Hosanna Lutheran Church (A), Holy Scripture Evangelical Lutheran Church (B), Iglesia de Dios Pentecostal Church (C), First Timothy Missionary Baptist Church (D), Harvest Hill Baptist Church (E), Windcrest Baptist Church (F), Abundant Life Church (G), Be Broken Ministries (H), Calvary Baptist Church (I). Display/hide their locations on the map
3,879 married couples with children.
2,197 single-parent households (771 men, 1,426 women).
67.8% of residents of 78239 zip code speak English at home.
28.1% of residents speak Spanish at home (65% very well, 21% well, 11% not well, 3% not at all).
1.1% of residents speak other Indo-European language at home (86% very well, 7% well, 7% not well).
2.9% of residents speak Asian or Pacific Island language at home (49% very well, 23% well, 28% not well).
0.1% of residents speak other language at home (100% very well).
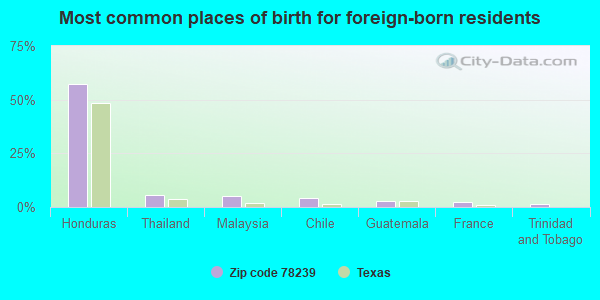
Foreign born population: 3,978 (12.7%) (45.4% of them are naturalized citizens)
This zip code:
12.7%
Whole state:
17.2%
57%Honduras
5%Thailand
5%Malaysia
4%Chile
3%Guatemala
2%France
2%Trinidad and Tobago
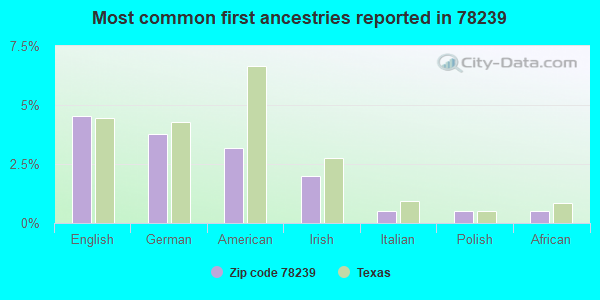
5%English
4%German
3%American
2%Irish
1%Italian
1%Polish
1%African
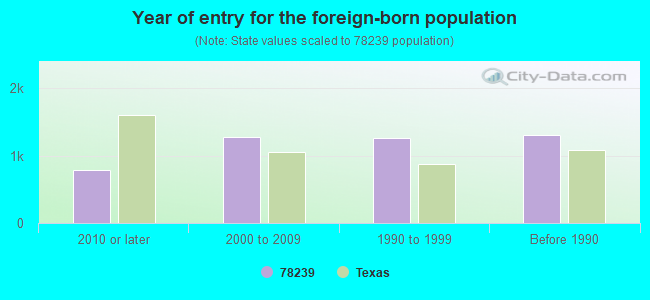
Year of entry for the foreign-born population
7792010 or later
1,2722000 to 2009
1,2531990 to 1999
1,311Before 1990
Facilities with environmental interests located in this zip code:
ALAMO BANK SUPPLY (6666 CRESTWAY UNIT 2 in SAN ANTONIO, TX)
(Resource Conservation and Recovery Act (tracking hazardous waste))
Housing units lacking complete plumbing facilities: 1.6% Housing units lacking complete kitchen facilities: 2.2%
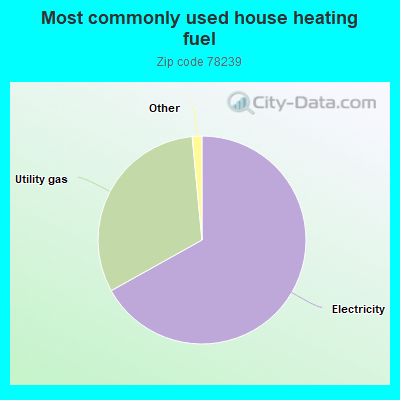
66.9%Electricity
31.6%Utility gas
Population in 1990: 21,781. Population change in the 1990s: +3,087 (+14.2%).
Place of birth for U.S.-born residents:
This state: 17,838
Northeast: 846
Midwest: 2,137
South: 3,097
West: 2,616
53% of the 78239 zip code residents lived in the same house 5 years ago. Out of people who lived in different houses, 67% lived in this county. Out of people who lived in different counties, 50% lived in Texas.
91% of the 78239 zip code residents lived in the same house 1 year ago. Out of people who lived in different houses, 60% moved from this county. Out of people who lived in different houses, 26% moved from different county within same state. Out of people who lived in different houses, 13% moved from different state. Out of people who lived in different houses, 1% moved from abroad.
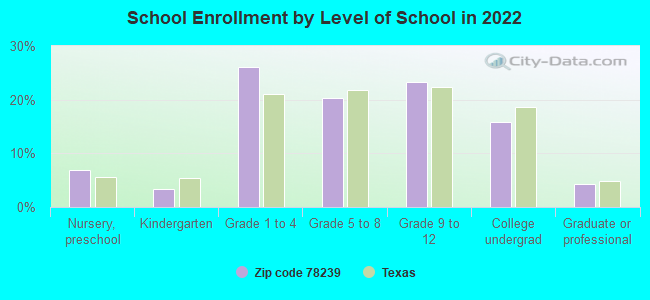
Private vs. public school enrollment:
Students in private schools in grades 1 to 8 (elementary and middle school): 91
Here:
2.6%
Texas:
8.8%
Students in private schools in grades 9 to 12 (high school): 103
Here:
5.7%
Texas:
8.0%
Students in private undergraduate colleges: 295
Here:
23.9%
Texas:
16.2%
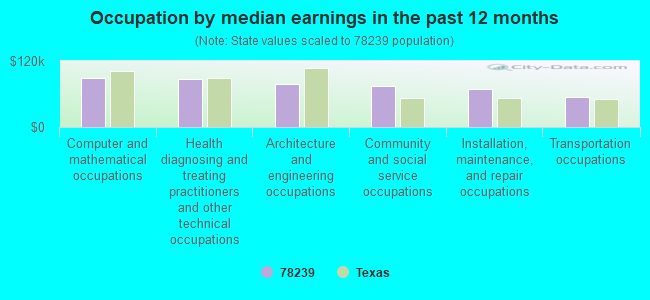
Occupation by median earnings in the past 12 months ($)
89,352Computer and mathematical occupations
86,537Health diagnosing and treating practitioners and other technical occupations
78,852Architecture and engineering occupations
74,009Community and social service occupations
68,308Installation, maintenance, and repair occupations
55,177Transportation occupations
Companies with biggest federal contracts located in this zip code:
BILLIE O STONE (6353 MONTGOMERY DRIVE in SAN ANTONIO, TX; small business) : $677,383 in 51 contractsfrom 2002 to 2006
Contracts for Installation of Equipment -- Special Industry Machinery, Modification of Equipment -- Furniture, General Photographic Services - Still, Maintenance, Repair and Rebuilding of Equipment -- Aircraft Components and Accessories, and moreby Air Force, Army Signed by year:2000: $0; 2001: $0; 2002: $42,295; 2003: $245,682; 2004: $112,501; 2005: $220,423; 2006: $56,482.
Biggest contracts:
$79,000 with Air Force for Installation of Equipment -- Special Industry Machinery. Signed on 2003-10-01. Completion date: 2003-12-31.
$71,003 with Army for Modification of Equipment -- Furniture. Signed on 2005-09-21. Completion date: 2005-10-21.
$49,868 with Air Force for General Photographic Services - Still. Signed on 2004-10-01. Completion date: 2005-09-30.
$48,776, same as above.Signed on 2003-10-01. Completion date: 2008-09-30.
TERESA L ARATA-MAIERS (6322 LAKEWOOD PARK in SAN ANTONIO, TX; small business) : $533,939 in 9 contractsfrom 1999 to 2005
Contracts for Psychiatry Services, Other Medical Services, Maintenance, Repair and Rebuilding of Equipment -- Medical, Dental, and Veterinary Equipment and Supplies by Army Signed by year:2000: $69,883; 2001: $69,883; 2002: $69,883; 2003: $82,800; 2004: $83,765; 2005: $87,842; 2006: $0.
Biggest contracts:
$87,842 with Army for Psychiatry Services. Signed on 2005-10-06. Completion date: 2004-09-30.
$85,284, same as above.Signed on 2004-10-06. Completion date: 2004-09-30.
$82,800, same as above.Signed on 2003-10-29. Completion date: 2004-09-30.
$69,883, same as above.Signed on 2002-10-22. Completion date: 2003-09-30.
JOHN W PENN (729 WINFIELD BLVD in WINDCREST, TX; small business) : $393,500 in 16 contractsfrom 2000 to 2005
Contracts for Other Defense -- Applied Research and Exploratory Development (R&D), Defense Aircraft -- Applied Research and Exploratory Development (R&D) by Air Force Signed by year:2000: $61,012; 2001: $63,962; 2002: $58,000; 2003: $50,000; 2004: $93,620; 2005: $66,906; 2006: $0.
Biggest contracts:
$61,012 with Air Force for Other Defense -- Applied Research and Exploratory Development (R&D). Signed on 2000-03-01. Completion date: 2000-12-30.
$58,000, same as above.Signed on 2002-02-28. Completion date: 2002-12-31.
$33,962, same as above.Signed on 2001-04-27. Completion date: 2001-12-31.
$30,000, same as above.Signed on 2004-03-03. Completion date: 2006-07-31.
SRVCO INC (8703 PINTAIL PT in SAN ANTONIO, TX; small business) : $266,607 in 15 contractsfrom 2004 to 2006
Contracts for Non-Food Items For Resale, Food Items For Resale by Defense Commissary Agency Signed by year:2000: $0; 2001: $0; 2002: $0; 2003: $0; 2004: $72,808; 2005: $175,712; 2006: $18,087.
Biggest contracts:
$41,031 with Defense Commissary Agency for Non-Food Items For Resale. Signed on 2004-10-01. Completion date: 2005-09-30.
$31,437 with Defense Commissary Agency for Food Items For Resale. Signed on 2005-04-01. Completion date: 2005-08-31.
$27,832 with Defense Commissary Agency for Non-Food Items For Resale. Signed on 2005-10-01. Completion date: 2005-12-31.
$26,423, same as above.Signed on 2005-04-01. Completion date: 2005-05-31.
SOOSAIPILLAI, MARINA (9142 WINDGARDEN in SAN ANTONIO, TX; small business)
$150,015 with Army for Radiology Services. Signed on 1999-10-14. Completion date: 2000-09-30.
SICORP, INC. (9310 NORTHBEND in SAN ANTONIO, TX; small business) : $149,072 in 3 contractsfrom 1999 to 2000
$59,355 with Army for Maintenance, Repair or Alteration of Real Property -- Other Conservation and Development Facilities. Signed on 1999-12-16. Completion date: 2000-01-15.
$45,181, same as above.Signed on 2000-02-12. Completion date: 2000-01-15.
$44,536 with Army for Maintenance, Repair or Alteration of Real Property -- Miscellaneous Buildings. Signed on 2000-06-01. Completion date: 2000-07-01.
ALAN J MAIERS (6322 LAKEWOOD PARK in SAN ANTONIO, TX; small business) : $134,136 in 2 contractsfrom 1999 to 2000
$67,068 with Army for Other Medical Services. Signed on 2000-11-06. Completion date: 2003-09-30.
$67,068 with Army for Maintenance, Repair and Rebuilding of Equipment -- Medical, Dental, and Veterinary Equipment and Supplies. Signed on 1999-10-13. Completion date: 2000-09-30.
TEXAS LAWN CARE (7007 GLEN CLIFF in SAN ANTONIO, TX; small business) : $104,000 in 3 contractsin 2001
$62,400 with Army for Landscaping/Groundskeeping Services. Signed on 2001-12-27. Completion date: 2001-11-30.
$41,600, same as above.Signed on 2001-10-29. Completion date: 2001-11-30.
$0, same as above.Signed on 2001-12-27. Completion date: 2001-11-30.
KIDS SPORTS NETWORK INC (8206 ROUGHRIDER DR #104 in SAN ANTONIO, TX) : $94,373 in 3 contractsfrom 2000 to 2004
$66,509 with Air Force for Other Professional Services. Signed on 2000-10-26. Completion date: 2001-09-30.
$27,864 with Air Force for Program Management/Support Services. Signed on 2004-09-03. Completion date: 2005-09-02.
$0, same as above.Signed on 2004-09-03. Completion date: 2005-09-02.
JRFII, INC (8930 FOUR WINDS DRIVE in SAN ANTONIO, TX; small business)
$53,000 with Army for ADP Software. Signed on 2002-04-03. Completion date: 2002-04-05.
Top industries in this zip code by the number of employees in 2005:
Health Care and Social Assistance: Continuing Care Retirement Communities (250-499 employees: 1 establishment, 20-49 employees: 1 establishment, 1-4 employees: 1 establishment)
2002 - 2018 National Fire Incident Reporting System (NFIRS) incidents
Based on the data from the years 2002 - 2018 the average number of fires per year is 101. The highest number of reported fire incidents - 164 took place in 2006, and the least - 29 in 2014. The data has a rising trend.
When looking into fire subcategories, the most reports belonged to: Structure Fires (49.9%), and Outside Fires (31.0%).
Fire incident types reported to NFIRS in Zip Code 78239


 Nearest zip codes: 78233, 78218, 78244, 78217, 78148, 78219.


 Based on the data from the years 2002 - 2018 the average number of fires per year is 101. The highest number of reported fire incidents - 164 took place in 2006, and the least - 29 in 2014. The data has a rising trend.
 When looking into fire subcategories, the most reports belonged to: Structure Fires (49.9%), and Outside Fires (31.0%).