Estimated zip code population in 2022: 43,526 Zip code population in 2010: 39,089 Zip code population in 2000: 35,573
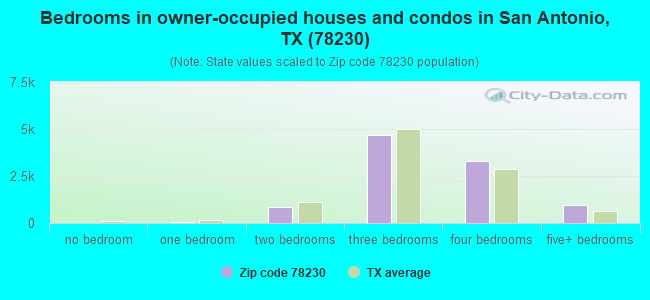
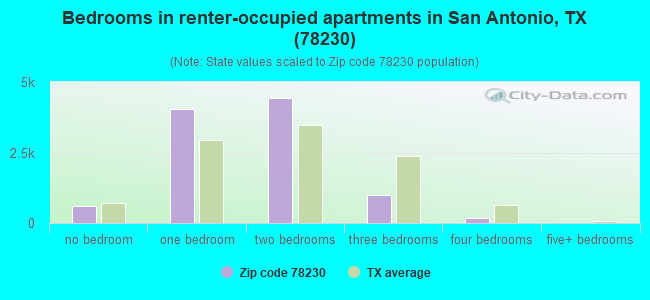
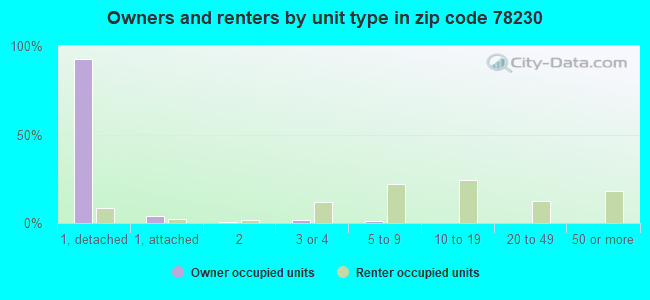
Houses and condos: 21,718 Renter-occupied apartments: 10,268
% of renters here:
51%
State:
38%
March 2022 cost of living index in zip code 78230: 89.5 (less than average, U.S. average is 100)
Land area: 10.4 sq. mi. Water area: 0.1 sq. mi.
Population density: 4,201 people per square mile
(average).
OSM Map
General Map
Google Map
MSN Map
OSM Map
General Map
Google Map
MSN Map
OSM Map
General Map
Google Map
MSN Map
OSM Map
General Map
Google Map
MSN Map
Please wait while loading the map...
Real estate property taxes paid for housing units in 2022:
This zip code:
1.7% ($6,277)
Texas:
1.5% ($4,050)
Median real estate property taxes paid for housing units with mortgages in 2022: $6,941 (1.8%) Median real estate property taxes paid for housing units with no mortgage in 2022: $5,780 (1.7%)
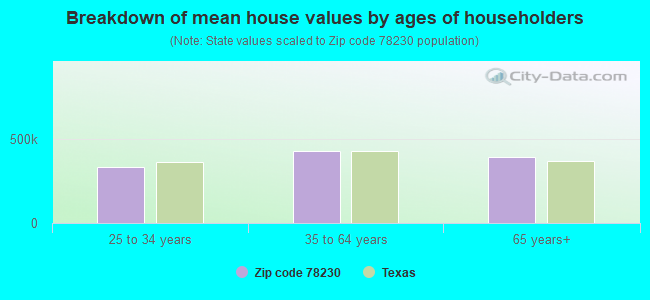
Estimated median house/condo value in 2022: $366,814
78230:
$366,814
Texas:
$275,400
According to our research of Texas and other state lists, there were 37 registered sex offenders living in 78230 zip code as of May 17, 2024. The ratio of all residents to sex offenders in zip code 78230 is 1,218 to 1. The ratio of registered sex offenders to all residents in this zip code is much lower than the state average.
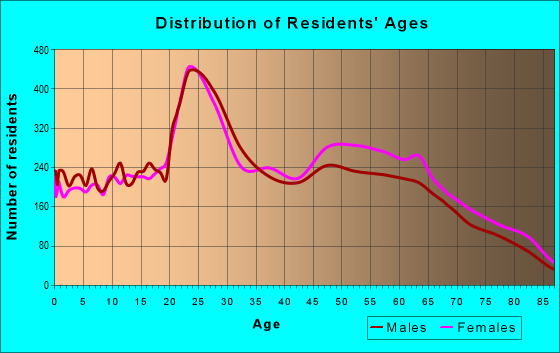
Median resident age:
This zip code:
38.6 years
Texas median age:
35.6 years
Average household size:
This zip code:
2.1 people
Texas:
2.6 people
Averages for the 2020 tax year for zip code 78230, filed in 2021:
Average Adjusted Gross Income (AGI) in 2020: $90,894 (Individual Income Tax Returns)
Here:
$90,894
State:
$77,054
Salary/wage: $66,605 (reported on 80.4% of returns)
Here:
$66,605
State:
$62,766
(% of AGI for various income ranges: 1155.1% for AGIs below $25k, 3506.8% for AGIs $25k-50k, 6232.2% for AGIs $50k-75k, 8778.2% for AGIs $75k-100k, 17251.8% for AGIs $100k-200k, 93747.6% for AGIs over 200k)
Taxable interest for individuals: $3,458 (reported on 30.4% of returns)
This zip code:
$3,458
Texas:
$2,665
(% of AGI for various income ranges: 17.0% for AGIs below $25k, 22.0% for AGIs $25k-50k, 63.8% for AGIs $50k-75k, 120.9% for AGIs $75k-100k, 255.6% for AGIs $100k-200k, 3078.7% for AGIs over 200k)
Ordinary dividends: $14,232 (reported on 21.0% of returns)
Here:
$14,232
State:
$10,044
(% of AGI for various income ranges: 19.6% for AGIs below $25k, 37.7% for AGIs $25k-50k, 117.3% for AGIs $50k-75k, 217.7% for AGIs $75k-100k, 606.0% for AGIs $100k-200k, 10322.2% for AGIs over 200k)
Net capital gain/loss in AGI: +$43,117 (reported on 20.0% of returns)
Here:
+$43,117
State:
+$39,590
(% of AGI for various income ranges: 8.5% for AGIs below $25k, 22.6% for AGIs $25k-50k, 68.0% for AGIs $50k-75k, 231.3% for AGIs $75k-100k, 929.4% for AGIs $100k-200k, 36372.7% for AGIs over 200k)
Profit/loss from business: +$16,231 (reported on 17.6% of returns)
Here:
+$16,231
State:
+$10,888
(% of AGI for various income ranges: 110.9% for AGIs below $25k, 84.0% for AGIs $25k-50k, 207.8% for AGIs $50k-75k, 302.4% for AGIs $75k-100k, 1005.2% for AGIs $100k-200k, 6205.3% for AGIs over 200k)
Taxable individual retirement arrangement distribution: $22,885 (reported on 9.6% of returns)
78230:
$22,885
Texas:
$24,740
(% of AGI for various income ranges: 41.2% for AGIs below $25k, 83.4% for AGIs $25k-50k, 184.2% for AGIs $50k-75k, 421.9% for AGIs $75k-100k, 1066.8% for AGIs $100k-200k, 3487.1% for AGIs over 200k)
Self-employed (Keogh) retirement plans: $28,281 (reported on 0.8% of returns)
78230:
$28,281
Texas:
$29,298
(% of AGI for various income ranges: 61.7% for AGIs $100k-200k, 798.7% for AGIs over 200k)
Total itemized deductions: $37,588 (reported on 9.0% of returns)
Here:
$37,588
State:
$40,428
(% of AGI for various income ranges: 46.6% for AGIs below $25k, 108.0% for AGIs $25k-50k, 257.8% for AGIs $50k-75k, 528.0% for AGIs $75k-100k, 1093.8% for AGIs $100k-200k, 8008.0% for AGIs over 200k)
Charity contributions: $16,150 (reported on 7.4% of returns)
Here:
$16,150
State:
$18,201
(% of AGI for various income ranges: 3.9% for AGIs below $25k, 17.5% for AGIs $25k-50k, 41.7% for AGIs $50k-75k, 105.4% for AGIs $75k-100k, 309.4% for AGIs $100k-200k, 3910.0% for AGIs over 200k)
Taxes paid: $8,144 (reported on 8.7% of returns)
78230:
$8,144
State:
$7,821
(% of AGI for various income ranges: 7.9% for AGIs below $25k, 23.2% for AGIs $25k-50k, 66.2% for AGIs $50k-75k, 136.8% for AGIs $75k-100k, 295.2% for AGIs $100k-200k, 1370.2% for AGIs over 200k)
Earned income credit: $2,089 (reported on 14.6% of returns)
Here:
$2,089
State:
$2,584
(% of AGI for various income ranges: 81.2% for AGIs below $25k, 50.6% for AGIs $25k-50k, 0.7% for AGIs $50k-75k)
Percentage of individuals using paid preparers for their 2020 taxes: 91.8%
Here:
92%
State:
92%
(% for various income ranges: 91.5% for AGIs below $25k, 93.9% for AGIs $25k-50k, 91.1% for AGIs $50k-75k, 89.9% for AGIs $75k-100k, 90.0% for AGIs $100k-200k, 92.0% for AGIs over 200k)
Averages for the 2012 tax year for zip code 78230, filed in 2013:
Average Adjusted Gross Income (AGI) in 2012: $78,469 (Individual Income Tax Returns)
Here:
$78,469
State:
$65,384
Salary/wage: $57,550 (reported on 82.2% of returns)
Here:
$57,550
State:
$52,524
(% of AGI for various income ranges: 80.6% for AGIs below $25k, 81.4% for AGIs $25k-50k, 69.8% for AGIs $50k-75k, 65.6% for AGIs $75k-100k, 65.9% for AGIs $100k-200k, 46.1% for AGIs over 200k)
Taxable interest for individuals: $4,057 (reported on 34.6% of returns)
This zip code:
$4,057
Texas:
$2,372
(% of AGI for various income ranges: 1.3% for AGIs below $25k, 0.8% for AGIs $25k-50k, 1.1% for AGIs $50k-75k, 1.3% for AGIs $75k-100k, 1.4% for AGIs $100k-200k, 2.5% for AGIs over 200k)
Ordinary dividends: $9,879 (reported on 21.8% of returns)
Here:
$9,879
State:
$9,721
(% of AGI for various income ranges: 1.8% for AGIs below $25k, 1.1% for AGIs $25k-50k, 1.7% for AGIs $50k-75k, 1.8% for AGIs $75k-100k, 2.5% for AGIs $100k-200k, 3.8% for AGIs over 200k)
Net capital gain/loss in AGI: +$19,898 (reported on 18.1% of returns)
Here:
+$19,898
State:
+$35,319
(% of AGI for various income ranges: 0.2% for AGIs $25k-50k, 0.4% for AGIs $50k-75k, 1.0% for AGIs $75k-100k, 1.9% for AGIs $100k-200k, 9.4% for AGIs over 200k)
Profit/loss from business: +$26,449 (reported on 16.9% of returns)
Here:
+$26,449
State:
+$13,732
(% of AGI for various income ranges: 7.4% for AGIs below $25k, 2.9% for AGIs $25k-50k, 3.0% for AGIs $50k-75k, 3.9% for AGIs $75k-100k, 4.9% for AGIs $100k-200k, 7.6% for AGIs over 200k)
Taxable individual retirement arrangement distribution: $21,705 (reported on 10.9% of returns)
78230:
$21,705
Texas:
$19,511
(% of AGI for various income ranges: 2.2% for AGIs below $25k, 1.7% for AGIs $25k-50k, 2.9% for AGIs $50k-75k, 3.6% for AGIs $75k-100k, 3.3% for AGIs $100k-200k, 3.2% for AGIs over 200k)
Self-employment retirement plans: $23,276 (reported on 1.0% of returns)
78230:
$23,276
Texas:
$23,938
(% of AGI for various income ranges: 0.3% for AGIs $75k-100k, 0.3% for AGIs $100k-200k, 0.5% for AGIs over 200k)
Total itemized deductions: $25,111 (14% of AGI, reported on 28.6% of returns)
Here:
$25,111
State:
$24,724
Here:
14.1% of AGI
State:
15.9% of AGI
(% of AGI for various income ranges: 8.1% for AGIs below $25k, 7.5% for AGIs $25k-50k, 10.5% for AGIs $50k-75k, 11.4% for AGIs $75k-100k, 11.3% for AGIs $100k-200k, 7.9% for AGIs over 200k)
Charity contributions: $6,869 (reported on 24.0% of returns)
Here:
$6,869
State:
$6,808
(% of AGI for various income ranges: 0.6% for AGIs below $25k, 0.8% for AGIs $25k-50k, 1.3% for AGIs $50k-75k, 1.9% for AGIs $75k-100k, 2.2% for AGIs $100k-200k, 2.8% for AGIs over 200k)
Taxes paid: $8,431 (reported on 28.1% of returns)
78230:
$8,431
State:
$6,921
(% of AGI for various income ranges: 2.2% for AGIs below $25k, 2.2% for AGIs $25k-50k, 3.0% for AGIs $50k-75k, 3.7% for AGIs $75k-100k, 4.0% for AGIs $100k-200k, 2.7% for AGIs over 200k)
Earned income credit: $2,060 (reported on 14.1% of returns)
Here:
$2,060
State:
$2,570
(% of AGI for various income ranges: 4.9% for AGIs below $25k, 0.7% for AGIs $25k-50k)
Percentage of individuals using paid preparers for their 2012 taxes: 43.4%
Here:
43%
State:
51%
(% for various income ranges: 37.0% for AGIs below $25k, 38.5% for AGIs $25k-50k, 44.7% for AGIs $50k-75k, 49.1% for AGIs $75k-100k, 52.1% for AGIs $100k-200k, 74.4% for AGIs over 200k)
Averages for the 2004 tax year for zip code 78230, filed in 2005:
Average Adjusted Gross Income (AGI) in 2004: $68,095 (Individual Income Tax Returns)
Here:
$68,095
State:
$47,881
Salary/wage: $56,259 (reported on 81.1% of returns)
Here:
$56,259
State:
$41,947
(% of AGI for various income ranges: 183.8% for AGIs below $10k, 79.2% for AGIs $10k-25k, 77.6% for AGIs $25k-50k, 68.5% for AGIs $50k-75k, 65.7% for AGIs $75k-100k, 62.2% for AGIs over 100k)
Taxable interest for individuals: $3,390 (reported on 46.3% of returns)
This zip code:
$3,390
Texas:
$2,255
(% of AGI for various income ranges: 15.1% for AGIs below $10k, 2.6% for AGIs $10k-25k, 1.8% for AGIs $25k-50k, 2.1% for AGIs $50k-75k, 2.4% for AGIs $75k-100k, 2.3% for AGIs over 100k)
Taxable dividends: $4,834 (reported on 29.1% of returns)
Here:
$4,834
State:
$4,261
(% of AGI for various income ranges: 11.0% for AGIs below $10k, 1.5% for AGIs $10k-25k, 1.3% for AGIs $25k-50k, 1.7% for AGIs $50k-75k, 1.8% for AGIs $75k-100k, 2.3% for AGIs over 100k)
Net capital gain/loss: +$14,267 (reported on 25.4% of returns)
Here:
+$14,267
State:
+$16,110
(% of AGI for various income ranges: -2.2% for AGIs below $10k, -0.3% for AGIs $10k-25k, 0.3% for AGIs $25k-50k, 1.1% for AGIs $50k-75k, 1.8% for AGIs $75k-100k, 8.4% for AGIs over 100k)
Profit/loss from business: +$19,220 (reported on 17.9% of returns)
Here:
+$19,220
State:
+$11,013
(% of AGI for various income ranges: -0.8% for AGIs below $10k, 5.3% for AGIs $10k-25k, 3.2% for AGIs $25k-50k, 3.6% for AGIs $50k-75k, 4.5% for AGIs $75k-100k, 5.9% for AGIs over 100k)
IRA payment deduction: $3,445 (reported on 3.2% of returns)
78230:
$3,445
Texas:
$3,120
(% of AGI for various income ranges: 0.3% for AGIs below $10k, 0.2% for AGIs $10k-25k, 0.3% for AGIs $25k-50k, 0.2% for AGIs $50k-75k, 0.2% for AGIs $75k-100k, 0.1% for AGIs over 100k)
Self-employed pension: $16,609 (reported on 1.6% of returns)
Here:
$16,609
Texas:
$16,401
(% of AGI for various income ranges: 0.4% for AGIs below $10k, 0.1% for AGIs $25k-50k, 0.1% for AGIs $50k-75k, 0.3% for AGIs $75k-100k, 0.6% for AGIs over 100k)
Total itemized deductions: $20,571 (16% of AGI, reported on 31.7% of returns)
Here:
$20,571
State:
$19,631
Here:
15.6% of AGI
State:
18.9% of AGI
(% of AGI for various income ranges: 21.3% for AGIs below $10k, 7.9% for AGIs $10k-25k, 9.5% for AGIs $25k-50k, 12.4% for AGIs $50k-75k, 13.2% for AGIs $75k-100k, 8.5% for AGIs over 100k)
Charity contributions deductions: $5,643 (4% of AGI, reported on 27.7% of returns)
Here:
$5,643
State:
$4,753
Here:
4.0% of AGI
State:
4.2% of AGI
(% of AGI for various income ranges: 1.0% for AGIs below $10k, 0.7% for AGIs $10k-25k, 1.2% for AGIs $25k-50k, 2.1% for AGIs $50k-75k, 2.3% for AGIs $75k-100k, 2.7% for AGIs over 100k)
Total tax: $15,070 (reported on 78.9% of returns)
78230:
$15,070
State:
$9,058
(% of AGI for various income ranges: 5.8% for AGIs below $10k, 4.5% for AGIs $10k-25k, 7.9% for AGIs $25k-50k, 10.4% for AGIs $50k-75k, 11.8% for AGIs $75k-100k, 23.2% for AGIs over 100k)
Earned income credit: $1,666 (reported on 12.3% of returns)
Here:
$1,666
State:
$2,024
Percentage of individuals using paid preparers for their 2004 taxes: 50.9%
Here:
51%
State:
57%
(% for various income ranges: 45.9% for AGIs below $10k, 51.2% for AGIs $10k-25k, 45.8% for AGIs $25k-50k, 50.0% for AGIs $50k-75k, 49.8% for AGIs $75k-100k, 66.1% for AGIs over 100k)
Likely homosexual households (counted as self-reported same-sex unmarried-partner households)
Lesbian couples: 0.1% of all households
Gay men: 0.4% of all households
Household received Food Stamps/SNAP in the past 12 months: 1,577 Household did not receive Food Stamps/SNAP in the past 12 months: 18,537
Women who had a birth in the past 12 months: 464 (430 now married, 39 unmarried) Women who did not have a birth in the past 12 months: 10,450 (3,374 now married, 7,114 unmarried)
Housing units in zip code 78230 with a mortgage: 4,896 (341 second mortgage, 271 both second mortgage and home equity loan) Houses without a mortgage: 65
Median monthly owner costs for units with a mortgage: $2,321 Median monthly owner costs for units without a mortgage: $858
Residents with income below the poverty level in 2022:
This zip code:
9.4%
Whole state:
14.0%
Residents with income below 50% of the poverty level in 2022:
This zip code:
4.6%
Whole state:
7.4%
Median number of rooms in houses and condos:
Here:
7.1
State:
6.3
Median number of rooms in apartments:
Here:
3.7
State:
4.0
Notable locations in this zip code not listed on our city pages
Notable locations in zip code 78230: Olga (A), Cornerstone Learning Center (B), Kindercare Learning Centers (C), Los Ninos Bilingual Daycare and Learning Center (D), Presentation Convent (E), San Antonio Fire Department Station 37 (F), Medix Healthcare (G). Display/hide their locations on the map
Churches in zip code 78230 include: Saint Andrew Church (A), Shenandoah Church of Christ (B), Our Savior Lutheran Church (C), Saint Andrew Presbyterian Church (D), Saint Chads Anglican Church (E), Saint Francis of Assisi Church (F), Saint Matthews Catholic Church (G), Colonial Hills Church (H), Christ Presbyterian Church (I). Display/hide their locations on the map
4,532 married couples with children.
2,200 single-parent households (478 men, 1,722 women).
66.0% of residents of 78230 zip code speak English at home.
29.1% of residents speak Spanish at home (75% very well, 16% well, 6% not well, 4% not at all).
1.4% of residents speak other Indo-European language at home (88% very well, 3% well, 10% not well).
2.1% of residents speak Asian or Pacific Island language at home (66% very well, 17% well, 16% not well, 1% not at all).
1.8% of residents speak other language at home (45% very well, 31% well, 24% not well).
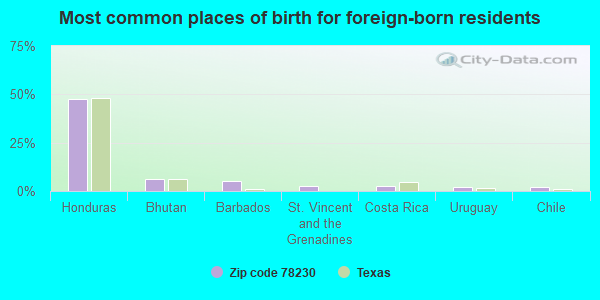
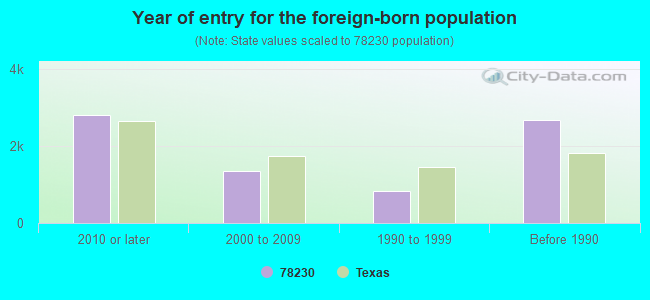
Foreign born population: 7,010 (16.1%) (56.1% of them are naturalized citizens)
Facilities with environmental interests located in this zip code:
APRIL CLEANERS (9853 W IH 10 STE 101 in SAN ANTONIO, TX)
(Resource Conservation and Recovery Act (tracking hazardous waste)) Alternative names: APRIL CLNRS
AB DICK CO (3201 CHERRY RIDGE STE 206 in SAN ANTONIO, TX)
Small Quantity Generators, between 100 kg and 1000 kg of hazardous waste/month (Resource Conservation and Recovery Act (tracking hazardous waste)) - notification
196 SCENIC HILLS, LTD ( TXR10SQ99) (COUNTY CLUB LANE @ COLUMBIA in SAN ANTONIO, TX)
ENFORCEMENT/COMPLIANCE ACTIVITY (Integrated Compliance Information System)
Housing units lacking complete plumbing facilities: 0.6% Housing units lacking complete kitchen facilities: 0.8%
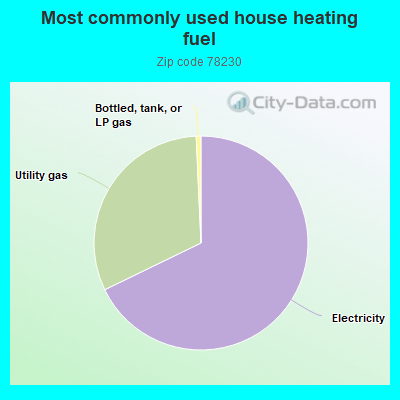
67.2%Electricity
31.2%Utility gas
0.7%Bottled, tank, or LP gas
Population in 1990: 30,253. Population change in the 1990s: +5,320 (+17.6%).
Place of birth for U.S.-born residents:
This state: 24,816
Northeast: 1,608
Midwest: 2,732
South: 3,447
West: 3,297
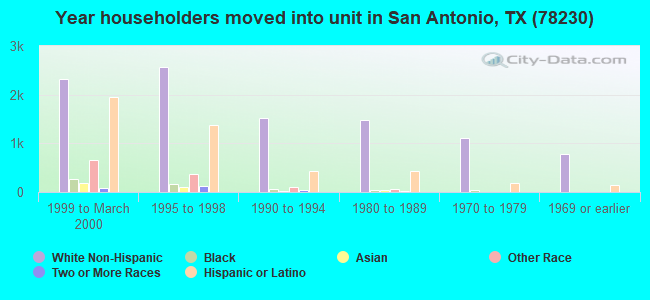
48% of the 78230 zip code residents lived in the same house 5 years ago. Out of people who lived in different houses, 61% lived in this county. Out of people who lived in different counties, 50% lived in Texas.
83% of the 78230 zip code residents lived in the same house 1 year ago. Out of people who lived in different houses, 67% moved from this county. Out of people who lived in different houses, 11% moved from different county within same state. Out of people who lived in different houses, 13% moved from different state. Out of people who lived in different houses, 6% moved from abroad.
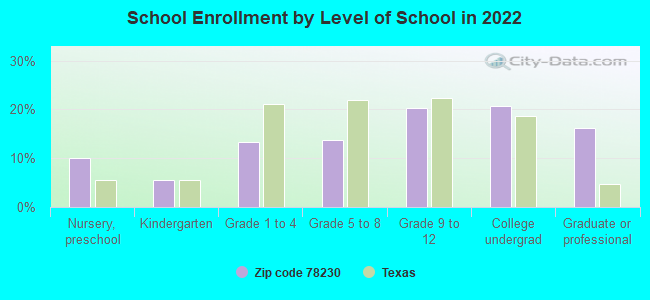
Private vs. public school enrollment:
Students in private schools in grades 1 to 8 (elementary and middle school): 469
Here:
19.3%
Texas:
8.8%
Students in private schools in grades 9 to 12 (high school): 304
Here:
16.8%
Texas:
8.0%
Students in private undergraduate colleges: 462
Here:
25.2%
Texas:
16.2%
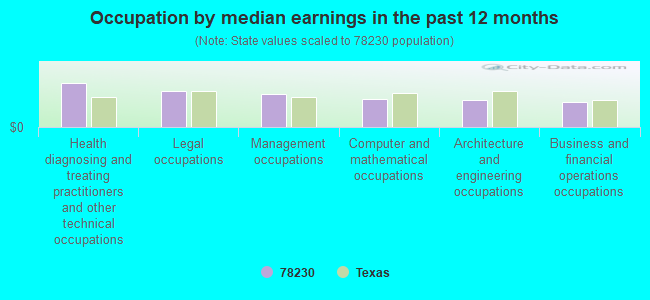
Occupation by median earnings in the past 12 months ($)
113,657Health diagnosing and treating practitioners and other technical occupations
92,525Legal occupations
84,144Management occupations
73,416Computer and mathematical occupations
70,855Architecture and engineering occupations
64,936Business and financial operations occupations
Companies with biggest federal contracts located in this zip code:
PHOTOTELESIS CORPORATION (7800 IH 10 WEST in SAN ANTONIO, TX; small business) : $29,027,129 in 80 contractsfrom 1999 to 2006
Contracts for Night Vision Equipment, Emitted and Reflected Radiation, Miscellaneous Communication Equipment, Defense Aircraft -- Advanced Development (R&D), Radio and Television Communication Equipment, Airborne, and moreby Army, Navy, Department of Defense Signed by year:2000: $848,923; 2001: $6,501,595; 2002: $2,126,381; 2003: $13,613,508; 2004: $4,078,838; 2005: $1,106,070; 2006: $613,779.
Biggest contracts:
$6,653,027 with Army for Night Vision Equipment, Emitted and Reflected Radiation. Signed on 2003-03-05. Completion date: 2004-06-30.
$4,854,072, same as above.Signed on 2003-04-22. Completion date: 2005-04-30.
$3,857,697, same as above.Signed on 2001-09-27. Completion date: 2002-06-15.
$2,649,290 with Army for Miscellaneous Communication Equipment. Signed on 2004-07-14. Completion date: 2004-12-01.
AKAOA ENTERPRISES (3918 HUNTERS CREST in SAN ANTONIO, TX; small business) : $1,370,160 in 5 contractsfrom 2002 to 2005
Contracts for ADP Facility Operation and Maintenance Services, Programming Services by Air Force Signed by year:2000: $0; 2001: $0; 2002: $206,811; 2003: $518,204; 2004: $460,805; 2005: $184,340; 2006: $0.
Biggest contracts:
$518,204 with Air Force for ADP Facility Operation and Maintenance Services. Signed on 2003-09-30. Completion date: 2005-09-29.
$254,683, same as above.Signed on 2004-09-24. Completion date: 2005-09-29.
$206,811 with Air Force for Programming Services. Signed on 2002-04-19. Completion date: 2003-02-14.
$206,122 with Air Force for ADP Facility Operation and Maintenance Services. Signed on 2004-06-15. Completion date: 2005-09-29.
METROCALL, INC (8131 1H-10 W #215 in SAN ANTONIO, TX) : $1,346,371 in 48 contractsfrom 2003 to 2006
Contracts for Other ADP and Telecommunications Services (includes data storage on tapes, compact disks, etc.), ADP Telecommunications and Transmission Services, Telecommunications Network Management Services, Maintenance, Repair or Alteration of Real Property -- Other Non-Building Facilities, and moreby Army, Air Force, Department of Veterans Affairs, Bureau of Prisoners/Federal Prison System, and others Signed by year:2000: $0; 2001: $0; 2002: $0; 2003: $6,943; 2004: $338,957; 2005: $687,728; 2006: $312,743.
Biggest contracts:
$309,417 with Army for Other ADP and Telecommunications Services (includes data storage on tapes, compact disks, etc.). Taking place in KY. Signed on 2005-04-04. Completion date: 2006-04-30.
$309,417 with Army for Other ADP and Telecommunications Services (includes data storage on tapes, compact disks, etc.). Signed on 2006-06-30. Effective on 2006-05-01. Completion date: 2007-04-30.
$216,577 with Army for ADP Telecommunications and Transmission Services. Signed on 2005-11-16. Completion date: 2006-11-15.
$140,709 with Army for ADP Telecommunications and Transmission Services. Taking place in OK. Signed on 2004-09-24. Completion date: 2005-09-23.
KENDRICK, ROBERT R (3518 HUNTERS CIRCLE in SAN ANTONIO, TX; small business) : $1,311,345 in 12 contractsfrom 2002 to 2005
Contracts for Surgery Services by Army Signed by year:2000: $0; 2001: $0; 2002: $313,875; 2003: $292,625; 2004: $347,265; 2005: $357,580; 2006: $0.
Biggest contracts:
$329,840 with Army for Surgery Services. Signed on 2005-10-18. Completion date: 2002-09-30.
$286,160, same as above.Signed on 2004-10-07. Completion date: 2002-09-30.
$274,400, same as above.Signed on 2003-10-29. Completion date: 2002-09-30.
$264,600, same as above.Signed on 2002-10-24. Completion date: 2002-09-30.
TEXAS CAVE MANAGEMENT ASSOCIAT (4019 RAMSGATE in SAN ANTONIO, TX) : $590,637 in 4 contractsfrom 2001 to 2004
$265,780 with Army for Pesticides Support Services. Signed on 2004-09-02. Completion date: 2004-09-23.
$258,040, same as above.Signed on 2003-09-12. Completion date: 2004-09-23.
$36,247 with Army for Maintenance, Repair or Alteration of Real Property -- Other Conservation and Development Facilities. Signed on 2003-04-10. Completion date: 2003-09-30.
$30,570 with Army for Maintenance, Repair or Alteration of Real Property -- Other Non-Building Facilities. Signed on 2001-09-01. Completion date: 2002-09-14.
BOLLES VICTOR (13030 Hunters Breeze in San Antonio, TX; small business) : $414,895 in 6 contractsfrom 2003 to 2006
Contracts for Personal Services Contracts by Departmental Offices Signed by year:2000: $0; 2001: $0; 2002: $0; 2003: $59,583; 2004: $60,620; 2005: $5,794; 2006: $288,898.
Biggest contracts:
$184,527 with Departmental Offices for Personal Services Contracts. Taking place in DC. Signed on 2006-09-18. Effective on 2006-09-30. Completion date: 2007-09-29.
$104,371, same as above.Signed on 2006-03-14. Completion date: 2008-09-29.
$60,620, same as above.Signed on 2004-09-22. Completion date: 2005-09-29.
$59,583, same as above.Signed on 2003-09-15. Completion date: 2004-09-15.
NANCY DAMICO NICKLES, M D (3022 ORCHARD HILL in SAN ANTONIO, TX; small business) : $324,057 in 8 contractsfrom 1999 to 2004
Contracts for Pediatric Services by Army Signed by year:2000: $83,154; 2001: $85,238; 2002: $77,969; 2003: $89,556; 2004: -$63,860; 2005: $0; 2006: $0.
Biggest contracts:
$89,556 with Army for Pediatric Services. Signed on 2003-10-16. Completion date: 2004-09-30.
$87,372, same as above.Signed on 2002-10-10. Completion date: 2004-09-30.
$85,238, same as above.Signed on 2001-10-25. Completion date: 2004-09-30.
$83,154, same as above.Signed on 2000-10-30. Completion date: 2004-09-30.
HILDA M RIVERA-SANTIAGO MD (3918 CREEK FOREST ST in SAN ANTONIO, TX; small business) : $314,872 in 10 contractsfrom 2000 to 2005
Contracts for Pediatric Services, General Health Care Services by Army Signed by year:2000: $53,680; 2001: $63,440; 2002: $57,596; 2003: $0; 2004: $67,033; 2005: $73,123; 2006: $0.
Biggest contracts:
$81,720 with Army for Pediatric Services. Signed on 2005-10-06. Completion date: 2006-09-30.
$66,342, same as above.Signed on 2004-10-31. Completion date: 2005-09-30.
$65,343, same as above.Signed on 2002-10-23. Completion date: 2005-09-30.
$63,440, same as above.Signed on 2001-10-24. Completion date: 2005-09-30.
ENG, TERRY MD (10406 MT HOPE in SAN ANTONIO, TX; small business) : $257,461 in 6 contractsfrom 2003 to 2005
Contracts for Pediatric Services by Army Signed by year:2000: $0; 2001: $0; 2002: $0; 2003: $112,450; 2004: $74,593; 2005: $70,418; 2006: $0.
Biggest contracts:
$77,480 with Army for Pediatric Services. Signed on 2005-10-06. Completion date: 2003-09-30.
$75,140, same as above.Signed on 2004-10-07. Completion date: 2003-09-30.
$72,800, same as above.Signed on 2003-10-30. Completion date: 2003-09-30.
$39,650, same as above.Signed on 2003-03-08. Completion date: 2003-09-30.
MARTIN MARIETTA MATERIALS SW I (11467 HUEBNER, SUITE 300 in SAN ANTONIO, TX) : $211,704 in 2 contractsfrom 2002 to 2005
$112,560 with Army for Mineral Construction Materials, Bulk. Signed on 2002-05-22. Completion date: 2002-05-22.
$99,144 with Air Force for Miscellaneous Construction Equipment. Signed on 2005-03-23. Completion date: 2005-04-08.
Top industries in this zip code by the number of employees in 2005:
2002 - 2018 National Fire Incident Reporting System (NFIRS) incidents
Based on the data from the years 2002 - 2018 the average number of fires per year is 66. The highest number of fire incidents - 109 took place in 2006, and the least - 0 in 2008. The data has a dropping trend.
When looking into fire subcategories, the most reports belonged to: Outside Fires (33.9%), and Mobile Property/Vehicle Fires (28.0%).
Fire incident types reported to NFIRS in Zip Code 78230
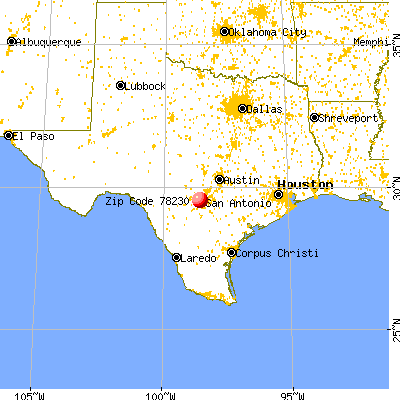


 Nearest zip codes: 78231, 78213, 78229, 78240, 78248, 78249.
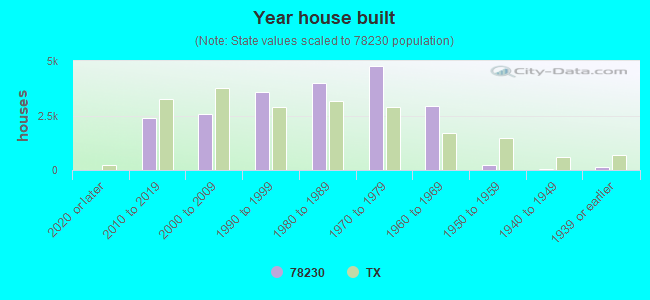


 Based on the data from the years 2002 - 2018 the average number of fires per year is 66. The highest number of fire incidents - 109 took place in 2006, and the least - 0 in 2008. The data has a dropping trend.
 When looking into fire subcategories, the most reports belonged to: Outside Fires (33.9%), and Mobile Property/Vehicle Fires (28.0%).