Estimated zip code population in 2022: 7,568 Zip code population in 2010: 7,665 Zip code population in 2000: 7,161
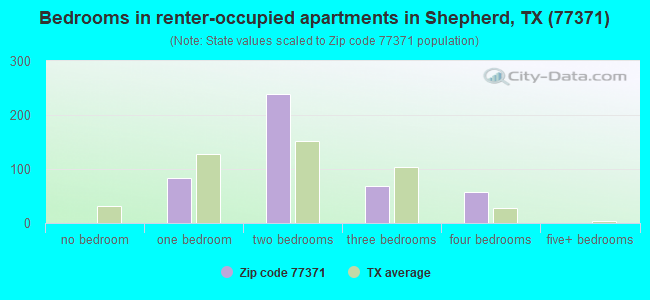
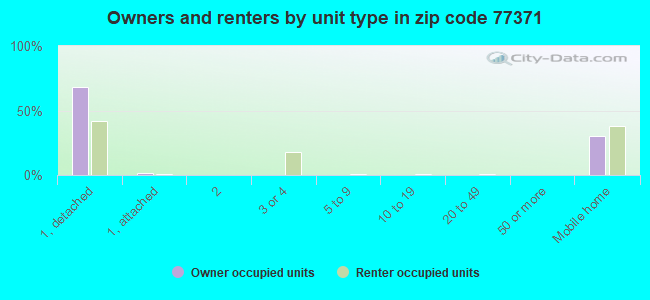
Houses and condos: 3,067 Renter-occupied apartments: 452
% of renters here:
20%
State:
38%
March 2022 cost of living index in zip code 77371: 79.3 (low, U.S. average is 100)
Land area: 127.2 sq. mi. Water area: 2.3 sq. mi.
Population density: 59 people per square mile
(very low).
OSM Map
General Map
Google Map
MSN Map
OSM Map
General Map
Google Map
MSN Map
OSM Map
General Map
Google Map
MSN Map
OSM Map
General Map
Google Map
MSN Map
Please wait while loading the map...
Real estate property taxes paid for housing units in 2022:
This zip code:
1.1% ($1,648)
Texas:
1.5% ($4,050)
Median real estate property taxes paid for housing units with mortgages in 2022: $2,293 (1.0%) Median real estate property taxes paid for housing units with no mortgage in 2022: $757 (0.7%)
Averages for the 2020 tax year for zip code 77371, filed in 2021:
Average Adjusted Gross Income (AGI) in 2020: $49,665 (Individual Income Tax Returns)
Here:
$49,665
State:
$77,054
Salary/wage: $47,220 (reported on 80.7% of returns)
Here:
$47,220
State:
$62,766
(% of AGI for various income ranges: 1089.3% for AGIs below $25k, 3567.6% for AGIs $25k-50k, 6248.5% for AGIs $50k-75k, 9741.6% for AGIs $75k-100k, 16832.4% for AGIs $100k-200k, 45980.0% for AGIs over 200k)
Taxable interest for individuals: $1,293 (reported on 13.3% of returns)
This zip code:
$1,293
Texas:
$2,665
(% of AGI for various income ranges: 5.7% for AGIs below $25k, 7.6% for AGIs $25k-50k, 25.6% for AGIs $50k-75k, 47.9% for AGIs $75k-100k, 53.8% for AGIs $100k-200k, 710.0% for AGIs over 200k)
Ordinary dividends: $4,953 (reported on 5.4% of returns)
Here:
$4,953
State:
$10,044
(% of AGI for various income ranges: 2.6% for AGIs below $25k, 11.7% for AGIs $25k-50k, 23.5% for AGIs $50k-75k, 50.5% for AGIs $75k-100k, 265.2% for AGIs $100k-200k)
Net capital gain/loss in AGI: +$36,658 (reported on 6.0% of returns)
Here:
+$36,658
State:
+$39,590
(% of AGI for various income ranges: 3.9% for AGIs below $25k, 9.4% for AGIs $25k-50k, 30.9% for AGIs $50k-75k, 182.6% for AGIs $75k-100k, 3051.0% for AGIs $100k-200k)
Profit/loss from business: +$8,068 (reported on 23.1% of returns)
Here:
+$8,068
State:
+$10,888
(% of AGI for various income ranges: 212.4% for AGIs below $25k, 163.1% for AGIs $25k-50k, 191.8% for AGIs $50k-75k, 189.5% for AGIs $75k-100k, 770.0% for AGIs $100k-200k)
Taxable individual retirement arrangement distribution: $16,592 (reported on 4.1% of returns)
77371:
$16,592
Texas:
$24,740
(% of AGI for various income ranges: 17.6% for AGIs below $25k, 37.7% for AGIs $25k-50k, 214.7% for AGIs $50k-75k, 469.0% for AGIs $100k-200k)
Total itemized deductions: $35,354 (reported on 4.1% of returns)
Here:
$35,354
State:
$40,428
(% of AGI for various income ranges: 150.1% for AGIs $25k-50k, 383.2% for AGIs $75k-100k, 1334.3% for AGIs $100k-200k)
Charity contributions: $10,844 (reported on 2.8% of returns)
Here:
$10,844
State:
$18,201
(% of AGI for various income ranges: 75.3% for AGIs $50k-75k, 342.9% for AGIs $100k-200k)
Taxes paid: $6,491 (reported on 3.5% of returns)
77371:
$6,491
State:
$7,821
(% of AGI for various income ranges: 21.4% for AGIs $25k-50k, 76.8% for AGIs $75k-100k, 198.1% for AGIs $100k-200k)
Earned income credit: $2,739 (reported on 27.8% of returns)
Here:
$2,739
State:
$2,584
(% of AGI for various income ranges: 158.5% for AGIs below $25k, 118.5% for AGIs $25k-50k)
Percentage of individuals using paid preparers for their 2020 taxes: 92.7%
Here:
93%
State:
92%
(% for various income ranges: 92.8% for AGIs below $25k, 92.9% for AGIs $25k-50k, 88.4% for AGIs $50k-75k, 92.6% for AGIs $75k-100k, 96.8% for AGIs $100k-200k, 100.0% for AGIs over 200k)
Averages for the 2012 tax year for zip code 77371, filed in 2013:
Average Adjusted Gross Income (AGI) in 2012: $40,723 (Individual Income Tax Returns)
Here:
$40,723
State:
$65,384
Salary/wage: $39,108 (reported on 85.7% of returns)
Here:
$39,108
State:
$52,524
(% of AGI for various income ranges: 76.2% for AGIs below $25k, 86.0% for AGIs $25k-50k, 86.0% for AGIs $50k-75k, 86.3% for AGIs $75k-100k, 77.2% for AGIs $100k-200k)
Taxable interest for individuals: $980 (reported on 14.3% of returns)
This zip code:
$980
Texas:
$2,372
(% of AGI for various income ranges: 0.5% for AGIs below $25k, 0.2% for AGIs $25k-50k, 0.4% for AGIs $50k-75k, 0.4% for AGIs $75k-100k, 0.3% for AGIs $100k-200k)
Ordinary dividends: $4,286 (reported on 5.0% of returns)
Here:
$4,286
State:
$9,721
(% of AGI for various income ranges: 0.2% for AGIs below $25k, 0.1% for AGIs $25k-50k, 0.4% for AGIs $50k-75k, 0.3% for AGIs $75k-100k, 1.3% for AGIs $100k-200k)
Net capital gain/loss in AGI: +$454 (reported on 4.6% of returns)
Here:
+$454
State:
+$35,319
(% of AGI for various income ranges: 0.2% for AGIs $25k-50k, 0.1% for AGIs $75k-100k)
Profit/loss from business: +$8,735 (reported on 19.6% of returns)
Here:
+$8,735
State:
+$13,732
(% of AGI for various income ranges: 14.4% for AGIs below $25k, 4.4% for AGIs $25k-50k, 2.0% for AGIs $50k-75k, 1.3% for AGIs $75k-100k, 2.0% for AGIs $100k-200k)
Taxable individual retirement arrangement distribution: $14,608 (reported on 4.3% of returns)
77371:
$14,608
Texas:
$19,511
(% of AGI for various income ranges: 1.1% for AGIs below $25k, 1.0% for AGIs $25k-50k, 1.6% for AGIs $50k-75k, 5.2% for AGIs $75k-100k)
Total itemized deductions: $22,123 (27% of AGI, reported on 16.8% of returns)
Here:
$22,123
State:
$24,724
Here:
26.8% of AGI
State:
15.9% of AGI
(% of AGI for various income ranges: 4.5% for AGIs below $25k, 8.8% for AGIs $25k-50k, 8.4% for AGIs $50k-75k, 9.7% for AGIs $75k-100k, 12.2% for AGIs $100k-200k)
Charity contributions: $5,717 (reported on 10.7% of returns)
Here:
$5,717
State:
$6,808
(% of AGI for various income ranges: 0.3% for AGIs below $25k, 1.2% for AGIs $25k-50k, 1.1% for AGIs $50k-75k, 1.7% for AGIs $75k-100k, 2.7% for AGIs $100k-200k)
Taxes paid: $3,443 (reported on 16.8% of returns)
77371:
$3,443
State:
$6,921
(% of AGI for various income ranges: 0.5% for AGIs below $25k, 1.4% for AGIs $25k-50k, 1.0% for AGIs $50k-75k, 1.6% for AGIs $75k-100k, 2.1% for AGIs $100k-200k)
Earned income credit: $2,669 (reported on 32.1% of returns)
Here:
$2,669
State:
$2,570
(% of AGI for various income ranges: 11.9% for AGIs below $25k, 1.8% for AGIs $25k-50k)
Percentage of individuals using paid preparers for their 2012 taxes: 57.5%
Here:
57%
State:
51%
(% for various income ranges: 54.2% for AGIs below $25k, 54.3% for AGIs $25k-50k, 61.5% for AGIs $50k-75k, 66.7% for AGIs $75k-100k, 73.7% for AGIs $100k-200k)
Averages for the 2004 tax year for zip code 77371, filed in 2005:
Average Adjusted Gross Income (AGI) in 2004: $28,091 (Individual Income Tax Returns)
Here:
$28,091
State:
$47,881
Salary/wage: $28,513 (reported on 85.0% of returns)
Here:
$28,513
State:
$41,947
(% of AGI for various income ranges: 104.4% for AGIs below $10k, 81.4% for AGIs $10k-25k, 89.9% for AGIs $25k-50k, 90.0% for AGIs $50k-75k, 88.0% for AGIs $75k-100k, 68.7% for AGIs over 100k)
Taxable interest for individuals: $1,254 (reported on 19.0% of returns)
This zip code:
$1,254
Texas:
$2,255
(% of AGI for various income ranges: 2.1% for AGIs below $10k, 1.3% for AGIs $10k-25k, 0.6% for AGIs $25k-50k, 0.4% for AGIs $50k-75k, 1.2% for AGIs $75k-100k, 0.9% for AGIs over 100k)
Taxable dividends: $994 (reported on 6.4% of returns)
Here:
$994
State:
$4,261
(% of AGI for various income ranges: 1.3% for AGIs below $10k, 0.2% for AGIs $10k-25k, 0.1% for AGIs $25k-50k, 0.1% for AGIs $50k-75k, 0.6% for AGIs $75k-100k, 0.1% for AGIs over 100k)
Net capital gain/loss: +$702 (reported on 6.7% of returns)
Here:
+$702
State:
+$16,110
(% of AGI for various income ranges: 0.3% for AGIs below $10k, -0.0% for AGIs $10k-25k, -0.1% for AGIs $25k-50k, 0.2% for AGIs $50k-75k, 0.9% for AGIs $75k-100k, 0.2% for AGIs over 100k)
Profit/loss from business: +$3,173 (reported on 20.5% of returns)
Here:
+$3,173
State:
+$11,013
(% of AGI for various income ranges: 15.8% for AGIs below $10k, 8.9% for AGIs $10k-25k, 0.4% for AGIs $25k-50k, -0.7% for AGIs $50k-75k, 0.3% for AGIs $75k-100k, 0.2% for AGIs over 100k)
IRA payment deduction: $1,273 (reported on 0.8% of returns)
77371:
$1,273
Texas:
$3,120
Total itemized deductions: $16,701 (29% of AGI, reported on 13.1% of returns)
Here:
$16,701
State:
$19,631
Here:
29.2% of AGI
State:
18.9% of AGI
(% of AGI for various income ranges: 4.7% for AGIs below $10k, 5.0% for AGIs $10k-25k, 8.0% for AGIs $25k-50k, 10.0% for AGIs $50k-75k, 8.2% for AGIs $75k-100k, 8.2% for AGIs over 100k)
Charity contributions deductions: $3,892 (6% of AGI, reported on 9.5% of returns)
Here:
$3,892
State:
$4,753
Here:
6.2% of AGI
State:
4.2% of AGI
(% of AGI for various income ranges: 0.8% for AGIs $10k-25k, 1.2% for AGIs $25k-50k, 1.5% for AGIs $50k-75k, 1.4% for AGIs $75k-100k, 2.6% for AGIs over 100k)
Total tax: $3,397 (reported on 62.3% of returns)
77371:
$3,397
State:
$9,058
(% of AGI for various income ranges: 4.6% for AGIs below $10k, 3.5% for AGIs $10k-25k, 5.2% for AGIs $25k-50k, 8.1% for AGIs $50k-75k, 10.7% for AGIs $75k-100k, 17.9% for AGIs over 100k)
Earned income credit: $2,024 (reported on 33.3% of returns)
Here:
$2,024
State:
$2,024
Percentage of individuals using paid preparers for their 2004 taxes: 55.6%
Here:
56%
State:
57%
(% for various income ranges: 51.4% for AGIs below $10k, 57.1% for AGIs $10k-25k, 57.5% for AGIs $25k-50k, 54.4% for AGIs $50k-75k, 55.2% for AGIs $75k-100k, 70.4% for AGIs over 100k)
Household received Food Stamps/SNAP in the past 12 months: 739 Household did not receive Food Stamps/SNAP in the past 12 months: 1,579
Women who had a birth in the past 12 months: 66 (35 now married, 29 unmarried) Women who did not have a birth in the past 12 months: 1,699 (922 now married, 772 unmarried)
Housing units in zip code 77371 with a mortgage: 723 (5 second mortgage) Median monthly owner costs for units with a mortgage: $1,746 Median monthly owner costs for units without a mortgage: $395
Residents with income below the poverty level in 2022:
This zip code:
12.1%
Whole state:
14.0%
Residents with income below 50% of the poverty level in 2022:
This zip code:
8.9%
Whole state:
7.4%
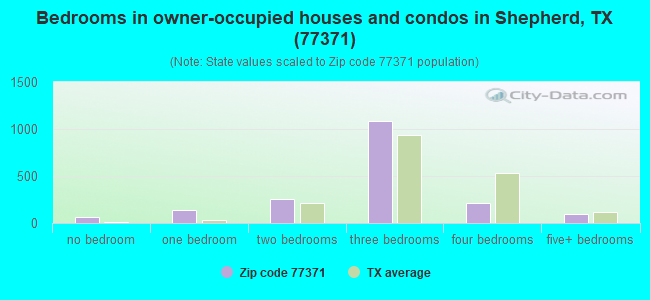
Median number of rooms in houses and condos:
Here:
5.3
State:
6.3
Median number of rooms in apartments:
Here:
3.8
State:
4.0
Notable locations in this zip code not listed on our city pages
Churches in zip code 77371 include: Big Creek Missionary Church (A), Calvary Church (B), Farley Chapel (C), Lake Pool Church (D), Lake Station Church (E), Magnolia Grove Church (F). Display/hide their locations on the map
Cemeteries: Coley Creek Cemetery (1), Lovett Cemetery (2), Big Creek Cemetery (3), Lake Station Cemetery (4), Farley Cemetery (5). Display/hide their locations on the map
Lakes, reservoirs, and swamps: Smith Break (A), Woods Lake (B), Gator Pond (C), Lost Lake (D), Brushy Lake (E), Water Wheels Lake Number 1 (F), Water Wheels Lake Number 2 (G), Lake Run-A-Muck (H). Display/hide their locations on the map
Streams, rivers, and creeks: Yates Creek (A), Sulphur Branch (B), Mussel Shoals (C), Huffman Creek (D), Henry Lake Branch (E), Double Lake Branch (F), Davison Bayou (G), Coley Creek (H), Williamson Branch (I). Display/hide their locations on the map
In group quarters: 70 (-1 institutionalized population)
Size of family households: 605 2-persons, 270 3-persons, 462 4-persons, 145 5-persons, 63 6-persons, 173 7-or-more-persons
Size of nonfamily households: 458 1-person, 108 2-persons
1,555 married couples with children.
200 single-parent households (77 men, 123 women).
80.3% of residents of 77371 zip code speak English at home.
18.9% of residents speak Spanish at home (69% very well, 12% well, 13% not well, 7% not at all).
0.2% of residents speak other Indo-European language at home (100% very well).
0.1% of residents speak other language at home (100% very well).
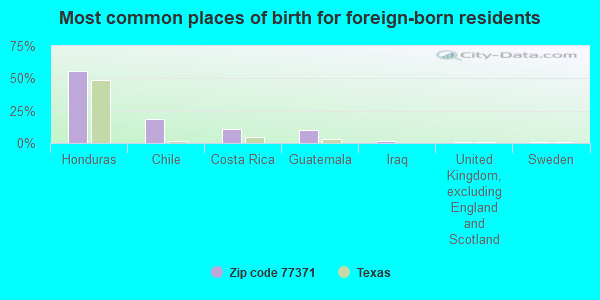
Foreign born population: 409 (5.4%) (30.7% of them are naturalized citizens)
This zip code:
5.4%
Whole state:
17.2%
56%Honduras
18%Chile
11%Costa Rica
10%Guatemala
1%Iraq
1%United Kingdom, excluding England and Scotland
1%Sweden
30%American
11%Irish
10%English
9%German
2%Italian
1%Scottish
1%Polish
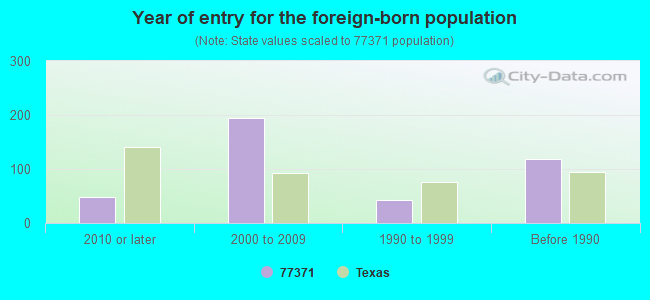
Year of entry for the foreign-born population
482010 or later
1952000 to 2009
421990 to 1999
118Before 1990
Housing units lacking complete plumbing facilities: 9.9% Housing units lacking complete kitchen facilities: 8.3%
73.0%Electricity
15.0%Utility gas
8.4%Bottled, tank, or LP gas
3.5%Wood
Population in 1990: 9,604.
Place of birth for U.S.-born residents:
This state: 5,602
Northeast: 95
Midwest: 570
South: 562
West: 266
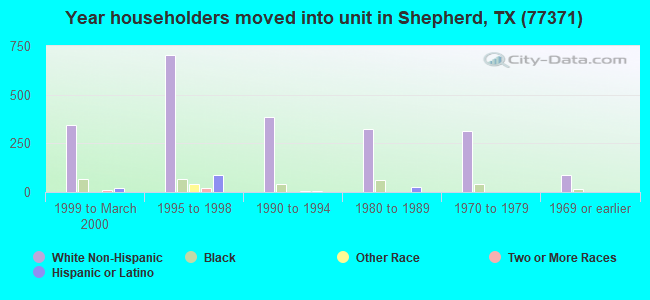
53% of the 77371 zip code residents lived in the same house 5 years ago. Out of people who lived in different houses, 33% lived in this county. Out of people who lived in different counties, 50% lived in Texas.
90% of the 77371 zip code residents lived in the same house 1 year ago. Out of people who lived in different houses, 35% moved from this county. Out of people who lived in different houses, 60% moved from different county within same state. Out of people who lived in different houses, 7% moved from different state.
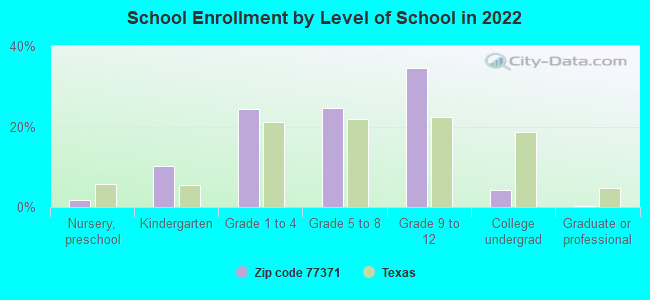
Private vs. public school enrollment:
Students in private schools in grades 1 to 8 (elementary and middle school): 73
Here:
7.5%
Texas:
8.8%
Students in private schools in grades 9 to 12 (high school): 18
Here:
2.7%
Texas:
8.0%
Students in private undergraduate colleges:
Here:
0.0%
Texas:
16.2%
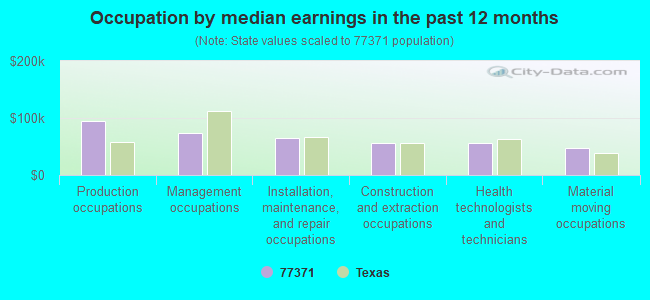
Occupation by median earnings in the past 12 months ($)
95,578Production occupations
74,531Management occupations
65,310Installation, maintenance, and repair occupations
55,752Construction and extraction occupations
55,290Health technologists and technicians
46,961Material moving occupations
Top industries in this zip code by the number of employees in 2005:
Health Care and Social Assistance: Nursing Care Facilities (50-99 employees: 1 establishment)
Accommodation and Food Services: Full-Service Restaurants (20-49: 1, 10-19: 1)
Accommodation and Food Services: Limited-Service Restaurants (20-49: 1, 1-4: 2)
Finance and Insurance: Commercial Banking (20-49: 1)
Wholesale Trade: Roofing, Siding, and Insulation Material Merchant Wholesalers (20-49: 1)
Construction: Electrical Contractors (20-49: 1)
Wholesale Trade: Recyclable Material Merchant Wholesalers (10-19: 1)
People in group quarters in 2010:
74 people in nursing facilities/skilled-nursing facilities
People in group quarters in 2000:
91 people in nursing homes
4 people in other group homes
Fatal accident statistics in 2014:
Fatal accident count: 3
Vehicles involved in fatal accidents: 4
Fatal accidents caused by drunken drivers: 2
Fatalities: 3
Persons involved in fatal accidents: 7
Pedestrians involved in fatal accidents: 0
Fatal accident statistics in 2013:
Fatal accident count: 2
Vehicles involved in fatal accidents: 2
Fatal accidents caused by drunken drivers: 1
Fatalities: 3
Persons involved in fatal accidents: 4
Pedestrians involved in fatal accidents: 0
2003 - 2018 National Fire Incident Reporting System (NFIRS) incidents
Based on the data from the years 2003 - 2018 the average number of fire incidents per year is 57. The highest number of fires - 116 took place in 2006, and the least - 3 in 2004. The data has an increasing trend.
When looking into fire subcategories, the most incidents belonged to: Outside Fires (59.2%), and Structure Fires (25.3%).
Fire incident types reported to NFIRS in Zip Code 77371


 Nearest zip codes: 77335, 77368, 77326, 77327, 77328, 77331.


 Based on the data from the years 2003 - 2018 the average number of fire incidents per year is 57. The highest number of fires - 116 took place in 2006, and the least - 3 in 2004. The data has an increasing trend.
 When looking into fire subcategories, the most incidents belonged to: Outside Fires (59.2%), and Structure Fires (25.3%).