Estimated zip code population in 2022: 57,228 Zip code population in 2010: 44,490 Zip code population in 2000: 18,451
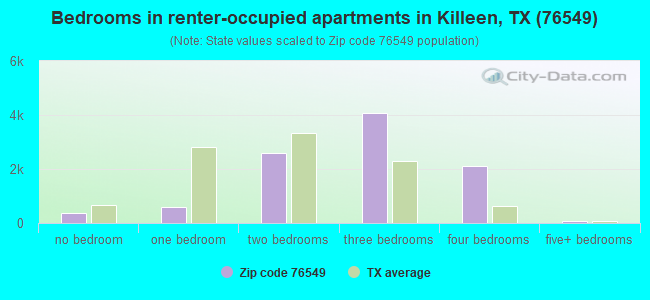
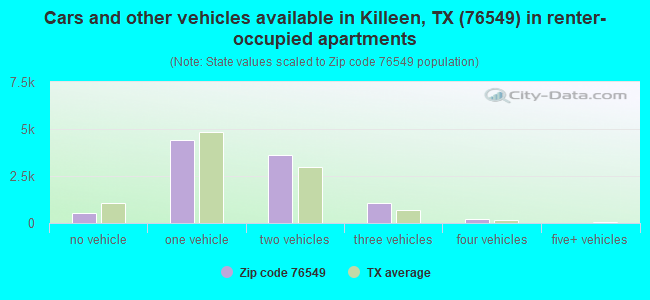
Houses and condos: 22,023 Renter-occupied apartments: 9,850
% of renters here:
48%
State:
38%
March 2022 cost of living index in zip code 76549: 85.7 (less than average, U.S. average is 100)
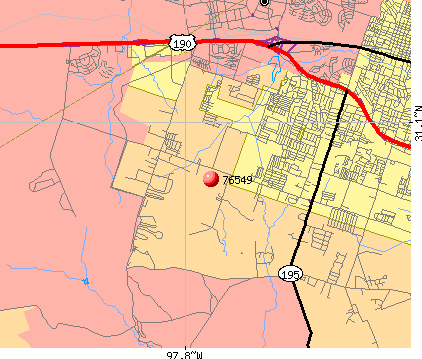
Land area: 76.8 sq. mi. Water area: 0.5 sq. mi.
Population density: 745 people per square mile
(low).
OSM Map
General Map
Google Map
MSN Map
OSM Map
General Map
Google Map
MSN Map
OSM Map
General Map
Google Map
MSN Map
OSM Map
General Map
Google Map
MSN Map
Please wait while loading the map...
Real estate property taxes paid for housing units in 2022:
This zip code:
1.6% ($3,426)
Texas:
1.5% ($4,050)
Median real estate property taxes paid for housing units with mortgages in 2022: $3,713 (1.7%) Median real estate property taxes paid for housing units with no mortgage in 2022: $2,848 (1.4%)
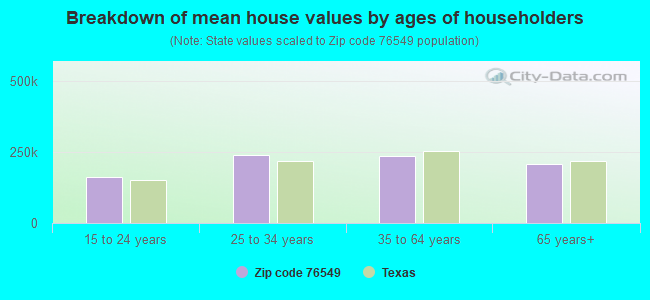
Estimated median house/condo value in 2022: $214,766
76549:
$214,766
Texas:
$275,400
According to our research of Texas and other state lists, there were 93 registered sex offenders living in 76549 zip code as of May 15, 2024. The ratio of all residents to sex offenders in zip code 76549 is 536 to 1. The ratio of registered sex offenders to all residents in this zip code is near the state average.
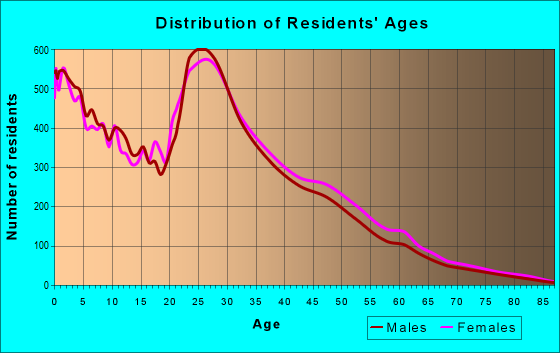
Median resident age:
This zip code:
29.1 years
Texas median age:
35.6 years
Average household size:
This zip code:
2.8 people
Texas:
2.6 people
Averages for the 2020 tax year for zip code 76549, filed in 2021:
Average Adjusted Gross Income (AGI) in 2020: $42,575 (Individual Income Tax Returns)
Here:
$42,575
State:
$77,054
Salary/wage: $38,822 (reported on 88.7% of returns)
Here:
$38,822
State:
$62,766
(% of AGI for various income ranges: 1279.9% for AGIs below $25k, 3494.8% for AGIs $25k-50k, 6228.4% for AGIs $50k-75k, 9023.6% for AGIs $75k-100k, 15179.4% for AGIs $100k-200k, 45434.0% for AGIs over 200k)
Taxable interest for individuals: $671 (reported on 12.5% of returns)
This zip code:
$671
Texas:
$2,665
(% of AGI for various income ranges: 3.1% for AGIs below $25k, 3.6% for AGIs $25k-50k, 14.1% for AGIs $50k-75k, 28.6% for AGIs $75k-100k, 53.4% for AGIs $100k-200k, 440.0% for AGIs over 200k)
Ordinary dividends: $1,485 (reported on 5.9% of returns)
Here:
$1,485
State:
$10,044
(% of AGI for various income ranges: 1.4% for AGIs below $25k, 2.0% for AGIs $25k-50k, 6.8% for AGIs $50k-75k, 19.1% for AGIs $75k-100k, 93.9% for AGIs $100k-200k, 1104.0% for AGIs over 200k)
Net capital gain/loss in AGI: +$6,107 (reported on 6.6% of returns)
Here:
+$6,107
State:
+$39,590
(% of AGI for various income ranges: 1.2% for AGIs below $25k, 6.0% for AGIs $25k-50k, 17.1% for AGIs $50k-75k, 53.6% for AGIs $75k-100k, 347.2% for AGIs $100k-200k, 9726.0% for AGIs over 200k)
Profit/loss from business: +$3,712 (reported on 13.4% of returns)
Here:
+$3,712
State:
+$10,888
(% of AGI for various income ranges: 31.0% for AGIs below $25k, 22.5% for AGIs $25k-50k, 82.5% for AGIs $50k-75k, 74.6% for AGIs $75k-100k, 346.3% for AGIs $100k-200k, 2386.0% for AGIs over 200k)
Taxable individual retirement arrangement distribution: $13,744 (reported on 2.1% of returns)
76549:
$13,744
Texas:
$24,740
(% of AGI for various income ranges: 8.3% for AGIs below $25k, 12.0% for AGIs $25k-50k, 35.2% for AGIs $50k-75k, 76.0% for AGIs $75k-100k, 373.8% for AGIs $100k-200k)
Total itemized deductions: $27,543 (reported on 2.7% of returns)
Here:
$27,543
State:
$40,428
(% of AGI for various income ranges: 10.4% for AGIs below $25k, 42.4% for AGIs $25k-50k, 147.1% for AGIs $50k-75k, 232.3% for AGIs $75k-100k, 549.4% for AGIs $100k-200k, 2314.0% for AGIs over 200k)
Charity contributions: $10,557 (reported on 2.1% of returns)
Here:
$10,557
State:
$18,201
(% of AGI for various income ranges: 1.6% for AGIs below $25k, 9.7% for AGIs $25k-50k, 38.7% for AGIs $50k-75k, 71.2% for AGIs $75k-100k, 202.2% for AGIs $100k-200k, 1010.0% for AGIs over 200k)
Taxes paid: $5,463 (reported on 2.4% of returns)
76549:
$5,463
State:
$7,821
(% of AGI for various income ranges: 2.1% for AGIs below $25k, 7.8% for AGIs $25k-50k, 24.7% for AGIs $50k-75k, 42.2% for AGIs $75k-100k, 99.8% for AGIs $100k-200k, 442.0% for AGIs over 200k)
Earned income credit: $2,746 (reported on 30.2% of returns)
Here:
$2,746
State:
$2,584
(% of AGI for various income ranges: 154.4% for AGIs below $25k, 106.6% for AGIs $25k-50k, 2.3% for AGIs $50k-75k)
Percentage of individuals using paid preparers for their 2020 taxes: 95.4%
Here:
95%
State:
92%
(% for various income ranges: 95.3% for AGIs below $25k, 96.0% for AGIs $25k-50k, 95.3% for AGIs $50k-75k, 94.2% for AGIs $75k-100k, 94.6% for AGIs $100k-200k, 92.9% for AGIs over 200k)
Averages for the 2012 tax year for zip code 76549, filed in 2013:
Average Adjusted Gross Income (AGI) in 2012: $37,509 (Individual Income Tax Returns)
Here:
$37,509
State:
$65,384
Salary/wage: $36,004 (reported on 92.2% of returns)
Here:
$36,004
State:
$52,524
(% of AGI for various income ranges: 95.3% for AGIs below $25k, 93.9% for AGIs $25k-50k, 88.9% for AGIs $50k-75k, 84.3% for AGIs $75k-100k, 80.5% for AGIs $100k-200k, 48.1% for AGIs over 200k)
Taxable interest for individuals: $554 (reported on 15.8% of returns)
This zip code:
$554
Texas:
$2,372
(% of AGI for various income ranges: 0.2% for AGIs below $25k, 0.1% for AGIs $25k-50k, 0.2% for AGIs $50k-75k, 0.2% for AGIs $75k-100k, 0.2% for AGIs $100k-200k, 1.4% for AGIs over 200k)
Ordinary dividends: $3,292 (reported on 6.7% of returns)
Here:
$3,292
State:
$9,721
(% of AGI for various income ranges: 2.2% for AGIs below $25k, 0.3% for AGIs $25k-50k, 0.1% for AGIs $50k-75k, 0.3% for AGIs $75k-100k, 0.4% for AGIs $100k-200k, 0.8% for AGIs over 200k)
Net capital gain/loss in AGI: +$3,462 (reported on 4.2% of returns)
Here:
+$3,462
State:
+$35,319
(% of AGI for various income ranges: 0.2% for AGIs $50k-75k, 0.2% for AGIs $75k-100k, 0.6% for AGIs $100k-200k, 7.7% for AGIs over 200k)
Profit/loss from business: +$5,638 (reported on 8.8% of returns)
Here:
+$5,638
State:
+$13,732
(% of AGI for various income ranges: 2.9% for AGIs below $25k, 0.3% for AGIs $25k-50k, 0.6% for AGIs $50k-75k, 0.9% for AGIs $75k-100k, 1.5% for AGIs $100k-200k, 10.8% for AGIs over 200k)
Taxable individual retirement arrangement distribution: $10,385 (reported on 2.5% of returns)
76549:
$10,385
Texas:
$19,511
(% of AGI for various income ranges: 0.4% for AGIs below $25k, 0.4% for AGIs $25k-50k, 0.6% for AGIs $50k-75k, 0.9% for AGIs $75k-100k, 1.9% for AGIs $100k-200k)
Total itemized deductions: $16,588 (26% of AGI, reported on 16.3% of returns)
Here:
$16,588
State:
$24,724
Here:
25.6% of AGI
State:
15.9% of AGI
(% of AGI for various income ranges: 4.9% for AGIs below $25k, 6.1% for AGIs $25k-50k, 8.4% for AGIs $50k-75k, 8.6% for AGIs $75k-100k, 9.2% for AGIs $100k-200k, 6.3% for AGIs over 200k)
Charity contributions: $4,344 (reported on 11.1% of returns)
Here:
$4,344
State:
$6,808
(% of AGI for various income ranges: 0.4% for AGIs below $25k, 0.8% for AGIs $25k-50k, 1.6% for AGIs $50k-75k, 1.8% for AGIs $75k-100k, 2.2% for AGIs $100k-200k, 1.9% for AGIs over 200k)
Taxes paid: $4,525 (reported on 15.9% of returns)
76549:
$4,525
State:
$6,921
(% of AGI for various income ranges: 1.4% for AGIs below $25k, 1.6% for AGIs $25k-50k, 2.1% for AGIs $50k-75k, 2.3% for AGIs $75k-100k, 2.6% for AGIs $100k-200k, 2.0% for AGIs over 200k)
Earned income credit: $2,596 (reported on 33.1% of returns)
Here:
$2,596
State:
$2,570
(% of AGI for various income ranges: 10.1% for AGIs below $25k, 2.2% for AGIs $25k-50k)
Percentage of individuals using paid preparers for their 2012 taxes: 41.6%
Here:
42%
State:
51%
(% for various income ranges: 40.1% for AGIs below $25k, 41.2% for AGIs $25k-50k, 43.0% for AGIs $50k-75k, 44.4% for AGIs $75k-100k, 49.4% for AGIs $100k-200k, 71.4% for AGIs over 200k)
Averages for the 2004 tax year for zip code 76549, filed in 2005:
Average Adjusted Gross Income (AGI) in 2004: $28,884 (Individual Income Tax Returns)
Here:
$28,884
State:
$47,881
Salary/wage: $28,043 (reported on 93.8% of returns)
Here:
$28,043
State:
$41,947
(% of AGI for various income ranges: 121.7% for AGIs below $10k, 95.4% for AGIs $10k-25k, 94.8% for AGIs $25k-50k, 88.2% for AGIs $50k-75k, 87.3% for AGIs $75k-100k, 66.8% for AGIs over 100k)
Taxable interest for individuals: $495 (reported on 22.5% of returns)
This zip code:
$495
Texas:
$2,255
(% of AGI for various income ranges: 0.9% for AGIs below $10k, 0.3% for AGIs $10k-25k, 0.3% for AGIs $25k-50k, 0.4% for AGIs $50k-75k, 0.3% for AGIs $75k-100k, 0.7% for AGIs over 100k)
Taxable dividends: $458 (reported on 8.9% of returns)
Here:
$458
State:
$4,261
(% of AGI for various income ranges: 0.5% for AGIs below $10k, 0.1% for AGIs $10k-25k, 0.1% for AGIs $25k-50k, 0.1% for AGIs $50k-75k, 0.1% for AGIs $75k-100k, 0.2% for AGIs over 100k)
Net capital gain/loss: +$4,001 (reported on 6.0% of returns)
Here:
+$4,001
State:
+$16,110
(% of AGI for various income ranges: 0.2% for AGIs below $10k, 0.1% for AGIs $10k-25k, 0.1% for AGIs $25k-50k, 0.2% for AGIs $50k-75k, 0.4% for AGIs $75k-100k, 7.4% for AGIs over 100k)
Profit/loss from business: +$3,250 (reported on 8.2% of returns)
Here:
+$3,250
State:
+$11,013
(% of AGI for various income ranges: 0.5% for AGIs below $10k, 1.2% for AGIs $10k-25k, 0.3% for AGIs $25k-50k, 0.9% for AGIs $50k-75k, -0.2% for AGIs $75k-100k, 4.3% for AGIs over 100k)
IRA payment deduction: $2,241 (reported on 1.8% of returns)
76549:
$2,241
Texas:
$3,120
(% of AGI for various income ranges: 0.2% for AGIs below $10k, 0.1% for AGIs $10k-25k, 0.1% for AGIs $25k-50k, 0.2% for AGIs $50k-75k, 0.2% for AGIs $75k-100k)
Self-employed pension: $9,636 (reported on 0.1% of returns)
Here:
$9,636
Texas:
$16,401
Total itemized deductions: $15,160 (30% of AGI, reported on 16.0% of returns)
Here:
$15,160
State:
$19,631
Here:
29.8% of AGI
State:
18.9% of AGI
(% of AGI for various income ranges: 7.3% for AGIs below $10k, 5.6% for AGIs $10k-25k, 9.1% for AGIs $25k-50k, 9.5% for AGIs $50k-75k, 10.2% for AGIs $75k-100k, 7.2% for AGIs over 100k)
Charity contributions deductions: $3,461 (6% of AGI, reported on 12.6% of returns)
Here:
$3,461
State:
$4,753
Here:
6.4% of AGI
State:
4.2% of AGI
(% of AGI for various income ranges: 0.4% for AGIs below $10k, 0.7% for AGIs $10k-25k, 1.5% for AGIs $25k-50k, 1.9% for AGIs $50k-75k, 2.4% for AGIs $75k-100k, 1.8% for AGIs over 100k)
Total tax: $3,434 (reported on 56.2% of returns)
76549:
$3,434
State:
$9,058
(% of AGI for various income ranges: 1.2% for AGIs below $10k, 2.6% for AGIs $10k-25k, 4.7% for AGIs $25k-50k, 7.9% for AGIs $50k-75k, 10.1% for AGIs $75k-100k, 18.0% for AGIs over 100k)
Earned income credit: $1,902 (reported on 33.4% of returns)
Here:
$1,902
State:
$2,024
Percentage of individuals using paid preparers for their 2004 taxes: 64.8%
Here:
65%
State:
57%
(% for various income ranges: 64.5% for AGIs below $10k, 69.0% for AGIs $10k-25k, 61.8% for AGIs $25k-50k, 63.7% for AGIs $50k-75k, 58.4% for AGIs $75k-100k, 60.7% for AGIs over 100k)
Likely homosexual households (counted as self-reported same-sex unmarried-partner households)
Lesbian couples: 0.1% of all households
Gay men: 0.0% of all households
Household received Food Stamps/SNAP in the past 12 months: 2,924 Household did not receive Food Stamps/SNAP in the past 12 months: 17,599
Women who had a birth in the past 12 months: 1,125 (799 now married, 327 unmarried) Women who did not have a birth in the past 12 months: 14,228 (6,832 now married, 7,377 unmarried)
Housing units in zip code 76549 with a mortgage: 7,590 (93 second mortgage, 93 both second mortgage and home equity loan) Houses without a mortgage: 32
Median monthly owner costs for units with a mortgage: $1,475 Median monthly owner costs for units without a mortgage: $528
Residents with income below the poverty level in 2022:
This zip code:
14.9%
Whole state:
14.0%
Residents with income below 50% of the poverty level in 2022:
This zip code:
6.8%
Whole state:
7.4%
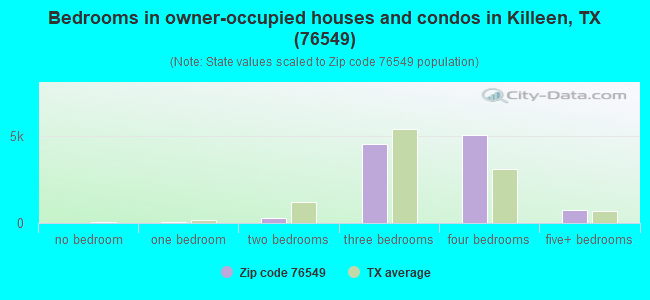
Median number of rooms in houses and condos:
Here:
6.1
State:
6.3
Median number of rooms in apartments:
Here:
4.7
State:
4.0
Notable locations in this zip code not listed on our city pages
Streams, rivers, and creeks: Bennett Branch (A), Clear Creek (B), Sycamore Branch (C), Reese Creek (D), Mill Creek (E), Glover Branch (F), Gann Branch (G). Display/hide their locations on the map
8,657 married couples with children.
7,413 single-parent households (1,084 men, 6,329 women).
76.6% of residents of 76549 zip code speak English at home.
16.6% of residents speak Spanish at home (85% very well, 11% well, 3% not well).
1.8% of residents speak other Indo-European language at home (87% very well, 13% well).
3.2% of residents speak Asian or Pacific Island language at home (79% very well, 12% well, 8% not well, 1% not at all).
1.5% of residents speak other language at home (67% very well, 29% well, 4% not well).
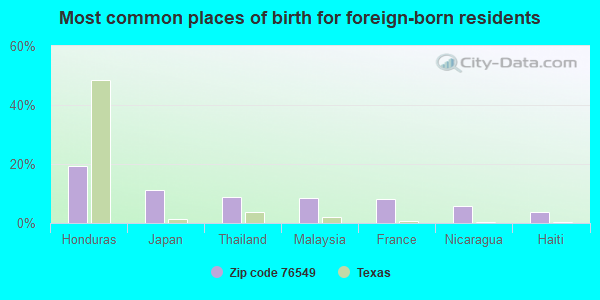
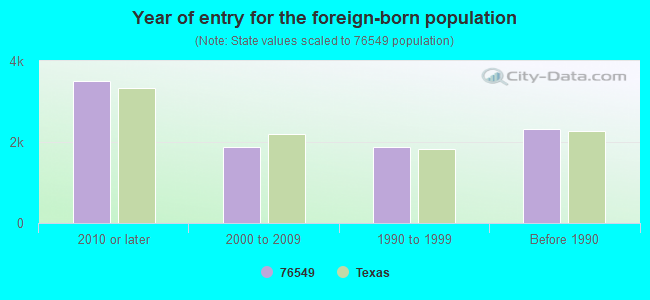
Foreign born population: 4,430 (7.7%) (69.3% of them are naturalized citizens)
Housing units lacking complete plumbing facilities: 0.7% Housing units lacking complete kitchen facilities: 1.6%
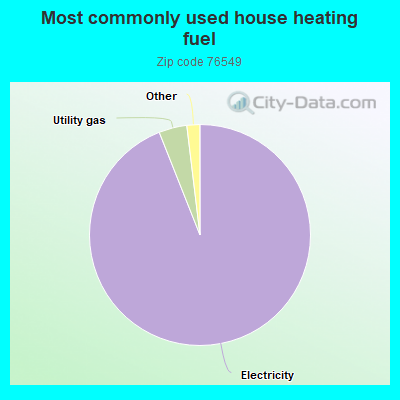
94.0%Electricity
4.1%Utility gas
Place of birth for U.S.-born residents:
This state: 20,062
Northeast: 3,911
Midwest: 5,043
South: 12,326
West: 6,872
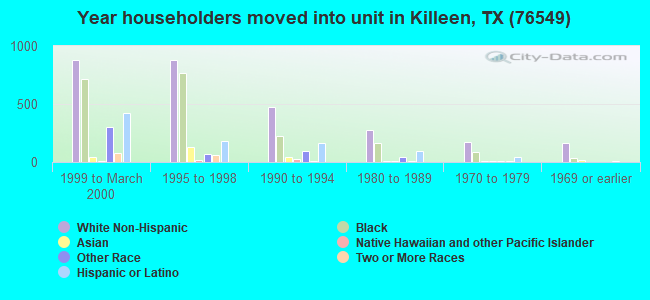
39% of the 76549 zip code residents lived in the same house 5 years ago. Out of people who lived in different houses, 40% lived in this county. Out of people who lived in different counties, 50% lived in Texas.
76% of the 76549 zip code residents lived in the same house 1 year ago. Out of people who lived in different houses, 39% moved from this county. Out of people who lived in different houses, 22% moved from different county within same state. Out of people who lived in different houses, 37% moved from different state. Out of people who lived in different houses, 4% moved from abroad.
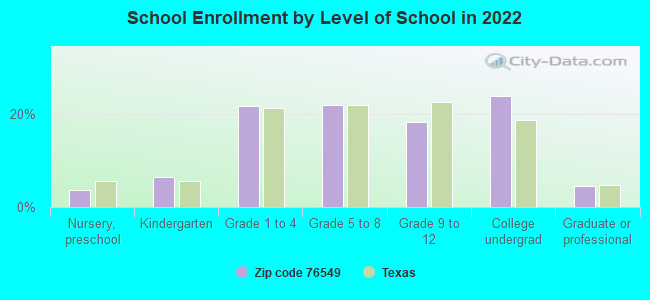
Private vs. public school enrollment:
Students in private schools in grades 1 to 8 (elementary and middle school): 345
Here:
4.5%
Texas:
8.8%
Students in private schools in grades 9 to 12 (high school): 37
Here:
1.2%
Texas:
8.0%
Students in private undergraduate colleges: 232
Here:
5.5%
Texas:
16.2%
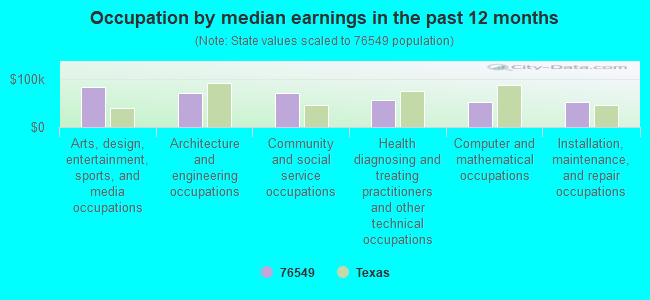
Occupation by median earnings in the past 12 months ($)
84,702Arts, design, entertainment, sports, and media occupations
72,269Architecture and engineering occupations
71,341Community and social service occupations
56,623Health diagnosing and treating practitioners and other technical occupations
52,573Computer and mathematical occupations
52,104Installation, maintenance, and repair occupations
Companies with biggest federal contracts located in this zip code (KILLEEN, TX):
CENTRAL TEXAS COLLEGE DISTRICT (6200 W CENTRAL TEXAS EXPR) : $58,991,016 in 3364 contractsfrom 1999 to 2006
Contracts for Other Education and Training Services, Education Services, Educational Services, Lectures For Training, and moreby Army, Navy, Air Force, Bureau of Prisoners/Federal Prison System, and others Signed by year:2000: $5,767,192; 2001: $11,737,318; 2002: $10,005,453; 2003: $8,417,050; 2004: $15,139,861; 2005: -$344,439; 2006: $6,224,912.
Biggest contracts:
$2,134,630 with Army for Other Education and Training Services. Signed on 2001-08-02. Completion date: 2002-06-30.
$1,500,002, same as above.Signed on 2001-03-09. Completion date: 2001-06-30.
$1,000,002, same as above.Signed on 2001-05-18. Completion date: 2001-06-30.
$804,304 with Army for Other Education and Training Services. Taking place in HI. Signed on 2005-06-03. Completion date: 2006-05-31.
GABRIELE FULKERSON (2600 GRASSLANDS DR; small business) : $182,391 in 27 contractsfrom 2000 to 2006
Contracts for Education Services, Educational Services, Chaplain Services, Other Education and Training Services by Army Signed by year:2000: $28,560; 2001: $29,999; 2002: $31,500; 2003: $33,000; 2004: $5,700; 2005: $38,618; 2006: $15,014.
Biggest contracts:
$30,250 with Army for Education Services. Signed on 2003-10-03. Completion date: 2004-09-30.
$28,560, same as above.Signed on 2000-10-06. Completion date: 2001-09-30.
$26,250 with Army for Educational Services. Signed on 2002-11-19. Completion date: 2003-09-30.
$25,000 with Army for Chaplain Services. Signed on 2001-12-11. Completion date: 2002-09-30.
CHRISTOPHER J, VAIAGAE (3010 PAINTROCK DR; small business) : $25,128 in 20 contractsfrom 2001 to 2006
Contracts for Chaplain Services, Other Social Services, Other Professional Services by Army Signed by year:2000: $0; 2001: $4,240; 2002: $5,130; 2003: $5,442; 2004: $5,150; 2005: $2,400; 2006: $2,766.
Biggest contracts:
$5,600 with Army for Chaplain Services. Signed on 2004-10-13. Completion date: 2005-09-30.
$5,472 with Army for Other Social Services. Signed on 2003-10-03. Completion date: 2004-09-30.
$5,040, same as above.Signed on 2002-10-27. Completion date: 2003-09-30.
$3,475 with Army for Chaplain Services. Signed on 2001-12-20. Completion date: 2002-09-30.
SURPLUS CITY (1106 OLD FM 440 RD; small business) : $24,346 in 3 contractsfrom 2003 to 2005
$10,446 with Army for Badges and Insignia. Signed on 2003-08-14. Completion date: 2003-08-29.
$8,400 with Army for Individual Equipment. Taking place in MS. Signed on 2005-09-06. Completion date: 2005-10-17.
$5,500 with Army for Outerwear, Men's. Signed on 2005-08-11. Completion date: 2005-08-12.
CHRISTINA MAMARIL (2806 LAWNDALE ST; small business) : $21,792 in 6 contractsfrom 2002 to 2005
Contracts for Chaplain Services, Other Social Services by Army Signed by year:2000: $0; 2001: $0; 2002: $9,540; 2003: $5,952; 2004: $6,500; 2005: -$200; 2006: $0.
Biggest contracts:
$6,500 with Army for Chaplain Services. Signed on 2004-10-04. Completion date: 2005-09-30.
$5,952, same as above.Signed on 2003-10-03. Completion date: 2004-09-30.
$4,860 with Army for Other Social Services. Signed on 2002-10-09. Completion date: 2003-09-30.
$4,680, same as above.Signed on 2002-11-05. Completion date: 2003-09-30.
L B WILSON CO , INC , THE (7117 MOUNTAINVIEW DR; small business) : $19,180 in 2 contractsin 2005
$10,000 with Army for Vehicular Furniture and Accessories. Signed on 2005-09-30. Completion date: 2005-09-30.
$9,180 with Army for Plate, Sheet, Strip, Foil; and Leaf. Signed on 2005-08-16. Completion date: 2005-08-17.
SPEEDWAY AUTO SALVAGE INC (3502 STAN SCHLUTER; small business)
$6,900 with Army for Lease or Rental of Equipment -- Ground Effect Vehicles, Motor Vehicles, Trailers, and Cycles. Signed on 2004-10-06. Completion date: 2004-10-13.
MARILYN MAY PATTERSON (LOT 20 RT 2; small business)
$6,540 with U.S. Army Corps of Engineers - civil program financing only for Recreation Site Maintenance Services (non-construction). Taking place in AL. Signed on 2001-03-13. Completion date: 2001-10-06.
QUATRINI,THOMAS (3003 THOROUGH BREAD DR; small business)
$5,000 with Army for Court Reporting Services. Signed on 2005-01-12. Completion date: 2005-01-21.
ROY D LEIFESTER (24683 FM 2670; small business)
$3,239 with Department of Defense for Lease or Rental of Facilities -- Open Storage Facilities. Signed on 2005-09-30. Completion date: 2006-09-30.
Top industries in this zip code by the number of employees in 2005:
Health Care and Social Assistance: General Medical and Surgical Hospitals (500-999 employees: 1 establishment)
Health Care and Social Assistance: Offices of Physicians (except Mental Health Specialists) (20-49: 1, 10-19: 3, 5-9: 11, 1-4: 16)
2002 - 2018 National Fire Incident Reporting System (NFIRS) incidents
According to the data from the years 2002 - 2018 the average number of fires per year is 100. The highest number of fires - 151 took place in 2018, and the least - 58 in 2009. The data has a growing trend.
When looking into fire subcategories, the most incidents belonged to: Structure Fires (41.8%), and Outside Fires (40.5%).
Fire incident types reported to NFIRS in Zip Code 76549
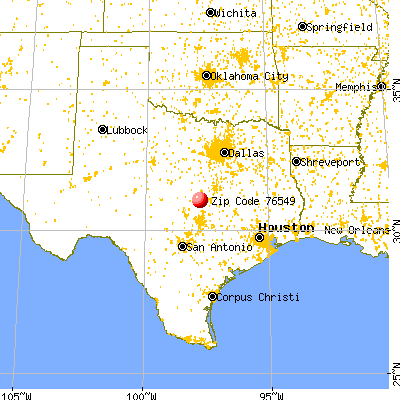


 Nearest zip codes: 76542, 78608, 76541, 76544, 76527, 76539.
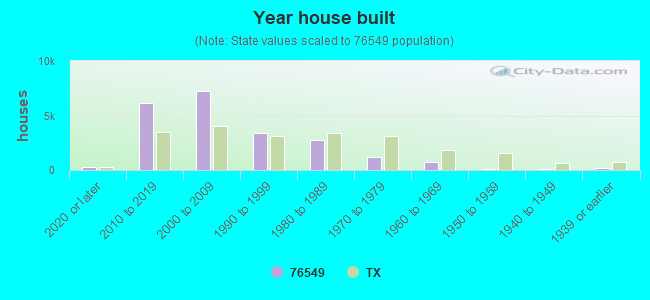


 : $58,991,016 in 3364 contracts from 1999 to 2006
 According to the data from the years 2002 - 2018 the average number of fires per year is 100. The highest number of fires - 151 took place in 2018, and the least - 58 in 2009. The data has a growing trend.
 When looking into fire subcategories, the most incidents belonged to: Structure Fires (41.8%), and Outside Fires (40.5%).