Estimated zip code population in 2022: 758 Zip code population in 2010: 1,147 Zip code population in 2000: 912
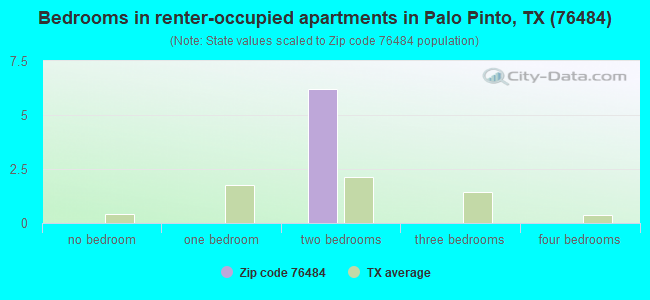
Houses and condos: 545 Renter-occupied apartments: 6
% of renters here:
2%
State:
38%
March 2022 cost of living index in zip code 76484: 76.6 (low, U.S. average is 100)
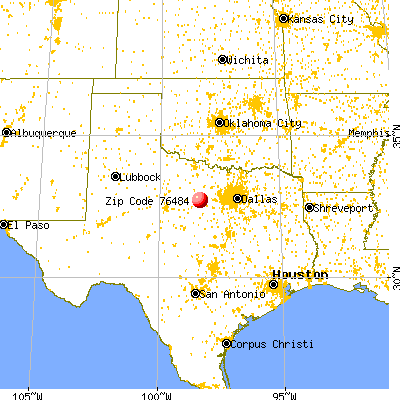
Land area: 106.4 sq. mi. Water area: 1.5 sq. mi.
Population density: 7 people per square mile
(very low).
OSM Map
General Map
Google Map
MSN Map
OSM Map
General Map
Google Map
MSN Map
OSM Map
General Map
Google Map
MSN Map
OSM Map
General Map
Google Map
MSN Map
Please wait while loading the map...
Real estate property taxes paid for housing units in 2022:
This zip code:
0.8% ($1,559)
Texas:
1.5% ($4,050)
Median real estate property taxes paid for housing units with mortgages in 2022: $3,185 (1.5%) Median real estate property taxes paid for housing units with no mortgage in 2022: $1,464 (1.0%)
Business Search- 14 Million verified businesses
Males: 384
(50.6%)
Females: 374
(49.4%)
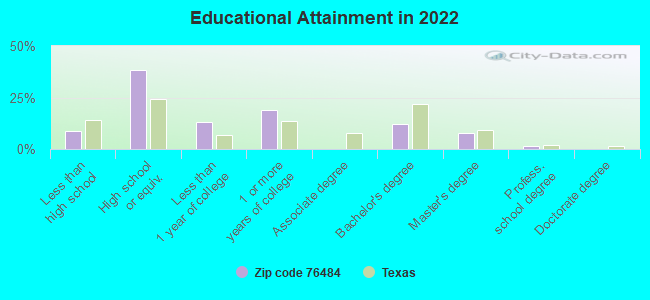
For population 25 years and over in 76484:
High school or higher: 90.5%
Bachelor's degree or higher: 21.2%
Graduate or professional degree: 9.3%
Mean travel time to work (commute): 31.5 minutes
For population 15 years and over in 76484:
Never married: 32.5%
Now married: 55.1%
Separated: 1.9%
Widowed: 8.1%
Divorced: 2.6%
Zip code 76484 compared to state average:
Unemployed percentage significantly below state average.
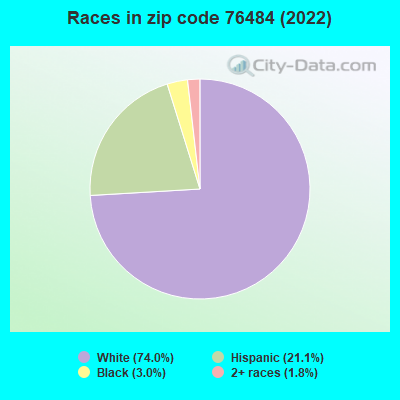
Black race population percentage significantly below state average.
Hispanic race population percentage below state average.
Median age significantly above state average.
Foreign-born population percentage significantly below state average.
Renting percentage significantly below state average.
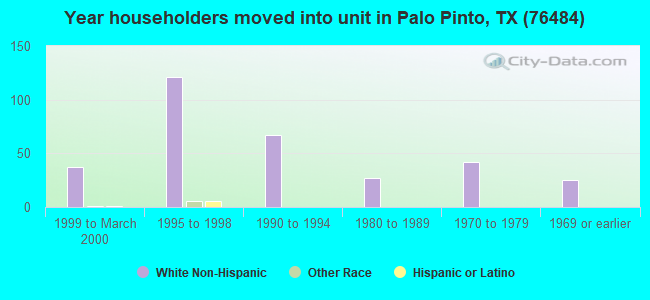
Length of stay since moving in significantly above state average.
Estimated median house/condo value in 2022: $192,317
76484:
$192,317
Texas:
$275,400
According to our research of Texas and other state lists, there were 2 registered sex offenders living in 76484 zip code as of May 02, 2024. The ratio of all residents to sex offenders in zip code 76484 is 468 to 1. The ratio of registered sex offenders to all residents in this zip code is near the state average.
Median resident age:
This zip code:
54.7 years
Texas median age:
35.6 years
Average household size:
This zip code:
2.3 people
Texas:
2.6 people
Averages for the 2020 tax year for zip code 76484, filed in 2021:
Average Adjusted Gross Income (AGI) in 2020: $66,840 (Individual Income Tax Returns)
Here:
$66,840
State:
$77,054
Salary/wage: $60,609 (reported on 68.8% of returns)
Here:
$60,609
State:
$62,766
(% of AGI for various income ranges: 999.0% for AGIs below $25k, 3201.3% for AGIs $25k-50k, 5895.0% for AGIs $50k-75k, 7468.0% for AGIs $75k-100k, 20698.0% for AGIs $100k-200k)
Taxable interest for individuals: $1,380 (reported on 31.2% of returns)
This zip code:
$1,380
Texas:
$2,665
(% of AGI for various income ranges: 23.0% for AGIs below $25k, 51.2% for AGIs $25k-50k, 27.5% for AGIs $50k-75k, 264.0% for AGIs $100k-200k)
Ordinary dividends: $4,771 (reported on 14.6% of returns)
Here:
$4,771
State:
$10,044
(% of AGI for various income ranges: 29.0% for AGIs below $25k, 32.5% for AGIs $25k-50k, 558.0% for AGIs $100k-200k)
Net capital gain/loss in AGI: +$18,157 (reported on 14.6% of returns)
Here:
+$18,157
State:
+$39,590
(% of AGI for various income ranges: 28.7% for AGIs $25k-50k, 2496.0% for AGIs $100k-200k)
Profit/loss from business: +$6,930 (reported on 20.8% of returns)
Here:
+$6,930
State:
+$10,888
(% of AGI for various income ranges: 332.0% for AGIs below $25k, 226.3% for AGIs $25k-50k, 345.0% for AGIs $50k-75k, 84.0% for AGIs $100k-200k)
Taxable individual retirement arrangement distribution: $15,480 (reported on 10.4% of returns)
76484:
$15,480
Texas:
$24,740
(% of AGI for various income ranges: 241.2% for AGIs $25k-50k, 1162.0% for AGIs $75k-100k)
Total itemized deductions: $26,233 (reported on 6.2% of returns)
Here:
$26,233
State:
$40,428
(% of AGI for various income ranges: 1967.5% for AGIs $50k-75k)
Taxes paid: $5,933 (reported on 6.2% of returns)
76484:
$5,933
State:
$7,821
(% of AGI for various income ranges: 445.0% for AGIs $50k-75k)
Earned income credit: $1,933 (reported on 12.5% of returns)
Here:
$1,933
State:
$2,584
(% of AGI for various income ranges: 80.0% for AGIs below $25k, 45.0% for AGIs $25k-50k)
Percentage of individuals using paid preparers for their 2020 taxes: 91.7%
Here:
92%
State:
92%
(% for various income ranges: 93.8% for AGIs below $25k, 90.9% for AGIs $25k-50k, 83.3% for AGIs $50k-75k, 83.3% for AGIs $75k-100k, 100.0% for AGIs $100k-200k)
Averages for the 2012 tax year for zip code 76484, filed in 2013:
Average Adjusted Gross Income (AGI) in 2012: $46,310 (Individual Income Tax Returns)
Here:
$46,310
State:
$65,384
Salary/wage: $41,675 (reported on 71.8% of returns)
Here:
$41,675
State:
$52,524
(% of AGI for various income ranges: 62.0% for AGIs below $25k, 62.8% for AGIs $25k-50k, 80.2% for AGIs $50k-75k, 75.2% for AGIs $75k-100k, 50.5% for AGIs $100k-200k)
Taxable interest for individuals: $1,400 (reported on 33.3% of returns)
This zip code:
$1,400
Texas:
$2,372
(% of AGI for various income ranges: 2.2% for AGIs below $25k, 2.6% for AGIs $25k-50k, 0.2% for AGIs $50k-75k, 0.9% for AGIs $100k-200k)
Ordinary dividends: $1,800 (reported on 12.8% of returns)
Here:
$1,800
State:
$9,721
Net capital gain/loss in AGI: +$2,680 (reported on 12.8% of returns)
Here:
+$2,680
State:
+$35,319
Profit/loss from business: +$9,491 (reported on 28.2% of returns)
Here:
+$9,491
State:
+$13,732
(% of AGI for various income ranges: 10.9% for AGIs below $25k, 13.6% for AGIs $25k-50k, 11.1% for AGIs $75k-100k)
Taxable individual retirement arrangement distribution: $7,800 (reported on 12.8% of returns)
76484:
$7,800
Texas:
$19,511
Total itemized deductions: $20,775 (28% of AGI, reported on 20.5% of returns)
Here:
$20,775
State:
$24,724
Here:
28.4% of AGI
State:
15.9% of AGI
Charity contributions: $4,017 (reported on 15.4% of returns)
Here:
$4,017
State:
$6,808
Taxes paid: $4,162 (reported on 20.5% of returns)
76484:
$4,162
State:
$6,921
Earned income credit: $1,871 (reported on 17.9% of returns)
Here:
$1,871
State:
$2,570
(% of AGI for various income ranges: 6.9% for AGIs below $25k)
Percentage of individuals using paid preparers for their 2012 taxes: 61.5%
Here:
62%
State:
51%
(% for various income ranges: 50.0% for AGIs below $25k, 66.7% for AGIs $25k-50k, 66.7% for AGIs $50k-75k, 75.0% for AGIs $75k-100k, 75.0% for AGIs $100k-200k)
Averages for the 2004 tax year for zip code 76484, filed in 2005:
Average Adjusted Gross Income (AGI) in 2004: $38,867 (Individual Income Tax Returns)
Here:
$38,867
State:
$47,881
Salary/wage: $36,589 (reported on 75.8% of returns)
Here:
$36,589
State:
$41,947
(% of AGI for various income ranges: 103.3% for AGIs below $10k, 65.2% for AGIs $10k-25k, 71.9% for AGIs $25k-50k, 84.9% for AGIs $50k-75k, 82.3% for AGIs $75k-100k, 47.7% for AGIs over 100k)
Taxable interest for individuals: $1,774 (reported on 41.2% of returns)
This zip code:
$1,774
Texas:
$2,255
(% of AGI for various income ranges: 13.1% for AGIs below $10k, 3.8% for AGIs $10k-25k, 1.8% for AGIs $25k-50k, 0.6% for AGIs $50k-75k, 0.8% for AGIs $75k-100k, 2.3% for AGIs over 100k)
Taxable dividends: $1,109 (reported on 14.6% of returns)
Here:
$1,109
State:
$4,261
Net capital gain/loss: +$5,140 (reported on 13.3% of returns)
Here:
+$5,140
State:
+$16,110
(% of AGI for various income ranges: 0.4% for AGIs below $10k, 0.2% for AGIs $25k-50k, -0.2% for AGIs $50k-75k, 12.3% for AGIs $75k-100k)
Profit/loss from business: +$5,875 (reported on 25.5% of returns)
Here:
+$5,875
State:
+$11,013
(% of AGI for various income ranges: 11.8% for AGIs below $10k, 12.9% for AGIs $10k-25k, 2.7% for AGIs $25k-50k, 1.9% for AGIs $50k-75k, 5.9% for AGIs $75k-100k)
Total itemized deductions: $16,236 (23% of AGI, reported on 19.1% of returns)
Here:
$16,236
State:
$19,631
Here:
23.2% of AGI
State:
18.9% of AGI
(% of AGI for various income ranges: 11.1% for AGIs $25k-50k, 7.6% for AGIs $50k-75k, 14.2% for AGIs $75k-100k, 6.2% for AGIs over 100k)
Charity contributions deductions: $3,000 (4% of AGI, reported on 13.6% of returns)
Here:
$3,000
State:
$4,753
Here:
4.1% of AGI
State:
4.2% of AGI
Total tax: $4,944 (reported on 76.6% of returns)
76484:
$4,944
State:
$9,058
(% of AGI for various income ranges: 3.7% for AGIs below $10k, 4.5% for AGIs $10k-25k, 6.4% for AGIs $25k-50k, 8.5% for AGIs $50k-75k, 11.0% for AGIs $75k-100k, 18.2% for AGIs over 100k)
Earned income credit: $2,000 (reported on 17.6% of returns)
Here:
$2,000
State:
$2,024
Percentage of individuals using paid preparers for their 2004 taxes: 68.6%
Here:
69%
State:
57%
(% for various income ranges: 59.4% for AGIs below $10k, 77.6% for AGIs $10k-25k, 62.6% for AGIs $25k-50k, 68.3% for AGIs $50k-75k, 66.7% for AGIs $75k-100k, 84.2% for AGIs over 100k)
Household received Food Stamps/SNAP in the past 12 months: 0 Household did not receive Food Stamps/SNAP in the past 12 months: 298
Women who had a birth in the past 12 months: 9 (0 now married, 8 unmarried) Women who did not have a birth in the past 12 months: 157 (56 now married, 101 unmarried)
Housing units in zip code 76484 with a mortgage: 55 Residents with income below the poverty level in 2022:
This zip code:
2.2%
Whole state:
14.0%
Residents with income below 50% of the poverty level in 2022:
This zip code:
2.2%
Whole state:
7.4%
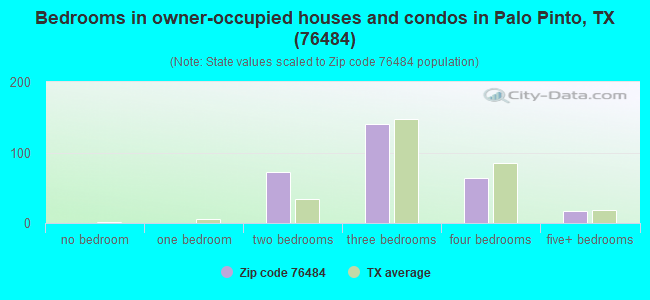
Median number of rooms in houses and condos:
Here:
6.6
State:
6.3
Notable locations in this zip code not listed on our city pages
Notable locations in zip code 76484: Worth Ranch (A), Palo Pinto County Old Jail Museum (B), Palo Pinto Fire Department (C), Lone Camp Volunteer Fire Department and First Responders (D), Palo Pinto First Responders (E), Palo Pinto County Jail (F). Display/hide their locations on the map
Streams, rivers, and creeks: Wolf Branch (A), Ward Branch (B), Town Branch (C), Rock Creek (D), Eagle Creek (E), Elm Creek (F), Little Keechi Creek (G). Display/hide their locations on the map
In group quarters: 78 (-1 institutionalized population)
Size of family households: 195 2-persons, 29 3-persons, 7 6-persons
Size of nonfamily households: 67 1-person, 3 2-persons
94.1% of residents of 76484 zip code speak English at home.
6.4% of residents speak Spanish at home (82% very well, 18% not well).
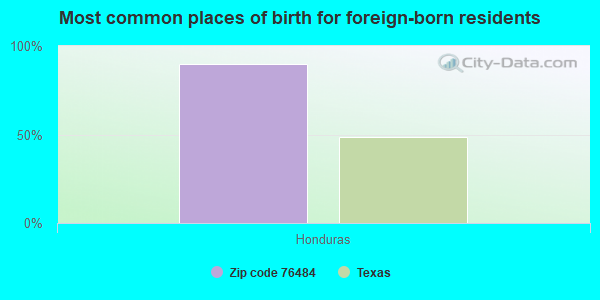
Foreign born population: 9 (1.3%) (0.0% of them are naturalized citizens)
:
1.3%
Whole state:
17.2%
90%Honduras
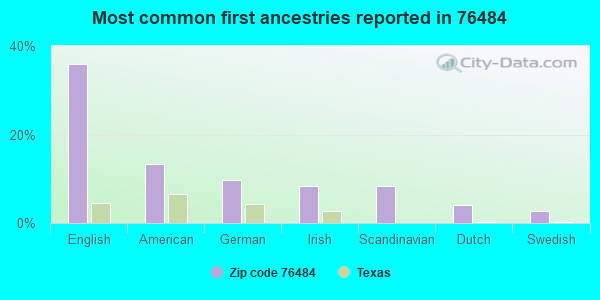
36%English
13%American
10%German
8%Irish
8%Scandinavian
4%Dutch
3%Swedish
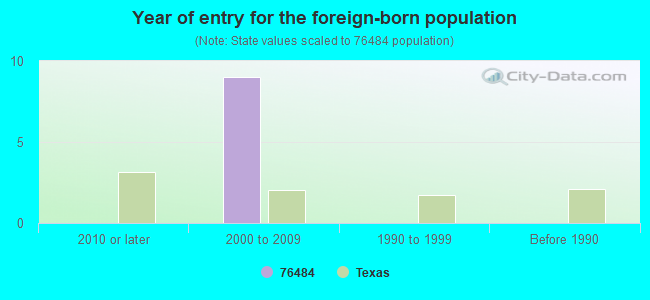
Year of entry for the foreign-born population
02010 or later
92000 to 2009
01990 to 1999
0Before 1990
Housing units lacking complete plumbing facilities: 22.5% Housing units lacking complete kitchen facilities: 21.2%
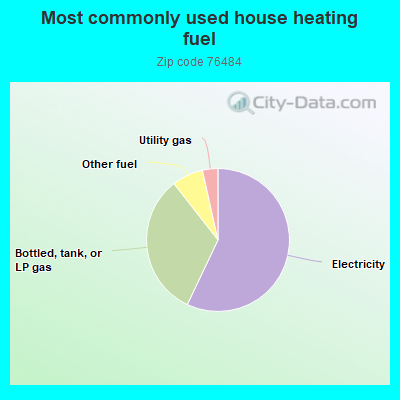
57.3%Electricity
32.5%Bottled, tank, or LP gas
7.1%Other fuel
3.5%Utility gas
Population in 1990: 867. Population change in the 1990s: +45 (+5.2%).
Place of birth for U.S.-born residents:
This state: 595
Northeast: 39
Midwest: 73
South: 18
West: 15
49% of the 76484 zip code residents lived in the same house 5 years ago. Out of people who lived in different houses, 35% lived in this county. Out of people who lived in different counties, 50% lived in Texas.
69% of the 76484 zip code residents lived in the same house 1 year ago. Out of people who lived in different houses, 32% moved from this county. Out of people who lived in different houses, 67% moved from different county within same state.
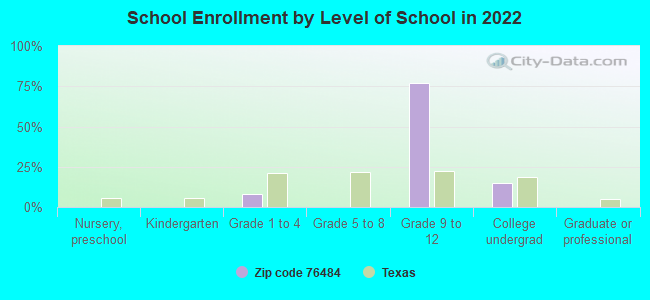
Private vs. public school enrollment:
Students in private schools in grades 1 to 8 (elementary and middle school):
Here:
0.0%
Texas:
8.8%
Students in private schools in grades 9 to 12 (high school):
Here:
0.0%
Texas:
8.0%
Students in private undergraduate colleges: 6
Here:
43.6%
Texas:
16.2%
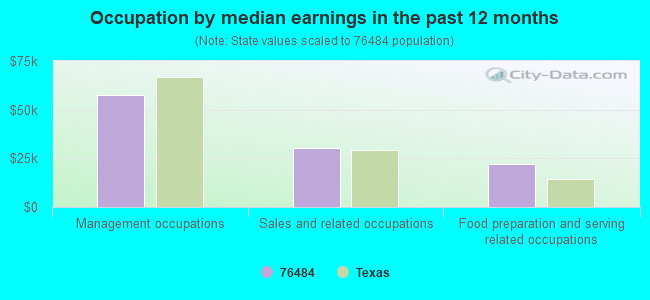
Occupation by median earnings in the past 12 months ($)
57,622Management occupations
30,536Sales and related occupations
22,141Food preparation and serving related occupations
Top industries in this zip code by the number of employees in 2005:
Utilities: Fossil Fuel Electric Power Generation (50-99 employees: 1 establishment)
Accommodation and Food Services: Full-Service Restaurants (10-19: 1, 1-4: 1)
Construction: Poured Concrete Foundation and Structure Contractors (5-9: 1)
Other Services (except Public Administration): Religious Organizations (1-4: 2)
Real Estate and Rental and Leasing: Lessors of Other Real Estate Property (1-4: 1)
Finance and Insurance: Commercial Banking (1-4: 1)
Utilities: Water Supply and Irrigation Systems (1-4: 1)
Wholesale Trade: Other Chemical and Allied Products Merchant Wholesalers (1-4: 1)
Finance and Insurance: Insurance Agencies and Brokerages (1-4: 1)
People in group quarters in 2010:
97 people in local jails and other municipal confinement facilities
People in group quarters in 2000:
106 people in local jails and other confinement facilities (including police lockups)
Fatal accident statistics in 2010:
Fatal accident count: 2
Vehicles involved in fatal accidents: 3
Fatal accidents caused by drunken drivers: 0
Fatalities: 2
Persons involved in fatal accidents: 8
Pedestrians involved in fatal accidents: 0
2003 - 2018 National Fire Incident Reporting System (NFIRS) incidents
According to the data from the years 2003 - 2018 the average number of fires per year is 28. The highest number of fire incidents - 86 took place in 2018, and the least - 1 in 2004. The data has a growing trend.
When looking into fire subcategories, the most reports belonged to: Outside Fires (76.4%), and Structure Fires (13.3%).
Fire incident types reported to NFIRS in Zip Code 76484


 Nearest zip codes: 76449, 76067, 76453, 76472, 76475, 76066.


 According to the data from the years 2003 - 2018 the average number of fires per year is 28. The highest number of fire incidents - 86 took place in 2018, and the least - 1 in 2004. The data has a growing trend.
 When looking into fire subcategories, the most reports belonged to: Outside Fires (76.4%), and Structure Fires (13.3%).