Estimated zip code population in 2022: 26,165 Zip code population in 2010: 19,395 Zip code population in 2000: 15,454
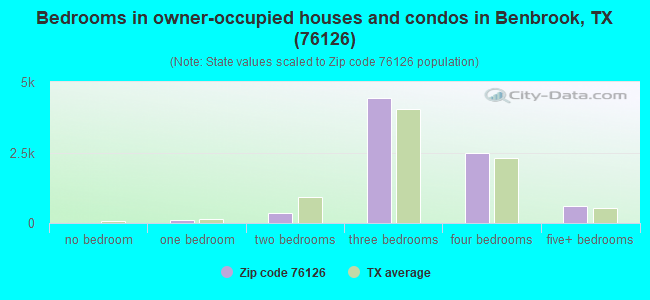
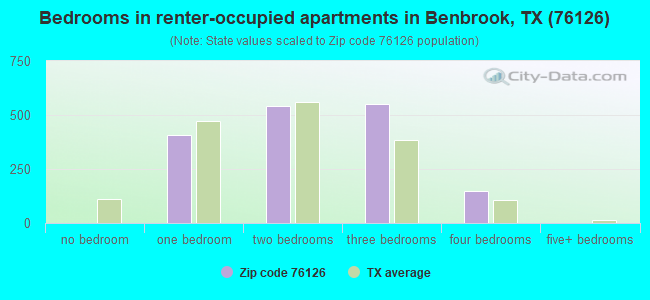
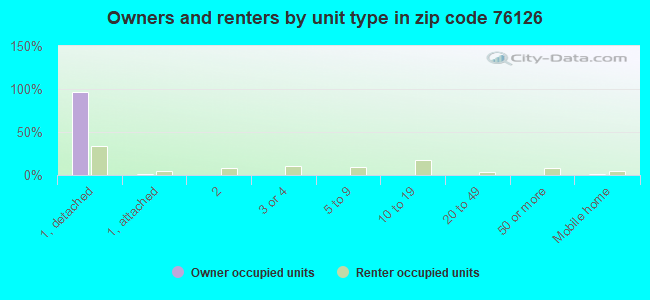
Houses and condos: 10,677 Renter-occupied apartments: 1,676
% of renters here:
17%
State:
38%
March 2022 cost of living index in zip code 76126: 95.8 (near average, U.S. average is 100)
Land area: 63.6 sq. mi. Water area: 5.8 sq. mi.
Population density: 412 people per square mile
(low).
OSM Map
General Map
Google Map
MSN Map
OSM Map
General Map
Google Map
MSN Map
OSM Map
General Map
Google Map
MSN Map
OSM Map
General Map
Google Map
MSN Map
Please wait while loading the map...
Real estate property taxes paid for housing units in 2022:
This zip code:
1.6% ($6,002)
Texas:
1.5% ($4,050)
Median real estate property taxes paid for housing units with mortgages in 2022: $6,787 (1.6%) Median real estate property taxes paid for housing units with no mortgage in 2022: $4,588 (1.5%)
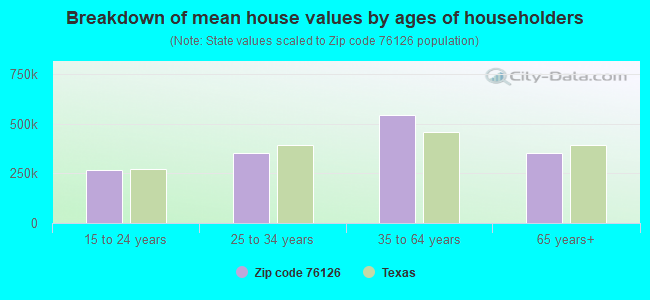
Estimated median house/condo value in 2022: $369,939
76126:
$369,939
Texas:
$275,400
According to our research of Texas and other state lists, there were 23 registered sex offenders living in 76126 zip code as of May 11, 2024. The ratio of all residents to sex offenders in zip code 76126 is 936 to 1. The ratio of registered sex offenders to all residents in this zip code is lower than the state average.
Median resident age:
This zip code:
39.1 years
Texas median age:
35.6 years
Average household size:
This zip code:
2.7 people
Texas:
2.6 people
Averages for the 2020 tax year for zip code 76126, filed in 2021:
Average Adjusted Gross Income (AGI) in 2020: $112,364 (Individual Income Tax Returns)
Here:
$112,364
State:
$77,054
Salary/wage: $91,561 (reported on 79.8% of returns)
Here:
$91,561
State:
$62,766
(% of AGI for various income ranges: 1143.0% for AGIs below $25k, 3352.9% for AGIs $25k-50k, 6167.9% for AGIs $50k-75k, 9342.7% for AGIs $75k-100k, 17538.8% for AGIs $100k-200k, 74811.6% for AGIs over 200k)
Taxable interest for individuals: $2,513 (reported on 35.9% of returns)
This zip code:
$2,513
Texas:
$2,665
(% of AGI for various income ranges: 20.6% for AGIs below $25k, 26.4% for AGIs $25k-50k, 43.0% for AGIs $50k-75k, 70.7% for AGIs $75k-100k, 130.4% for AGIs $100k-200k, 1427.1% for AGIs over 200k)
Ordinary dividends: $12,262 (reported on 26.8% of returns)
Here:
$12,262
State:
$10,044
(% of AGI for various income ranges: 51.4% for AGIs below $25k, 52.3% for AGIs $25k-50k, 92.3% for AGIs $50k-75k, 164.6% for AGIs $75k-100k, 373.3% for AGIs $100k-200k, 6157.3% for AGIs over 200k)
Net capital gain/loss in AGI: +$28,663 (reported on 25.3% of returns)
Here:
+$28,663
State:
+$39,590
(% of AGI for various income ranges: 22.5% for AGIs below $25k, 24.8% for AGIs $25k-50k, 73.0% for AGIs $50k-75k, 158.6% for AGIs $75k-100k, 486.9% for AGIs $100k-200k, 16176.9% for AGIs over 200k)
Profit/loss from business: +$19,017 (reported on 19.8% of returns)
Here:
+$19,017
State:
+$10,888
(% of AGI for various income ranges: 97.5% for AGIs below $25k, 197.7% for AGIs $25k-50k, 200.8% for AGIs $50k-75k, 404.1% for AGIs $75k-100k, 631.5% for AGIs $100k-200k, 5000.2% for AGIs over 200k)
Taxable individual retirement arrangement distribution: $22,716 (reported on 11.4% of returns)
76126:
$22,716
Texas:
$24,740
(% of AGI for various income ranges: 72.0% for AGIs below $25k, 161.2% for AGIs $25k-50k, 263.3% for AGIs $50k-75k, 405.9% for AGIs $75k-100k, 724.7% for AGIs $100k-200k, 1754.1% for AGIs over 200k)
Self-employed (Keogh) retirement plans: $26,100 (reported on 0.8% of returns)
76126:
$26,100
Texas:
$29,298
(% of AGI for various income ranges: 31.7% for AGIs $100k-200k, 452.9% for AGIs over 200k)
Total itemized deductions: $40,766 (reported on 14.2% of returns)
Here:
$40,766
State:
$40,428
(% of AGI for various income ranges: 76.5% for AGIs below $25k, 176.8% for AGIs $25k-50k, 385.0% for AGIs $50k-75k, 465.5% for AGIs $75k-100k, 1054.2% for AGIs $100k-200k, 8318.0% for AGIs over 200k)
Charity contributions: $19,486 (reported on 12.2% of returns)
Here:
$19,486
State:
$18,201
(% of AGI for various income ranges: 5.8% for AGIs below $25k, 28.9% for AGIs $25k-50k, 75.2% for AGIs $50k-75k, 96.5% for AGIs $75k-100k, 328.5% for AGIs $100k-200k, 4417.6% for AGIs over 200k)
Taxes paid: $8,246 (reported on 13.9% of returns)
76126:
$8,246
State:
$7,821
(% of AGI for various income ranges: 11.7% for AGIs below $25k, 29.8% for AGIs $25k-50k, 89.1% for AGIs $50k-75k, 119.2% for AGIs $75k-100k, 276.6% for AGIs $100k-200k, 1357.3% for AGIs over 200k)
Earned income credit: $2,065 (reported on 9.3% of returns)
Here:
$2,065
State:
$2,584
(% of AGI for various income ranges: 68.1% for AGIs below $25k, 57.4% for AGIs $25k-50k, 1.2% for AGIs $50k-75k)
Percentage of individuals using paid preparers for their 2020 taxes: 92.3%
Here:
92%
State:
92%
(% for various income ranges: 90.4% for AGIs below $25k, 92.5% for AGIs $25k-50k, 93.1% for AGIs $50k-75k, 91.7% for AGIs $75k-100k, 93.0% for AGIs $100k-200k, 93.7% for AGIs over 200k)
Averages for the 2012 tax year for zip code 76126, filed in 2013:
Average Adjusted Gross Income (AGI) in 2012: $93,900 (Individual Income Tax Returns)
Here:
$93,900
State:
$65,384
Salary/wage: $75,378 (reported on 81.7% of returns)
Here:
$75,378
State:
$52,524
(% of AGI for various income ranges: 70.7% for AGIs below $25k, 73.9% for AGIs $25k-50k, 73.8% for AGIs $50k-75k, 75.4% for AGIs $75k-100k, 78.2% for AGIs $100k-200k, 50.5% for AGIs over 200k)
Taxable interest for individuals: $1,980 (reported on 39.5% of returns)
This zip code:
$1,980
Texas:
$2,372
(% of AGI for various income ranges: 1.4% for AGIs below $25k, 0.8% for AGIs $25k-50k, 0.8% for AGIs $50k-75k, 0.9% for AGIs $75k-100k, 0.6% for AGIs $100k-200k, 1.0% for AGIs over 200k)
Ordinary dividends: $5,410 (reported on 25.2% of returns)
Here:
$5,410
State:
$9,721
(% of AGI for various income ranges: 2.1% for AGIs below $25k, 1.0% for AGIs $25k-50k, 1.3% for AGIs $50k-75k, 1.2% for AGIs $75k-100k, 1.1% for AGIs $100k-200k, 1.8% for AGIs over 200k)
Net capital gain/loss in AGI: +$27,237 (reported on 20.8% of returns)
Here:
+$27,237
State:
+$35,319
(% of AGI for various income ranges: 0.2% for AGIs $25k-50k, 0.3% for AGIs $50k-75k, 0.7% for AGIs $75k-100k, 1.2% for AGIs $100k-200k, 13.9% for AGIs over 200k)
Profit/loss from business: +$14,812 (reported on 18.9% of returns)
Here:
+$14,812
State:
+$13,732
(% of AGI for various income ranges: 7.7% for AGIs below $25k, 4.5% for AGIs $25k-50k, 3.3% for AGIs $50k-75k, 2.9% for AGIs $75k-100k, 3.1% for AGIs $100k-200k, 2.2% for AGIs over 200k)
Taxable individual retirement arrangement distribution: $17,712 (reported on 12.6% of returns)
76126:
$17,712
Texas:
$19,511
(% of AGI for various income ranges: 3.9% for AGIs below $25k, 2.9% for AGIs $25k-50k, 2.5% for AGIs $50k-75k, 2.8% for AGIs $75k-100k, 2.8% for AGIs $100k-200k, 1.7% for AGIs over 200k)
Self-employment retirement plans: $20,290 (reported on 1.0% of returns)
76126:
$20,290
Texas:
$23,938
(% of AGI for various income ranges: 0.2% for AGIs $50k-75k, 0.2% for AGIs $100k-200k, 0.3% for AGIs over 200k)
Total itemized deductions: $25,076 (15% of AGI, reported on 37.8% of returns)
Here:
$25,076
State:
$24,724
Here:
14.7% of AGI
State:
15.9% of AGI
(% of AGI for various income ranges: 10.8% for AGIs below $25k, 10.5% for AGIs $25k-50k, 11.8% for AGIs $50k-75k, 11.6% for AGIs $75k-100k, 11.8% for AGIs $100k-200k, 8.0% for AGIs over 200k)
Charity contributions: $7,062 (reported on 31.4% of returns)
Here:
$7,062
State:
$6,808
(% of AGI for various income ranges: 1.0% for AGIs below $25k, 1.6% for AGIs $25k-50k, 2.0% for AGIs $50k-75k, 2.2% for AGIs $75k-100k, 2.9% for AGIs $100k-200k, 2.4% for AGIs over 200k)
Taxes paid: $7,586 (reported on 37.2% of returns)
76126:
$7,586
State:
$6,921
(% of AGI for various income ranges: 2.5% for AGIs below $25k, 2.6% for AGIs $25k-50k, 3.0% for AGIs $50k-75k, 3.3% for AGIs $75k-100k, 3.7% for AGIs $100k-200k, 2.6% for AGIs over 200k)
Earned income credit: $2,086 (reported on 10.8% of returns)
Here:
$2,086
State:
$2,570
(% of AGI for various income ranges: 5.0% for AGIs below $25k, 0.8% for AGIs $25k-50k)
Percentage of individuals using paid preparers for their 2012 taxes: 45.4%
Here:
45%
State:
51%
(% for various income ranges: 40.4% for AGIs below $25k, 42.5% for AGIs $25k-50k, 44.8% for AGIs $50k-75k, 46.0% for AGIs $75k-100k, 47.4% for AGIs $100k-200k, 72.1% for AGIs over 200k)
Averages for the 2004 tax year for zip code 76126, filed in 2005:
Average Adjusted Gross Income (AGI) in 2004: $64,166 (Individual Income Tax Returns)
Here:
$64,166
State:
$47,881
Salary/wage: $51,863 (reported on 83.1% of returns)
Here:
$51,863
State:
$41,947
(% of AGI for various income ranges: 116.4% for AGIs below $10k, 71.5% for AGIs $10k-25k, 76.3% for AGIs $25k-50k, 80.1% for AGIs $50k-75k, 80.9% for AGIs $75k-100k, 54.3% for AGIs over 100k)
Taxable interest for individuals: $1,750 (reported on 49.0% of returns)
This zip code:
$1,750
Texas:
$2,255
(% of AGI for various income ranges: 7.9% for AGIs below $10k, 2.8% for AGIs $10k-25k, 1.7% for AGIs $25k-50k, 1.2% for AGIs $50k-75k, 0.8% for AGIs $75k-100k, 1.2% for AGIs over 100k)
Taxable dividends: $4,080 (reported on 28.2% of returns)
Here:
$4,080
State:
$4,261
(% of AGI for various income ranges: 5.1% for AGIs below $10k, 1.4% for AGIs $10k-25k, 0.8% for AGIs $25k-50k, 0.7% for AGIs $50k-75k, 0.8% for AGIs $75k-100k, 2.7% for AGIs over 100k)
Net capital gain/loss: +$15,118 (reported on 23.4% of returns)
Here:
+$15,118
State:
+$16,110
(% of AGI for various income ranges: -1.4% for AGIs below $10k, 0.4% for AGIs $10k-25k, 0.5% for AGIs $25k-50k, 0.5% for AGIs $50k-75k, 1.0% for AGIs $75k-100k, 10.8% for AGIs over 100k)
Profit/loss from business: +$12,881 (reported on 17.1% of returns)
Here:
+$12,881
State:
+$11,013
(% of AGI for various income ranges: 2.4% for AGIs below $10k, 5.8% for AGIs $10k-25k, 3.6% for AGIs $25k-50k, 2.7% for AGIs $50k-75k, 2.8% for AGIs $75k-100k, 3.7% for AGIs over 100k)
IRA payment deduction: $3,313 (reported on 3.1% of returns)
76126:
$3,313
Texas:
$3,120
(% of AGI for various income ranges: 0.2% for AGIs $10k-25k, 0.3% for AGIs $25k-50k, 0.2% for AGIs $50k-75k, 0.2% for AGIs $75k-100k, 0.1% for AGIs over 100k)
Self-employed pension: $12,988 (reported on 1.0% of returns)
Here:
$12,988
Texas:
$16,401
Total itemized deductions: $17,416 (16% of AGI, reported on 38.6% of returns)
Here:
$17,416
State:
$19,631
Here:
16.3% of AGI
State:
18.9% of AGI
(% of AGI for various income ranges: 16.0% for AGIs below $10k, 9.1% for AGIs $10k-25k, 12.3% for AGIs $25k-50k, 12.5% for AGIs $50k-75k, 12.8% for AGIs $75k-100k, 8.6% for AGIs over 100k)
Charity contributions deductions: $4,374 (4% of AGI, reported on 33.4% of returns)
Here:
$4,374
State:
$4,753
Here:
3.8% of AGI
State:
4.2% of AGI
(% of AGI for various income ranges: 0.8% for AGIs below $10k, 1.0% for AGIs $10k-25k, 1.9% for AGIs $25k-50k, 2.1% for AGIs $50k-75k, 2.4% for AGIs $75k-100k, 2.6% for AGIs over 100k)
Total tax: $10,357 (reported on 81.7% of returns)
76126:
$10,357
State:
$9,058
(% of AGI for various income ranges: 4.3% for AGIs below $10k, 4.4% for AGIs $10k-25k, 7.3% for AGIs $25k-50k, 9.5% for AGIs $50k-75k, 11.4% for AGIs $75k-100k, 17.7% for AGIs over 100k)
Earned income credit: $1,487 (reported on 9.6% of returns)
Here:
$1,487
State:
$2,024
Percentage of individuals using paid preparers for their 2004 taxes: 46.5%
Here:
47%
State:
57%
(% for various income ranges: 37.4% for AGIs below $10k, 50.8% for AGIs $10k-25k, 47.2% for AGIs $25k-50k, 45.4% for AGIs $50k-75k, 46.3% for AGIs $75k-100k, 52.3% for AGIs over 100k)
Likely homosexual households (counted as self-reported same-sex unmarried-partner households)
Lesbian couples: 0.3% of all households
Gay men: 0.0% of all households
Household received Food Stamps/SNAP in the past 12 months: 258 Household did not receive Food Stamps/SNAP in the past 12 months: 9,378
Women who had a birth in the past 12 months: 258 (208 now married, 51 unmarried) Women who did not have a birth in the past 12 months: 5,481 (3,175 now married, 2,281 unmarried)
Housing units in zip code 76126 with a mortgage: 5,329 (136 second mortgage, 128 both second mortgage and home equity loan) Houses without a mortgage: 72
Median monthly owner costs for units with a mortgage: $2,234 Median monthly owner costs for units without a mortgage: $840
Residents with income below the poverty level in 2022:
This zip code:
3.7%
Whole state:
14.0%
Residents with income below 50% of the poverty level in 2022:
This zip code:
2.3%
Whole state:
7.4%
Median number of rooms in houses and condos:
Here:
6.5
State:
6.3
Median number of rooms in apartments:
Here:
4.0
State:
4.0
Notable locations in this zip code not listed on our city pages
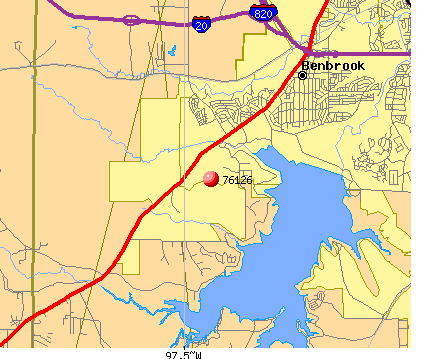
Churches in zip code 76126 include: Heritage Baptist Church (A), Longvue Baptist Church (B), Church of the Holy Apostles (C), Wheatland Baptist Church (D), Church of Christ (E), Westridge Church of the Nazarene (F), Resurrection Lutheran Church (G). Display/hide their locations on the map
Parks in zip code 76126 include: Woodlawn Park (1), Pecan Valley Park (2), Mustang Park (3), Dutch Branch Park (4), Timber Creek Park (5), Clear Fork Park (6), Boaz Park (7), Holiday Park (8). Display/hide their locations on the map
In group quarters: 106 (-1 institutionalized population)
Size of family households: 3,403 2-persons, 1,622 3-persons, 1,216 4-persons, 735 5-persons, 356 6-persons, 31 7-or-more-persons
Size of nonfamily households: 1,930 1-person, 352 2-persons, 13 3-persons
5,089 married couples with children.
1,189 single-parent households (526 men, 663 women).
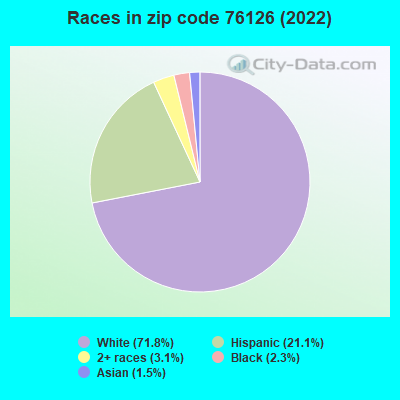
89.6% of residents of 76126 zip code speak English at home.
7.3% of residents speak Spanish at home (77% very well, 10% well, 13% not well, 1% not at all).
1.4% of residents speak other Indo-European language at home (68% very well, 19% well, 13% not well, 1% not at all).
1.1% of residents speak Asian or Pacific Island language at home (86% very well, 10% well, 4% not well).
0.7% of residents speak other language at home (100% very well).
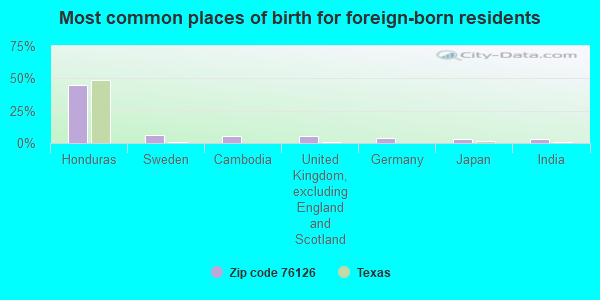
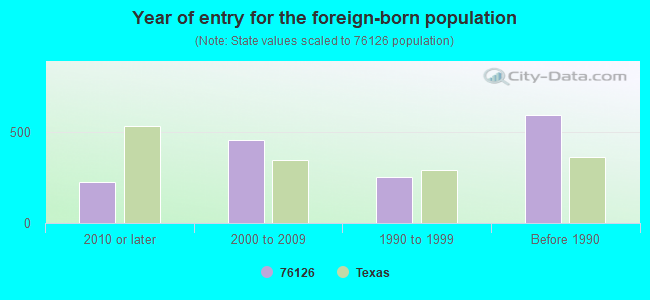
Foreign born population: 1,395 (5.3%) (59.5% of them are naturalized citizens)
Housing units lacking complete plumbing facilities: 0.6% Housing units lacking complete kitchen facilities: 4.4%
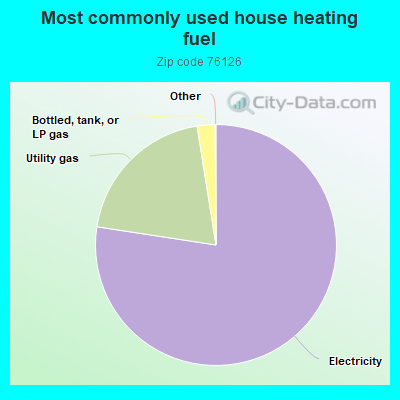
77.5%Electricity
20.1%Utility gas
2.4%Bottled, tank, or LP gas
Population in 1990: 14,301. Population change in the 1990s: +1,153 (+8.1%).
Place of birth for U.S.-born residents:
This state: 17,097
Northeast: 839
Midwest: 2,160
South: 2,252
West: 2,184
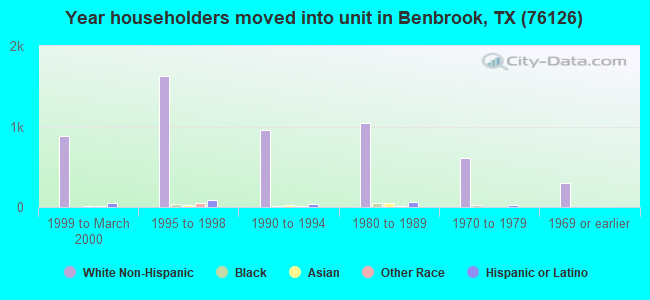
56% of the 76126 zip code residents lived in the same house 5 years ago. Out of people who lived in different houses, 57% lived in this county. Out of people who lived in different counties, 50% lived in Texas.
89% of the 76126 zip code residents lived in the same house 1 year ago. Out of people who lived in different houses, 51% moved from this county. Out of people who lived in different houses, 24% moved from different county within same state. Out of people who lived in different houses, 26% moved from different state. Out of people who lived in different houses, 1% moved from abroad.
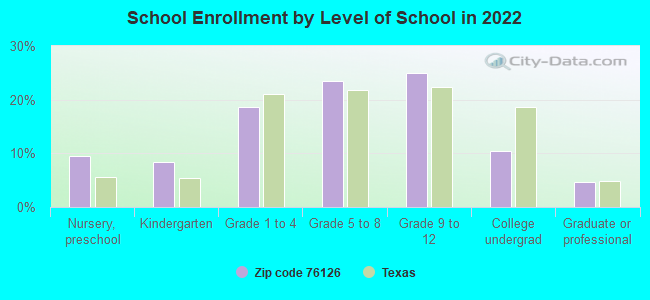
Private vs. public school enrollment:
Students in private schools in grades 1 to 8 (elementary and middle school): 592
Here:
21.6%
Texas:
8.8%
Students in private schools in grades 9 to 12 (high school): 564
Here:
34.5%
Texas:
8.0%
Students in private undergraduate colleges: 167
Here:
24.9%
Texas:
16.2%
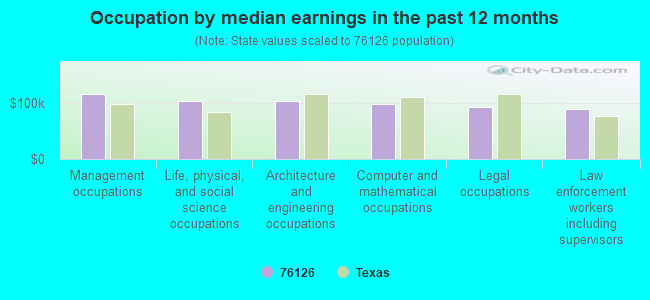
Occupation by median earnings in the past 12 months ($)
115,662Management occupations
103,124Life, physical, and social science occupations
102,895Architecture and engineering occupations
97,888Computer and mathematical occupations
93,208Legal occupations
88,891Law enforcement workers including supervisors
Companies with biggest federal contracts located in this zip code:
CERTIFIED MANUFACTURING & REPL (412 MERCEDES STE H in BENBROOK, TX; small business) : $108,283 in 7 contractsfrom 2004 to 2005
Contracts for Nails, Machine Keys, and Pins, Blocks, Tackle, Rigging, and Slings, Conveyors, Fastening Device, and moreby Defense Logistics Agency Signed by year:2000: $0; 2001: $0; 2002: $0; 2003: $0; 2004: $28,423; 2005: $79,860; 2006: $0.
Biggest contracts:
$25,951 with Defense Logistics Agency for Nails, Machine Keys, and Pins. Signed on 2005-01-28. Completion date: 2006-01-28.
$25,951, same as above.Signed on 2005-01-28. Completion date: 2006-01-28.
$22,105 with Defense Logistics Agency for Blocks, Tackle, Rigging, and Slings. Signed on 2004-12-10. Completion date: 2005-09-17.
$14,713 with Defense Logistics Agency for Conveyors. Signed on 2005-08-10. Completion date: 2006-05-18.
RODMAN, GEOFFREY A (10120 LOCKSLEY DR in FORT WORTH, TX; small business) : $106,800 in 2 contractsin 2000
$81,600 with Defense Logistics Agency for Bearings, Plain, Unmounted. Signed on 2000-09-30. Completion date: 2001-03-19.
$25,200 with Defense Logistics Agency for Gas Turbines and Jet Engines, Aircraft; Prime Moving, and Components. Signed on 2000-04-21. Completion date: 2000-06-30.
WATTS DRILLING CO L P (14310 HIGHWAY 377 S in FORT WORTH, TX; small business) : $70,770 in 2 contractsin 2004
$35,385 with U.S. Army Corps of Engineers - civil program financing only for Construction of Structures and Facilities -- Miscellaneous Buildings. Signed on 2004-07-02. Completion date: 2004-08-01.
$35,385 with Army for Construction of Structures and Facilities -- Miscellaneous Buildings. Signed on 2004-07-02. Completion date: 2004-08-01.
HOLBROOKS, DAVID KENT (8295 MCDANIEL RD in FORT WORTH, TX; small business) : $27,520 in 2 contractsfrom 2001 to 2006
$20,320 with Army for Construction of Structures and Facilities -- Recreation Facilities (Non-Building). Signed on 2006-06-21. Completion date: 2006-09-29.
$7,200 with U.S. Army Corps of Engineers - civil program financing only for Maintenance, Repair or Alteration of Real Property -- Office Buildings. Signed on 2001-04-24. Completion date: 2001-04-23.
CLEAN PRODUCTS INC (412 MERCEDES ST STE G in FORT WORTH, TX; small business)
$22,796 with Air Force for Miscellaneous Maintenance and Repair Shop Specialized Equipment. Taking place in OK. Signed on 2005-11-15. Completion date: 2006-01-23.
FTA MANUFACTURING INC (14485 REAR HIGHWAY 377 S in FORT WORTH, TX; small business) : $16,379 in 3 contractsfrom 2004 to 2006
$9,240 with Defense Logistics Agency for Airframe Structural Components. Signed on 2004-10-16. Completion date: 2005-02-19.
$3,678 with Defense Logistics Agency for Aircraft Landing Gear Components. Signed on 2006-03-30. Completion date: 2006-07-28.
$3,461 with Defense Logistics Agency for Airframe Structural Components. Signed on 2005-02-11. Completion date: 2005-05-25.
DURON, TWILLA & RUFUS (248 LANSFORD DR in FORT WORTH, TX; small business)
$11,400 with Army for Recreation Site Maintenance Services (non-construction). Signed on 2006-03-08. Completion date: 2006-10-01.
STILLWATER CONTRACT SERVICES, (4313 CAPRA WAY in FORT WORTH, TX; small business)
$9,950 with Army for Clothing, Special Purpose. Signed on 2003-09-10. Completion date: 2003-10-10.
EARTHWAVE PRODUCTIONS INC (16151 S HIGHWAY 377 in FORT WORTH, TX; small business)
$7,500 with U.S. Army Corps of Engineers - civil program financing only for Film/Video Tape Production Services. Signed on 2001-08-20. Completion date: 2001-11-01.
DIGITAL ALCHEMY (992 WINSCOTT RD in FORT WORTH, TX; small business)
$6,200 with Air Force for ADP Software. Signed on 2005-09-28. Completion date: 2005-10-28.
Top industries in this zip code by the number of employees in 2005:
Mining: Support Activities for Oil and Gas Operations (250-499 employees: 1 establishment, 1-4 employees: 1 establishment)
2002 - 2018 National Fire Incident Reporting System (NFIRS) incidents
Based on the data from the years 2002 - 2018 the average number of fires per year is 53. The highest number of fire incidents - 130 took place in 2011, and the least - 7 in 2002. The data has a growing trend.
When looking into fire subcategories, the most incidents belonged to: Outside Fires (58.2%), and Structure Fires (26.5%).
Fire incident types reported to NFIRS in Zip Code 76126

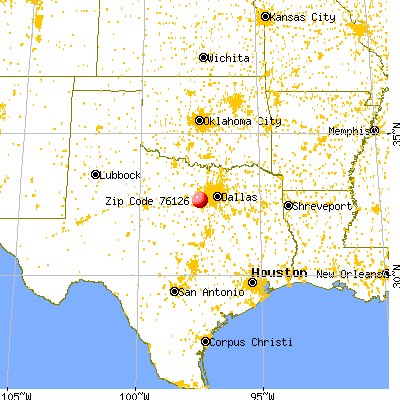


 Nearest zip codes: 76132, 76036, 76116, 76123, 76133, 76109.


 : $108,283 in 7 contracts from 2004 to 2005

 Based on the data from the years 2002 - 2018 the average number of fires per year is 53. The highest number of fire incidents - 130 took place in 2011, and the least - 7 in 2002. The data has a growing trend.
 When looking into fire subcategories, the most incidents belonged to: Outside Fires (58.2%), and Structure Fires (26.5%).