Estimated zip code population in 2022: 47,607
Zip code population in 2010: 44,724
Zip code population in 2000: 42,060
Houses and condos: 17,496
Renter-occupied apartments: 5,488
% of renters here:
33%State:
38%
March 2022 cost of living index in zip code 76017: 95.2
(near average, U.S. average is 100)
Land area: 10.4
sq. mi.
Water area: 0.0
sq. mi.
Population density: 4,580 people per square mile (average).
OSM Map
General Map
Google Map
MSN Map
OSM Map
General Map
Google Map
MSN Map
OSM Map
General Map
Google Map
MSN Map
OSM Map
General Map
Google Map
MSN Map
Please wait while loading the map...
Real estate property taxes paid for housing units in 2022:
This zip code:
1.6% ($4,772)Texas:
1.5% ($4,050)
Median real estate property taxes paid for housing units with mortgages in 2022: $4,770 (1.6%)
Median real estate property taxes paid for housing units with no mortgage in 2022: $4,943 (1.7%)
Profiles of local businesses
Business Search - 14 Million verified businesses
Males: 23,245 Females: 24,361
For population 25 years and over in 76017:
High school or higher: 93.2%Bachelor's degree or higher: 36.7%Graduate or professional degree: 12.1%Unemployed: 4.3%Mean travel time to work (commute): 28.7 minutes
For population 15 years and over in 76017:
Never married: 35.1%Now married: 46.9%Separated: 1.1%Widowed: 4.9%Divorced: 12.0%
Zip code 76017 compared to state average:
Black race population percentage above state average. Hispanic race population percentage below state average. Length of stay since moving in significantly above state average. 24,387 51.2% White 9,716 20.4% Black 8,281 17.4% Hispanic or Latino 3,023 6.4% Asian 1,878 3.9% Two or more races 141 0.3% American Indian 158 0.3% Some other race 20 0.04% Native Hawaiian and Other
Data:
Median household income ($)
Median household income (% change since 2000)
Household income diversity
Ratio of average income to average house value (%)
Ratio of average income to average rent
Median household income ($) - White
Median household income ($) - Black or African American
Median household income ($) - Asian
Median household income ($) - Hispanic or Latino
Median household income ($) - American Indian and Alaska Native
Median household income ($) - Multirace
Median household income ($) - Other Race
Median household income for houses/condos with a mortgage ($)
Median household income for apartments without a mortgage ($)
Races - White alone (%)
Races - White alone (% change since 2000)
Races - Black alone (%)
Races - Black alone (% change since 2000)
Races - American Indian alone (%)
Races - American Indian alone (% change since 2000)
Races - Asian alone (%)
Races - Asian alone (% change since 2000)
Races - Hispanic (%)
Races - Hispanic (% change since 2000)
Races - Native Hawaiian and Other Pacific Islander alone (%)
Races - Native Hawaiian and Other Pacific Islander alone (% change since 2000)
Races - Two or more races (%)
Races - Two or more races (% change since 2000)
Races - Other race alone (%)
Races - Other race alone (% change since 2000)
Racial diversity
Unemployment (%)
Unemployment (% change since 2000)
Unemployment (%) - White
Unemployment (%) - Black or African American
Unemployment (%) - Asian
Unemployment (%) - Hispanic or Latino
Unemployment (%) - American Indian and Alaska Native
Unemployment (%) - Multirace
Unemployment (%) - Other Race
Population density (people per square mile)
Population - Males (%)
Population - Females (%)
Population - Males (%) - White
Population - Males (%) - Black or African American
Population - Males (%) - Asian
Population - Males (%) - Hispanic or Latino
Population - Males (%) - American Indian and Alaska Native
Population - Males (%) - Multirace
Population - Males (%) - Other Race
Population - Females (%) - White
Population - Females (%) - Black or African American
Population - Females (%) - Asian
Population - Females (%) - Hispanic or Latino
Population - Females (%) - American Indian and Alaska Native
Population - Females (%) - Multirace
Population - Females (%) - Other Race
Coronavirus confirmed cases (May 05, 2024)
Deaths caused by coronavirus (May 05, 2024)
Coronavirus confirmed cases (per 100k population) (May 05, 2024)
Deaths caused by coronavirus (per 100k population) (May 05, 2024)
Daily increase in number of cases (May 05, 2024)
Weekly increase in number of cases (May 05, 2024)
Cases doubled (in days) (May 05, 2024)
Hospitalized patients (Apr 18, 2022)
Negative test results (Apr 18, 2022)
Total test results (Apr 18, 2022)
COVID Vaccine doses distributed (per 100k population) (Sep 19, 2023)
COVID Vaccine doses administered (per 100k population) (Sep 19, 2023)
COVID Vaccine doses distributed (Sep 19, 2023)
COVID Vaccine doses administered (Sep 19, 2023)
Likely homosexual households (%)
Likely homosexual households (% change since 2000)
Likely homosexual households - Lesbian couples (%)
Likely homosexual households - Lesbian couples (% change since 2000)
Likely homosexual households - Gay men (%)
Likely homosexual households - Gay men (% change since 2000)
Cost of living index
Median gross rent ($)
Median contract rent ($)
Median monthly housing costs ($)
Median house or condo value ($)
Median house or condo value ($ change since 2000)
Mean house or condo value by units in structure - 1, detached ($)
Mean house or condo value by units in structure - 1, attached ($)
Mean house or condo value by units in structure - 2 ($)
Mean house or condo value by units in structure by units in structure - 3 or 4 ($)
Mean house or condo value by units in structure - 5 or more ($)
Mean house or condo value by units in structure - Boat, RV, van, etc. ($)
Mean house or condo value by units in structure - Mobile home ($)
Median house or condo value ($) - White
Median house or condo value ($) - Black or African American
Median house or condo value ($) - Asian
Median house or condo value ($) - Hispanic or Latino
Median house or condo value ($) - American Indian and Alaska Native
Median house or condo value ($) - Multirace
Median house or condo value ($) - Other Race
Median resident age
Resident age diversity
Median resident age - Males
Median resident age - Females
Median resident age - White
Median resident age - Black or African American
Median resident age - Asian
Median resident age - Hispanic or Latino
Median resident age - American Indian and Alaska Native
Median resident age - Multirace
Median resident age - Other Race
Median resident age - Males - White
Median resident age - Males - Black or African American
Median resident age - Males - Asian
Median resident age - Males - Hispanic or Latino
Median resident age - Males - American Indian and Alaska Native
Median resident age - Males - Multirace
Median resident age - Males - Other Race
Median resident age - Females - White
Median resident age - Females - Black or African American
Median resident age - Females - Asian
Median resident age - Females - Hispanic or Latino
Median resident age - Females - American Indian and Alaska Native
Median resident age - Females - Multirace
Median resident age - Females - Other Race
Commute - mean travel time to work (minutes)
Travel time to work - Less than 5 minutes (%)
Travel time to work - Less than 5 minutes (% change since 2000)
Travel time to work - 5 to 9 minutes (%)
Travel time to work - 5 to 9 minutes (% change since 2000)
Travel time to work - 10 to 19 minutes (%)
Travel time to work - 10 to 19 minutes (% change since 2000)
Travel time to work - 20 to 29 minutes (%)
Travel time to work - 20 to 29 minutes (% change since 2000)
Travel time to work - 30 to 39 minutes (%)
Travel time to work - 30 to 39 minutes (% change since 2000)
Travel time to work - 40 to 59 minutes (%)
Travel time to work - 40 to 59 minutes (% change since 2000)
Travel time to work - 60 to 89 minutes (%)
Travel time to work - 60 to 89 minutes (% change since 2000)
Travel time to work - 90 or more minutes (%)
Travel time to work - 90 or more minutes (% change since 2000)
Marital status - Never married (%)
Marital status - Now married (%)
Marital status - Separated (%)
Marital status - Widowed (%)
Marital status - Divorced (%)
Median family income ($)
Median family income (% change since 2000)
Median non-family income ($)
Median non-family income (% change since 2000)
Median per capita income ($)
Median per capita income (% change since 2000)
Median family income ($) - White
Median family income ($) - Black or African American
Median family income ($) - Asian
Median family income ($) - Hispanic or Latino
Median family income ($) - American Indian and Alaska Native
Median family income ($) - Multirace
Median family income ($) - Other Race
Median year house/condo built
Median year apartment built
Year house built - Built 2005 or later (%)
Year house built - Built 2000 to 2004 (%)
Year house built - Built 1990 to 1999 (%)
Year house built - Built 1980 to 1989 (%)
Year house built - Built 1970 to 1979 (%)
Year house built - Built 1960 to 1969 (%)
Year house built - Built 1950 to 1959 (%)
Year house built - Built 1940 to 1949 (%)
Year house built - Built 1939 or earlier (%)
Average household size
Household density (households per square mile)
Average household size - White
Average household size - Black or African American
Average household size - Asian
Average household size - Hispanic or Latino
Average household size - American Indian and Alaska Native
Average household size - Multirace
Average household size - Other Race
Occupied housing units (%)
Vacant housing units (%)
Owner occupied housing units (%)
Renter occupied housing units (%)
Vacancy status - For rent (%)
Vacancy status - For sale only (%)
Vacancy status - Rented or sold, not occupied (%)
Vacancy status - For seasonal, recreational, or occasional use (%)
Vacancy status - For migrant workers (%)
Vacancy status - Other vacant (%)
Residents with income below the poverty level (%)
Residents with income below 50% of the poverty level (%)
Children below poverty level (%)
Poor families by family type - Married-couple family (%)
Poor families by family type - Male, no wife present (%)
Poor families by family type - Female, no husband present (%)
Poverty status for native-born residents (%)
Poverty status for foreign-born residents (%)
Poverty among high school graduates not in families (%)
Poverty among people who did not graduate high school not in families (%)
Residents with income below the poverty level (%) - White
Residents with income below the poverty level (%) - Black or African American
Residents with income below the poverty level (%) - Asian
Residents with income below the poverty level (%) - Hispanic or Latino
Residents with income below the poverty level (%) - American Indian and Alaska Native
Residents with income below the poverty level (%) - Multirace
Residents with income below the poverty level (%) - Other Race
Air pollution - Air Quality Index (AQI)
Air pollution - CO
Air pollution - NO2
Air pollution - SO2
Air pollution - Ozone
Air pollution - PM10
Air pollution - PM25
Air pollution - Pb
Crime - Murders per 100,000 population
Crime - Rapes per 100,000 population
Crime - Robberies per 100,000 population
Crime - Assaults per 100,000 population
Crime - Burglaries per 100,000 population
Crime - Thefts per 100,000 population
Crime - Auto thefts per 100,000 population
Crime - Arson per 100,000 population
Crime - City-data.com crime index
Crime - Violent crime index
Crime - Property crime index
Crime - Murders per 100,000 population (5 year average)
Crime - Rapes per 100,000 population (5 year average)
Crime - Robberies per 100,000 population (5 year average)
Crime - Assaults per 100,000 population (5 year average)
Crime - Burglaries per 100,000 population (5 year average)
Crime - Thefts per 100,000 population (5 year average)
Crime - Auto thefts per 100,000 population (5 year average)
Crime - Arson per 100,000 population (5 year average)
Crime - City-data.com crime index (5 year average)
Crime - Violent crime index (5 year average)
Crime - Property crime index (5 year average)
1996 Presidential Elections Results (%) - Democratic Party (Clinton)
1996 Presidential Elections Results (%) - Republican Party (Dole)
1996 Presidential Elections Results (%) - Other
2000 Presidential Elections Results (%) - Democratic Party (Gore)
2000 Presidential Elections Results (%) - Republican Party (Bush)
2000 Presidential Elections Results (%) - Other
2004 Presidential Elections Results (%) - Democratic Party (Kerry)
2004 Presidential Elections Results (%) - Republican Party (Bush)
2004 Presidential Elections Results (%) - Other
2008 Presidential Elections Results (%) - Democratic Party (Obama)
2008 Presidential Elections Results (%) - Republican Party (McCain)
2008 Presidential Elections Results (%) - Other
2012 Presidential Elections Results (%) - Democratic Party (Obama)
2012 Presidential Elections Results (%) - Republican Party (Romney)
2012 Presidential Elections Results (%) - Other
2016 Presidential Elections Results (%) - Democratic Party (Clinton)
2016 Presidential Elections Results (%) - Republican Party (Trump)
2016 Presidential Elections Results (%) - Other
2020 Presidential Elections Results (%) - Democratic Party (Biden)
2020 Presidential Elections Results (%) - Republican Party (Trump)
2020 Presidential Elections Results (%) - Other
Ancestries Reported - Arab (%)
Ancestries Reported - Czech (%)
Ancestries Reported - Danish (%)
Ancestries Reported - Dutch (%)
Ancestries Reported - English (%)
Ancestries Reported - French (%)
Ancestries Reported - French Canadian (%)
Ancestries Reported - German (%)
Ancestries Reported - Greek (%)
Ancestries Reported - Hungarian (%)
Ancestries Reported - Irish (%)
Ancestries Reported - Italian (%)
Ancestries Reported - Lithuanian (%)
Ancestries Reported - Norwegian (%)
Ancestries Reported - Polish (%)
Ancestries Reported - Portuguese (%)
Ancestries Reported - Russian (%)
Ancestries Reported - Scotch-Irish (%)
Ancestries Reported - Scottish (%)
Ancestries Reported - Slovak (%)
Ancestries Reported - Subsaharan African (%)
Ancestries Reported - Swedish (%)
Ancestries Reported - Swiss (%)
Ancestries Reported - Ukrainian (%)
Ancestries Reported - United States (%)
Ancestries Reported - Welsh (%)
Ancestries Reported - West Indian (%)
Ancestries Reported - Other (%)
Educational Attainment - No schooling completed (%)
Educational Attainment - Less than high school (%)
Educational Attainment - High school or equivalent (%)
Educational Attainment - Less than 1 year of college (%)
Educational Attainment - 1 or more years of college (%)
Educational Attainment - Associate degree (%)
Educational Attainment - Bachelor's degree (%)
Educational Attainment - Master's degree (%)
Educational Attainment - Professional school degree (%)
Educational Attainment - Doctorate degree (%)
School Enrollment - Nursery, preschool (%)
School Enrollment - Kindergarten (%)
School Enrollment - Grade 1 to 4 (%)
School Enrollment - Grade 5 to 8 (%)
School Enrollment - Grade 9 to 12 (%)
School Enrollment - College undergrad (%)
School Enrollment - Graduate or professional (%)
School Enrollment - Not enrolled in school (%)
School enrollment - Public schools (%)
School enrollment - Private schools (%)
School enrollment - Not enrolled (%)
Median number of rooms in houses and condos
Median number of rooms in apartments
Housing units lacking complete plumbing facilities (%)
Housing units lacking complete kitchen facilities (%)
Density of houses
Urban houses (%)
Rural houses (%)
Households with people 60 years and over (%)
Households with people 65 years and over (%)
Households with people 75 years and over (%)
Households with one or more nonrelatives (%)
Households with no nonrelatives (%)
Population in households (%)
Family households (%)
Nonfamily households (%)
Population in families (%)
Family households with own children (%)
Median number of bedrooms in owner occupied houses
Mean number of bedrooms in owner occupied houses
Median number of bedrooms in renter occupied houses
Mean number of bedrooms in renter occupied houses
Median number of vehichles in owner occupied houses
Mean number of vehichles in owner occupied houses
Median number of vehichles in renter occupied houses
Mean number of vehichles in renter occupied houses
Mortgage status - with mortgage (%)
Mortgage status - with second mortgage (%)
Mortgage status - with home equity loan (%)
Mortgage status - with both second mortgage and home equity loan (%)
Mortgage status - without a mortgage (%)
Average family size
Average family size - White
Average family size - Black or African American
Average family size - Asian
Average family size - Hispanic or Latino
Average family size - American Indian and Alaska Native
Average family size - Multirace
Average family size - Other Race
Geographical mobility - Same house 1 year ago (%)
Geographical mobility - Moved within same county (%)
Geographical mobility - Moved from different county within same state (%)
Geographical mobility - Moved from different state (%)
Geographical mobility - Moved from abroad (%)
Place of birth - Born in state of residence (%)
Place of birth - Born in other state (%)
Place of birth - Native, outside of US (%)
Place of birth - Foreign born (%)
Housing units in structures - 1, detached (%)
Housing units in structures - 1, attached (%)
Housing units in structures - 2 (%)
Housing units in structures - 3 or 4 (%)
Housing units in structures - 5 to 9 (%)
Housing units in structures - 10 to 19 (%)
Housing units in structures - 20 to 49 (%)
Housing units in structures - 50 or more (%)
Housing units in structures - Mobile home (%)
Housing units in structures - Boat, RV, van, etc. (%)
House/condo owner moved in on average (years ago)
Renter moved in on average (years ago)
Year householder moved into unit - Moved in 1999 to March 2000 (%)
Year householder moved into unit - Moved in 1995 to 1998 (%)
Year householder moved into unit - Moved in 1990 to 1994 (%)
Year householder moved into unit - Moved in 1980 to 1989 (%)
Year householder moved into unit - Moved in 1970 to 1979 (%)
Year householder moved into unit - Moved in 1969 or earlier (%)
Means of transportation to work - Drove car alone (%)
Means of transportation to work - Carpooled (%)
Means of transportation to work - Public transportation (%)
Means of transportation to work - Bus or trolley bus (%)
Means of transportation to work - Streetcar or trolley car (%)
Means of transportation to work - Subway or elevated (%)
Means of transportation to work - Railroad (%)
Means of transportation to work - Ferryboat (%)
Means of transportation to work - Taxicab (%)
Means of transportation to work - Motorcycle (%)
Means of transportation to work - Bicycle (%)
Means of transportation to work - Walked (%)
Means of transportation to work - Other means (%)
Working at home (%)
Industry diversity
Most Common Industries - Agriculture, forestry, fishing and hunting, and mining (%)
Most Common Industries - Agriculture, forestry, fishing and hunting (%)
Most Common Industries - Mining, quarrying, and oil and gas extraction (%)
Most Common Industries - Construction (%)
Most Common Industries - Manufacturing (%)
Most Common Industries - Wholesale trade (%)
Most Common Industries - Retail trade (%)
Most Common Industries - Transportation and warehousing, and utilities (%)
Most Common Industries - Transportation and warehousing (%)
Most Common Industries - Utilities (%)
Most Common Industries - Information (%)
Most Common Industries - Finance and insurance, and real estate and rental and leasing (%)
Most Common Industries - Finance and insurance (%)
Most Common Industries - Real estate and rental and leasing (%)
Most Common Industries - Professional, scientific, and management, and administrative and waste management services (%)
Most Common Industries - Professional, scientific, and technical services (%)
Most Common Industries - Management of companies and enterprises (%)
Most Common Industries - Administrative and support and waste management services (%)
Most Common Industries - Educational services, and health care and social assistance (%)
Most Common Industries - Educational services (%)
Most Common Industries - Health care and social assistance (%)
Most Common Industries - Arts, entertainment, and recreation, and accommodation and food services (%)
Most Common Industries - Arts, entertainment, and recreation (%)
Most Common Industries - Accommodation and food services (%)
Most Common Industries - Other services, except public administration (%)
Most Common Industries - Public administration (%)
Occupation diversity
Most Common Occupations - Management, business, science, and arts occupations (%)
Most Common Occupations - Management, business, and financial occupations (%)
Most Common Occupations - Management occupations (%)
Most Common Occupations - Business and financial operations occupations (%)
Most Common Occupations - Computer, engineering, and science occupations (%)
Most Common Occupations - Computer and mathematical occupations (%)
Most Common Occupations - Architecture and engineering occupations (%)
Most Common Occupations - Life, physical, and social science occupations (%)
Most Common Occupations - Education, legal, community service, arts, and media occupations (%)
Most Common Occupations - Community and social service occupations (%)
Most Common Occupations - Legal occupations (%)
Most Common Occupations - Education, training, and library occupations (%)
Most Common Occupations - Arts, design, entertainment, sports, and media occupations (%)
Most Common Occupations - Healthcare practitioners and technical occupations (%)
Most Common Occupations - Health diagnosing and treating practitioners and other technical occupations (%)
Most Common Occupations - Health technologists and technicians (%)
Most Common Occupations - Service occupations (%)
Most Common Occupations - Healthcare support occupations (%)
Most Common Occupations - Protective service occupations (%)
Most Common Occupations - Fire fighting and prevention, and other protective service workers including supervisors (%)
Most Common Occupations - Law enforcement workers including supervisors (%)
Most Common Occupations - Food preparation and serving related occupations (%)
Most Common Occupations - Building and grounds cleaning and maintenance occupations (%)
Most Common Occupations - Personal care and service occupations (%)
Most Common Occupations - Sales and office occupations (%)
Most Common Occupations - Sales and related occupations (%)
Most Common Occupations - Office and administrative support occupations (%)
Most Common Occupations - Natural resources, construction, and maintenance occupations (%)
Most Common Occupations - Farming, fishing, and forestry occupations (%)
Most Common Occupations - Construction and extraction occupations (%)
Most Common Occupations - Installation, maintenance, and repair occupations (%)
Most Common Occupations - Production, transportation, and material moving occupations (%)
Most Common Occupations - Production occupations (%)
Most Common Occupations - Transportation occupations (%)
Most Common Occupations - Material moving occupations (%)
People in Group quarters - Institutionalized population (%)
People in Group quarters - Correctional institutions (%)
People in Group quarters - Federal prisons and detention centers (%)
People in Group quarters - Halfway houses (%)
People in Group quarters - Local jails and other confinement facilities (including police lockups) (%)
People in Group quarters - Military disciplinary barracks (%)
People in Group quarters - State prisons (%)
People in Group quarters - Other types of correctional institutions (%)
People in Group quarters - Nursing homes (%)
People in Group quarters - Hospitals/wards, hospices, and schools for the handicapped (%)
People in Group quarters - Hospitals/wards and hospices for chronically ill (%)
People in Group quarters - Hospices or homes for chronically ill (%)
People in Group quarters - Military hospitals or wards for chronically ill (%)
People in Group quarters - Other hospitals or wards for chronically ill (%)
People in Group quarters - Hospitals or wards for drug/alcohol abuse (%)
People in Group quarters - Mental (Psychiatric) hospitals or wards (%)
People in Group quarters - Schools, hospitals, or wards for the mentally retarded (%)
People in Group quarters - Schools, hospitals, or wards for the physically handicapped (%)
People in Group quarters - Institutions for the deaf (%)
People in Group quarters - Institutions for the blind (%)
People in Group quarters - Orthopedic wards and institutions for the physically handicapped (%)
People in Group quarters - Wards in general hospitals for patients who have no usual home elsewhere (%)
People in Group quarters - Wards in military hospitals for patients who have no usual home elsewhere (%)
People in Group quarters - Juvenile institutions (%)
People in Group quarters - Long-term care (%)
People in Group quarters - Homes for abused, dependent, and neglected children (%)
People in Group quarters - Residential treatment centers for emotionally disturbed children (%)
People in Group quarters - Training schools for juvenile delinquents (%)
People in Group quarters - Short-term care, detention or diagnostic centers for delinquent children (%)
People in Group quarters - Type of juvenile institution unknown (%)
People in Group quarters - Noninstitutionalized population (%)
People in Group quarters - College dormitories (includes college quarters off campus) (%)
People in Group quarters - Military quarters (%)
People in Group quarters - On base (%)
People in Group quarters - Barracks, unaccompanied personnel housing (UPH), (Enlisted/Officer), ;and similar group living quarters for military personnel (%)
People in Group quarters - Transient quarters for temporary residents (%)
People in Group quarters - Military ships (%)
People in Group quarters - Group homes (%)
People in Group quarters - Homes or halfway houses for drug/alcohol abuse (%)
People in Group quarters - Homes for the mentally ill (%)
People in Group quarters - Homes for the mentally retarded (%)
People in Group quarters - Homes for the physically handicapped (%)
People in Group quarters - Other group homes (%)
People in Group quarters - Religious group quarters (%)
People in Group quarters - Dormitories (%)
People in Group quarters - Agriculture workers' dormitories on farms (%)
People in Group quarters - Job Corps and vocational training facilities (%)
People in Group quarters - Other workers' dormitories (%)
People in Group quarters - Crews of maritime vessels (%)
People in Group quarters - Other nonhousehold living situations (%)
People in Group quarters - Other noninstitutional group quarters (%)
Residents speaking English at home (%)
Residents speaking English at home - Born in the United States (%)
Residents speaking English at home - Native, born elsewhere (%)
Residents speaking English at home - Foreign born (%)
Residents speaking Spanish at home (%)
Residents speaking Spanish at home - Born in the United States (%)
Residents speaking Spanish at home - Native, born elsewhere (%)
Residents speaking Spanish at home - Foreign born (%)
Residents speaking other language at home (%)
Residents speaking other language at home - Born in the United States (%)
Residents speaking other language at home - Native, born elsewhere (%)
Residents speaking other language at home - Foreign born (%)
Class of Workers - Employee of private company (%)
Class of Workers - Self-employed in own incorporated business (%)
Class of Workers - Private not-for-profit wage and salary workers (%)
Class of Workers - Local government workers (%)
Class of Workers - State government workers (%)
Class of Workers - Federal government workers (%)
Class of Workers - Self-employed workers in own not incorporated business and Unpaid family workers (%)
House heating fuel used in houses and condos - Utility gas (%)
House heating fuel used in houses and condos - Bottled, tank, or LP gas (%)
House heating fuel used in houses and condos - Electricity (%)
House heating fuel used in houses and condos - Fuel oil, kerosene, etc. (%)
House heating fuel used in houses and condos - Coal or coke (%)
House heating fuel used in houses and condos - Wood (%)
House heating fuel used in houses and condos - Solar energy (%)
House heating fuel used in houses and condos - Other fuel (%)
House heating fuel used in houses and condos - No fuel used (%)
House heating fuel used in apartments - Utility gas (%)
House heating fuel used in apartments - Bottled, tank, or LP gas (%)
House heating fuel used in apartments - Electricity (%)
House heating fuel used in apartments - Fuel oil, kerosene, etc. (%)
House heating fuel used in apartments - Coal or coke (%)
House heating fuel used in apartments - Wood (%)
House heating fuel used in apartments - Solar energy (%)
House heating fuel used in apartments - Other fuel (%)
House heating fuel used in apartments - No fuel used (%)
Armed forces status - In Armed Forces (%)
Armed forces status - Civilian (%)
Armed forces status - Civilian - Veteran (%)
Armed forces status - Civilian - Nonveteran (%)
Fatal accidents locations in years 2005-2021
Fatal accidents locations in 2005
Fatal accidents locations in 2006
Fatal accidents locations in 2007
Fatal accidents locations in 2008
Fatal accidents locations in 2009
Fatal accidents locations in 2010
Fatal accidents locations in 2011
Fatal accidents locations in 2012
Fatal accidents locations in 2013
Fatal accidents locations in 2014
Fatal accidents locations in 2015
Fatal accidents locations in 2016
Fatal accidents locations in 2017
Fatal accidents locations in 2018
Fatal accidents locations in 2019
Fatal accidents locations in 2020
Fatal accidents locations in 2021
Alcohol use - People drinking some alcohol every month (%)
Alcohol use - People not drinking at all (%)
Alcohol use - Average days/month drinking alcohol
Alcohol use - Average drinks/week
Alcohol use - Average days/year people drink much
Audiometry - Average condition of hearing (%)
Audiometry - People that can hear a whisper from across a quiet room (%)
Audiometry - People that can hear normal voice from across a quiet room (%)
Audiometry - Ears ringing, roaring, buzzing (%)
Audiometry - Had a job exposure to loud noise (%)
Audiometry - Had off-work exposure to loud noise (%)
Blood Pressure & Cholesterol - Has high blood pressure (%)
Blood Pressure & Cholesterol - Checking blood pressure at home (%)
Blood Pressure & Cholesterol - Frequently checking blood cholesterol (%)
Blood Pressure & Cholesterol - Has high cholesterol level (%)
Consumer Behavior - Money monthly spent on food at supermarket/grocery store
Consumer Behavior - Money monthly spent on food at other stores
Consumer Behavior - Money monthly spent on eating out
Consumer Behavior - Money monthly spent on carryout/delivered foods
Consumer Behavior - Income spent on food at supermarket/grocery store (%)
Consumer Behavior - Income spent on food at other stores (%)
Consumer Behavior - Income spent on eating out (%)
Consumer Behavior - Income spent on carryout/delivered foods (%)
Current Health Status - General health condition (%)
Current Health Status - Blood donors (%)
Current Health Status - Has blood ever tested for HIV virus (%)
Current Health Status - Left-handed people (%)
Dermatology - People using sunscreen (%)
Diabetes - Diabetics (%)
Diabetes - Had a blood test for high blood sugar (%)
Diabetes - People taking insulin (%)
Diet Behavior & Nutrition - Diet health (%)
Diet Behavior & Nutrition - Milk product consumption (# of products/month)
Diet Behavior & Nutrition - Meals not home prepared (#/week)
Diet Behavior & Nutrition - Meals from fast food or pizza place (#/week)
Diet Behavior & Nutrition - Ready-to-eat foods (#/month)
Diet Behavior & Nutrition - Frozen meals/pizza (#/month)
Drug Use - People that ever used marijuana or hashish (%)
Drug Use - Ever used hard drugs (%)
Drug Use - Ever used any form of cocaine (%)
Drug Use - Ever used heroin (%)
Drug Use - Ever used methamphetamine (%)
Health Insurance - People covered by health insurance (%)
Kidney Conditions-Urology - Avg. # of times urinating at night
Medical Conditions - People with asthma (%)
Medical Conditions - People with anemia (%)
Medical Conditions - People with psoriasis (%)
Medical Conditions - People with overweight (%)
Medical Conditions - Elderly people having difficulties in thinking or remembering (%)
Medical Conditions - People who ever received blood transfusion (%)
Medical Conditions - People having trouble seeing even with glass/contacts (%)
Medical Conditions - People with arthritis (%)
Medical Conditions - People with gout (%)
Medical Conditions - People with congestive heart failure (%)
Medical Conditions - People with coronary heart disease (%)
Medical Conditions - People with angina pectoris (%)
Medical Conditions - People who ever had heart attack (%)
Medical Conditions - People who ever had stroke (%)
Medical Conditions - People with emphysema (%)
Medical Conditions - People with thyroid problem (%)
Medical Conditions - People with chronic bronchitis (%)
Medical Conditions - People with any liver condition (%)
Medical Conditions - People who ever had cancer or malignancy (%)
Mental Health - People who have little interest in doing things (%)
Mental Health - People feeling down, depressed, or hopeless (%)
Mental Health - People who have trouble sleeping or sleeping too much (%)
Mental Health - People feeling tired or having little energy (%)
Mental Health - People with poor appetite or overeating (%)
Mental Health - People feeling bad about themself (%)
Mental Health - People who have trouble concentrating on things (%)
Mental Health - People moving or speaking slowly or too fast (%)
Mental Health - People having thoughts they would be better off dead (%)
Oral Health - Average years since last visit a dentist
Oral Health - People embarrassed because of mouth (%)
Oral Health - People with gum disease (%)
Oral Health - General health of teeth and gums (%)
Oral Health - Average days a week using dental floss/device
Oral Health - Average days a week using mouthwash for dental problem
Oral Health - Average number of teeth
Pesticide Use - Households using pesticides to control insects (%)
Pesticide Use - Households using pesticides to kill weeds (%)
Physical Activity - People doing vigorous-intensity work activities (%)
Physical Activity - People doing moderate-intensity work activities (%)
Physical Activity - People walking or bicycling (%)
Physical Activity - People doing vigorous-intensity recreational activities (%)
Physical Activity - People doing moderate-intensity recreational activities (%)
Physical Activity - Average hours a day doing sedentary activities
Physical Activity - Average hours a day watching TV or videos
Physical Activity - Average hours a day using computer
Physical Functioning - People having limitations keeping them from working (%)
Physical Functioning - People limited in amount of work they can do (%)
Physical Functioning - People that need special equipment to walk (%)
Physical Functioning - People experiencing confusion/memory problems (%)
Physical Functioning - People requiring special healthcare equipment (%)
Prescription Medications - Average number of prescription medicines taking
Preventive Aspirin Use - Adults 40+ taking low-dose aspirin (%)
Reproductive Health - Vaginal deliveries (%)
Reproductive Health - Cesarean deliveries (%)
Reproductive Health - Deliveries resulted in a live birth (%)
Reproductive Health - Pregnancies resulted in a delivery (%)
Reproductive Health - Women breastfeeding newborns (%)
Reproductive Health - Women that had a hysterectomy (%)
Reproductive Health - Women that had both ovaries removed (%)
Reproductive Health - Women that have ever taken birth control pills (%)
Reproductive Health - Women taking birth control pills (%)
Reproductive Health - Women that have ever used Depo-Provera or injectables (%)
Reproductive Health - Women that have ever used female hormones (%)
Sexual Behavior - People 18+ that ever had sex (vaginal, anal, or oral) (%)
Sexual Behavior - Males 18+ that ever had vaginal sex with a woman (%)
Sexual Behavior - Males 18+ that ever performed oral sex on a woman (%)
Sexual Behavior - Males 18+ that ever had anal sex with a woman (%)
Sexual Behavior - Males 18+ that ever had any sex with a man (%)
Sexual Behavior - Females 18+ that ever had vaginal sex with a man (%)
Sexual Behavior - Females 18+ that ever performed oral sex on a man (%)
Sexual Behavior - Females 18+ that ever had anal sex with a man (%)
Sexual Behavior - Females 18+ that ever had any kind of sex with a woman (%)
Sexual Behavior - Average age people first had sex
Sexual Behavior - Average number of female sex partners in lifetime (males 18+)
Sexual Behavior - Average number of female vaginal sex partners in lifetime (males 18+)
Sexual Behavior - Average age people first performed oral sex on a woman (18+)
Sexual Behavior - Average number of woman performed oral sex on in lifetime (18+)
Sexual Behavior - Average number of male sex partners in lifetime (males 18+)
Sexual Behavior - Average number of male anal sex partners in lifetime (males 18+)
Sexual Behavior - Average age people first performed oral sex on a man (18+)
Sexual Behavior - Average number of male oral sex partners in lifetime (18+)
Sexual Behavior - People using protection when performing oral sex (%)
Sexual Behavior - Average number of times people have vaginal or anal sex a year
Sexual Behavior - People having sex without condom (%)
Sexual Behavior - Average number of male sex partners in lifetime (females 18+)
Sexual Behavior - Average number of male vaginal sex partners in lifetime (females 18+)
Sexual Behavior - Average number of female sex partners in lifetime (females 18+)
Sexual Behavior - Circumcised males 18+ (%)
Sleep Disorders - Average hours sleeping at night
Sleep Disorders - People that has trouble sleeping (%)
Smoking-Cigarette Use - People smoking cigarettes (%)
Taste & Smell - People 40+ having problems with smell (%)
Taste & Smell - People 40+ having problems with taste (%)
Taste & Smell - People 40+ that ever had wisdom teeth removed (%)
Taste & Smell - People 40+ that ever had tonsils teeth removed (%)
Taste & Smell - People 40+ that ever had a loss of consciousness because of a head injury (%)
Taste & Smell - People 40+ that ever had a broken nose or other serious injury to face or skull (%)
Taste & Smell - People 40+ that ever had two or more sinus infections (%)
Weight - Average height (inches)
Weight - Average weight (pounds)
Weight - Average BMI
Weight - People that are obese (%)
Weight - People that ever were obese (%)
Weight - People trying to lose weight (%)
100%
urban population.
Estimated median house/condo value in 2022: $292,757
76017:
$292,757Texas:
$275,400
According to our research of Texas and other state lists, there were 69 registered sex offenders living in 76017 zip code as of May 05, 2024 . The ratio of all residents to sex offenders in zip code 76017 is 675 to 1.The ratio of registered sex offenders to all residents in this zip code is lower than the state average.
Median resident age: This zip code:
38.4 yearsTexas median age:
35.6 years
Average household size: This zip code:
2.8 peopleTexas:
2.6 people
Averages for the 2020 tax year for zip code 76017, filed in 2021:
Average Adjusted Gross Income (AGI) in 2020: $67,724 (Individual Income Tax Returns) Here:
$67,724State:
$77,054
Salary/wage: $57,021 (reported on 84.2% of returns )Here:
$57,021State:
$62,766
(% of AGI for various income ranges: 1182.4% for AGIs below $25k , 3723.4% for AGIs $25k-50k , 6527.4% for AGIs $50k-75k , 9585.4% for AGIs $75k-100k , 17308.4% for AGIs $100k-200k , 67111.1% for AGIs over 200k ) Taxable interest for individuals: $2,119 (reported on 21.7% of returns )This zip code:
$2,119Texas:
$2,665
(% of AGI for various income ranges: 11.3% for AGIs below $25k , 11.3% for AGIs $25k-50k , 23.5% for AGIs $50k-75k , 48.9% for AGIs $75k-100k , 103.7% for AGIs $100k-200k , 2081.8% for AGIs over 200k ) Ordinary dividends: $6,118 (reported on 15.0% of returns )(% of AGI for various income ranges: 16.7% for AGIs below $25k , 23.8% for AGIs $25k-50k , 43.8% for AGIs $50k-75k , 105.6% for AGIs $75k-100k , 278.4% for AGIs $100k-200k , 3755.7% for AGIs over 200k ) Net capital gain/loss in AGI: +$22,670 (reported on 14.0% of returns )Here:
+$22,670State:
+$39,590
(% of AGI for various income ranges: 3.7% for AGIs below $25k , 15.5% for AGIs $25k-50k , 38.6% for AGIs $50k-75k , 116.4% for AGIs $75k-100k , 393.7% for AGIs $100k-200k , 21531.4% for AGIs over 200k ) Profit/loss from business: +$6,932 (reported on 21.3% of returns )Here:
+$6,932State:
+$10,888
(% of AGI for various income ranges: 80.5% for AGIs below $25k , 46.3% for AGIs $25k-50k , 166.6% for AGIs $50k-75k , 184.8% for AGIs $75k-100k , 493.6% for AGIs $100k-200k , 3572.5% for AGIs over 200k ) Taxable individual retirement arrangement distribution: $21,107 (reported on 8.0% of returns )76017:
$21,107Texas:
$24,740
(% of AGI for various income ranges: 39.8% for AGIs below $25k , 81.0% for AGIs $25k-50k , 173.0% for AGIs $50k-75k , 317.5% for AGIs $75k-100k , 775.1% for AGIs $100k-200k , 2758.6% for AGIs over 200k ) Self-employed (Keogh) retirement plans: $22,357 (reported on 0.3% of returns )76017:
$22,357Texas:
$29,298
(% of AGI for various income ranges: 22.7% for AGIs $100k-200k , 407.1% for AGIs over 200k ) Total itemized deductions: $33,984 (reported on 7.9% of returns )Here:
$33,984State:
$40,428
(% of AGI for various income ranges: 41.0% for AGIs below $25k , 117.4% for AGIs $25k-50k , 325.5% for AGIs $50k-75k , 534.5% for AGIs $75k-100k , 854.6% for AGIs $100k-200k , 7019.6% for AGIs over 200k ) Charity contributions: $14,759 (reported on 6.7% of returns )Here:
$14,759State:
$18,201
(% of AGI for various income ranges: 6.0% for AGIs below $25k , 28.2% for AGIs $25k-50k , 75.2% for AGIs $50k-75k , 151.3% for AGIs $75k-100k , 302.4% for AGIs $100k-200k , 3733.9% for AGIs over 200k ) Taxes paid: $6,906 (reported on 7.7% of returns )(% of AGI for various income ranges: 7.5% for AGIs below $25k , 23.6% for AGIs $25k-50k , 71.2% for AGIs $50k-75k , 127.5% for AGIs $75k-100k , 198.4% for AGIs $100k-200k , 1005.4% for AGIs over 200k ) Earned income credit: $2,415 (reported on 16.8% of returns )(% of AGI for various income ranges: 102.8% for AGIs below $25k , 76.0% for AGIs $25k-50k , 1.1% for AGIs $50k-75k ) Percentage of individuals using paid preparers for their 2020 taxes: 92.2%(% for various income ranges: 92.3% for AGIs below $25k , 93.3% for AGIs $25k-50k , 91.9% for AGIs $50k-75k , 90.8% for AGIs $75k-100k , 91.8% for AGIs $100k-200k , 90.4% for AGIs over 200k )
Averages for the 2012 tax year for zip code 76017, filed in 2013:
Average Adjusted Gross Income (AGI) in 2012: $62,105 (Individual Income Tax Returns) Here:
$62,105State:
$65,384
Salary/wage: $52,948 (reported on 87.3% of returns )Here:
$52,948State:
$52,524
(% of AGI for various income ranges: 80.8% for AGIs below $25k , 84.9% for AGIs $25k-50k , 82.1% for AGIs $50k-75k , 80.9% for AGIs $75k-100k , 80.5% for AGIs $100k-200k , 49.2% for AGIs over 200k ) Taxable interest for individuals: $1,471 (reported on 26.9% of returns )This zip code:
$1,471Texas:
$2,372
(% of AGI for various income ranges: 0.8% for AGIs below $25k , 0.4% for AGIs $25k-50k , 0.4% for AGIs $50k-75k , 0.4% for AGIs $75k-100k , 0.5% for AGIs $100k-200k , 1.3% for AGIs over 200k ) Ordinary dividends: $6,926 (reported on 16.0% of returns )(% of AGI for various income ranges: 1.2% for AGIs below $25k , 0.7% for AGIs $25k-50k , 0.8% for AGIs $50k-75k , 0.7% for AGIs $75k-100k , 1.0% for AGIs $100k-200k , 4.9% for AGIs over 200k ) Net capital gain/loss in AGI: +$14,988 (reported on 12.9% of returns )Here:
+$14,988State:
+$35,319
(% of AGI for various income ranges: 0.2% for AGIs $25k-50k , 0.1% for AGIs $50k-75k , 0.4% for AGIs $75k-100k , 0.8% for AGIs $100k-200k , 12.6% for AGIs over 200k ) Profit/loss from business: +$10,761 (reported on 18.7% of returns )Here:
+$10,761State:
+$13,732
(% of AGI for various income ranges: 7.8% for AGIs below $25k , 2.1% for AGIs $25k-50k , 2.1% for AGIs $50k-75k , 2.7% for AGIs $75k-100k , 2.4% for AGIs $100k-200k , 4.8% for AGIs over 200k ) Taxable individual retirement arrangement distribution: $16,965 (reported on 8.7% of returns )76017:
$16,965Texas:
$19,511
(% of AGI for various income ranges: 2.1% for AGIs below $25k , 2.1% for AGIs $25k-50k , 2.2% for AGIs $50k-75k , 2.4% for AGIs $75k-100k , 2.9% for AGIs $100k-200k , 2.1% for AGIs over 200k ) Self-employment retirement plans: $17,422 (reported on 0.4% of returns )76017:
$17,422Texas:
$23,938
(% of AGI for various income ranges: 0.1% for AGIs $25k-50k , 0.4% for AGIs over 200k ) Total itemized deductions: $20,377 (18% of AGI, reported on 31.2% of returns )Here:
$20,377State:
$24,724
Here:
18.3% of AGIState:
15.9% of AGI
(% of AGI for various income ranges: 8.0% for AGIs below $25k , 10.5% for AGIs $25k-50k , 11.9% for AGIs $50k-75k , 11.2% for AGIs $75k-100k , 11.1% for AGIs $100k-200k , 7.9% for AGIs over 200k ) Charity contributions: $5,814 (reported on 25.4% of returns )(% of AGI for various income ranges: 0.8% for AGIs below $25k , 1.6% for AGIs $25k-50k , 2.2% for AGIs $50k-75k , 2.5% for AGIs $75k-100k , 2.8% for AGIs $100k-200k , 2.9% for AGIs over 200k ) Taxes paid: $5,465 (reported on 30.6% of returns )(% of AGI for various income ranges: 1.8% for AGIs below $25k , 2.3% for AGIs $25k-50k , 3.1% for AGIs $50k-75k , 3.1% for AGIs $75k-100k , 3.2% for AGIs $100k-200k , 2.1% for AGIs over 200k ) Earned income credit: $2,324 (reported on 17.9% of returns )(% of AGI for various income ranges: 7.4% for AGIs below $25k , 1.1% for AGIs $25k-50k ) Percentage of individuals using paid preparers for their 2012 taxes: 45.5%(% for various income ranges: 44.2% for AGIs below $25k , 44.0% for AGIs $25k-50k , 44.9% for AGIs $50k-75k , 44.7% for AGIs $75k-100k , 48.2% for AGIs $100k-200k , 66.7% for AGIs over 200k )
Averages for the 2004 tax year for zip code 76017, filed in 2005:
Average Adjusted Gross Income (AGI) in 2004: $54,458 (Individual Income Tax Returns) Here:
$54,458State:
$47,881
Salary/wage: $49,877 (reported on 90.0% of returns )Here:
$49,877State:
$41,947
(% of AGI for various income ranges: 163.1% for AGIs below $10k , 86.0% for AGIs $10k-25k , 88.7% for AGIs $25k-50k , 87.9% for AGIs $50k-75k , 88.0% for AGIs $75k-100k , 73.1% for AGIs over 100k ) Taxable interest for individuals: $1,451 (reported on 38.4% of returns )This zip code:
$1,451Texas:
$2,255
(% of AGI for various income ranges: 5.2% for AGIs below $10k , 1.3% for AGIs $10k-25k , 0.7% for AGIs $25k-50k , 0.6% for AGIs $50k-75k , 0.6% for AGIs $75k-100k , 1.4% for AGIs over 100k ) Taxable dividends: $2,177 (reported on 20.3% of returns )(% of AGI for various income ranges: 3.9% for AGIs below $10k , 0.7% for AGIs $10k-25k , 0.5% for AGIs $25k-50k , 0.6% for AGIs $50k-75k , 0.5% for AGIs $75k-100k , 1.2% for AGIs over 100k ) Net capital gain/loss: +$6,180 (reported on 17.4% of returns )Here:
+$6,180State:
+$16,110
(% of AGI for various income ranges: -1.5% for AGIs below $10k , 0.1% for AGIs $10k-25k , 0.1% for AGIs $25k-50k , 0.3% for AGIs $50k-75k , 0.4% for AGIs $75k-100k , 4.4% for AGIs over 100k ) Profit/loss from business: +$10,216 (reported on 18.1% of returns )Here:
+$10,216State:
+$11,013
(% of AGI for various income ranges: 0.6% for AGIs below $10k , 4.6% for AGIs $10k-25k , 2.6% for AGIs $25k-50k , 2.3% for AGIs $50k-75k , 2.7% for AGIs $75k-100k , 4.4% for AGIs over 100k ) IRA payment deduction: $3,051 (reported on 2.4% of returns )(% of AGI for various income ranges: 0.3% for AGIs below $10k , 0.2% for AGIs $10k-25k , 0.2% for AGIs $25k-50k , 0.2% for AGIs $50k-75k , 0.1% for AGIs $75k-100k , 0.1% for AGIs over 100k ) Self-employed pension: $14,149 (reported on 0.9% of returns )Here:
$14,149Texas:
$16,401
(% of AGI for various income ranges: 0.0% for AGIs $25k-50k , 0.1% for AGIs $50k-75k , 0.1% for AGIs $75k-100k , 0.4% for AGIs over 100k ) Total itemized deductions: $18,164 (21% of AGI, reported on 42.6% of returns )Here:
$18,164State:
$19,631
Here:
21.0% of AGIState:
18.9% of AGI
(% of AGI for various income ranges: 18.8% for AGIs below $10k , 11.2% for AGIs $10k-25k , 14.4% for AGIs $25k-50k , 15.4% for AGIs $50k-75k , 15.1% for AGIs $75k-100k , 13.5% for AGIs over 100k ) Charity contributions deductions: $4,447 (5% of AGI, reported on 36.7% of returns )Here:
4.9% of AGIState:
4.2% of AGI
(% of AGI for various income ranges: 1.1% for AGIs below $10k , 1.2% for AGIs $10k-25k , 2.3% for AGIs $25k-50k , 2.6% for AGIs $50k-75k , 2.8% for AGIs $75k-100k , 3.8% for AGIs over 100k ) Total tax: $8,661 (reported on 78.6% of returns )(% of AGI for various income ranges: 4.8% for AGIs below $10k , 4.3% for AGIs $10k-25k , 6.8% for AGIs $25k-50k , 9.1% for AGIs $50k-75k , 10.8% for AGIs $75k-100k , 18.4% for AGIs over 100k ) Earned income credit: $1,751 (reported on 13.2% of returns )Percentage of individuals using paid preparers for their 2004 taxes: 47.6%(% for various income ranges: 39.7% for AGIs below $10k , 51.9% for AGIs $10k-25k , 49.5% for AGIs $25k-50k , 45.9% for AGIs $50k-75k , 45.3% for AGIs $75k-100k , 52.5% for AGIs over 100k )
Estimated median household income in 2022: This zip code:
$89,005Texas:
$72,284
Nearest zip codes: 76001 ,
76016 ,
76015 ,
76013 ,
76060 ,
76018 .
Kennedale Zip Code Map
Percentage of family households: This zip code:
48.8%Texas:
50.5%
Percentage of households with unmarried partners: This zip code:
3.6%Texas:
48.7%
Likely homosexual households (counted as self-reported same-sex unmarried-partner households)
Lesbian couples: 0.1% of all households Gay men: 0.1% of all households
Household received Food Stamps/SNAP in the past 12 months: 1,108Household did not receive Food Stamps/SNAP in the past 12 months: 15,647
Women who had a birth in the past 12 months: 452 (294 now married , 157 unmarried) Women who did not have a birth in the past 12 months: 11,559 (4,672 now married , 6,899 unmarried)
Housing units in zip code 76017 with a mortgage: 7,401 (475
second mortgage , 478
both second mortgage and home equity loan )
Houses without a mortgage: 122
Median monthly owner costs for units with a mortgage: $1,803
Median monthly owner costs for units without a mortgage: $813
Residents with income below the poverty level in 2022:
This zip code:
8.4%Whole state:
14.0%
Residents with income below 50% of the poverty level in 2022:
This zip code:
2.7%Whole state:
7.4%
Median number of rooms in houses and condos: Median number of rooms in apartments: Notable locations in this zip code not listed on our city pages
Click to draw/clear zip code borders Notable locations in zip code 76017: (A) , Arlington Sports Center (B) , Arlington Texas Fire Department Station 9 (C) , Arlington Texas Fire Department Station 10 (D) . Display/hide their locations on the map
Shopping Centers: (1) , Cooper Street Plaza Shopping Center (2) . Display/hide their locations on the map
Churches in zip code 76017 include: (A) , Walnut Creek Community Church (B) , Victory Fellowship Church (C) , Heritage Baptist Church (D) , Rush Creek Baptist Church (E) , Primitive Baptist Church Arlington (F) , Church of Christ on Green Oaks (G) , All Saints Lutheran Church (H) , Saint John the Apostle United Methodist Church (I) . Display/hide their locations on the map
Cemetery: (1) . Display/hide its location on the map
Park in zip code 76017: (1) . Display/hide its location on the map
Year house built (houses)
39 2020 or later591 2010 to 20191,838 2000 to 20093,413 1990 to 19997,713 1980 to 19892,101 1970 to 1979476 1960 to 1969145 1950 to 19590 1940 to 194951 1939 or earlier
Zip code 76017 household income distribution in 2022 755 Less than $10,000264 $10,000 to $14,999343 $15,000 to $19,999359 $20,000 to $24,999240 $25,000 to $29,999410 $30,000 to $34,999484 $35,000 to $39,999585 $40,000 to $44,999723 $45,000 to $49,9991,097 $50,000 to $59,9991,697 $60,000 to $74,9992,478 $75,000 to $99,9991,834 $100,000 to $124,9991,735 $125,000 to $149,9991,851 $150,000 to $199,9991,890 $200,000 or moreEstimate of home value of owner-occupied houses/condos in 2022 in zip code 76017 56 Less than $10,00029 $10,000 to $14,99911 $15,000 to $19,99982 $20,000 to $24,9998 $25,000 to $29,9997 $30,000 to $34,99915 $35,000 to $39,99913 $40,000 to $49,99936 $60,000 to $69,999109 $80,000 to $89,999208 $100,000 to $124,999327 $125,000 to $149,999502 $150,000 to $174,999969 $175,000 to $199,9992,305 $200,000 to $249,9992,254 $250,000 to $299,9992,734 $300,000 to $399,999767 $400,000 to $499,999434 $500,000 to $749,999106 $750,000 to $999,99998 $1,000,000 to $1,499,9998 $1,500,000 to $1,999,999129 $2,000,000 or moreRent paid by renters in 2022 in zip code 76017 5 Less than $10053 $150 to $19944 $300 to $3495 $350 to $3997 $450 to $49973 $550 to $59924 $600 to $64923 $700 to $74955 $750 to $799317 $800 to $899745 $900 to $9991,403 $1,000 to $1,249717 $1,250 to $1,4991,559 $1,500 to $1,999405 $2,000 to $2,49917 $2,500 to $2,99976 No cash rent
Median gross rent in 2022: $1,476.
Median price asked for vacant for-sale houses and condos in 2022: $1,005,371.
Estimated median house (or condo) value in 2022 for: White Non-Hispanic householders: $300,242Black or African American householders: $287,489American Indian or Alaska Native householders: $235,647Asian householders: $302,460Some other race householders: $285,826Two or more races householders: $255,608Hispanic or Latino householders: $277,509Estimated median house or condo value in 2022: $292,757
76017:
$292,757Texas:
$275,400
Lower value quartile - upper value quartile: $233,085 - $378,837
Mean price in 2022: Detached houses: $336,628Here:
$336,628State:
$369,058
Townhouses or other attached units: $232,533Here:
$232,533State:
$327,631
In 2-unit structures: $298,131Here:
$298,131State:
$374,947
In 3-to-4-unit structures: $40,889Here:
$40,889State:
$209,652
In 5-or-more-unit structures: $212,212Here:
$212,212State:
$413,944
Mobile homes: $104,550Here:
$104,550State:
$124,413
Occupied boats, RVs, vans, etc.: $59,769Here:
$59,769State:
$73,921
Housing units in structures:
One, detached: 13,337One, attached: 575Two: 3793 or 4: 3635 to 9: 39810 to 19: 97820 to 49: 24950 or more: 736Mobile homes: 417Boats, RVs, vans, etc.: 25Unemployment : 4.3%
Means of transportation to work in zip code 76017 70.5% 18,405 Drove a car alone12.4% 3,223 Carpooled0.0% 1 Bus or trolley bus0.3% 82 Motorcycle0.0% 7 Bicycle0.7% 179 Walked2.0% 529 Other means14.4% 3,749 Worked at homeTravel time to work (commute) in zip code 76017 531 Less than 5 minutes1,074 5 to 9 minutes2,382 10 to 14 minutes3,337 15 to 19 minutes3,781 20 to 24 minutes1,875 25 to 29 minutes3,182 30 to 34 minutes815 35 to 39 minutes1,193 40 to 44 minutes2,324 45 to 59 minutes1,391 60 to 89 minutes438 90 or more minutes
Neighborhoods in zip code 76017: Percentage of zip code residents living and working in this county: 80.2%
Household type by relationship:
Households: 47,607
Male householders: 7,650 (1,778 living alone ), Female householders: 9,162 (2,141 living alone )8,540 spouses (8,495 opposite-sex spouses ), 1,003 unmarried partners , (968 opposite-sex unmarried partners ), 14,558 children (13,555 natural , 199 adopted , 804 stepchildren ), 2,033 grandchildren , 625 brothers or sisters , 1,054 parents , 263 foster children , 871 other relatives , 1,599 non-relatives In group quarters: 85 (-1 institutionalized population )
Size of family households: 4,741 2-persons , 2,943 3-persons , 2,149 4-persons , 878 5-persons , 501 6-persons , 447 7-or-more-persons
Size of nonfamily households: 3,918 1-person , 868 2-persons , 230 3-persons , 108 4-persons , 14 5-persons
5,869 married couples with children. single-parent households (276 men , 1,739 women ).
79.7% of residents of 76017 zip code speak English at home. of residents speak Spanish at home (76% very well, 16% well, 7% not well, 2% not at all ).of residents speak other Indo-European language at home (60% very well, 35% well, 5% not well ).of residents speak Asian or Pacific Island language at home (46% very well, 25% well, 28% not well, 1% not at all ).of residents speak other language at home (54% very well, 38% well, 7% not well, 1% not at all ).
Foreign born population: 5,913 (12.4%)
(57.5%
of them are naturalized citizens )
This zip code:
12.4%Whole state:
17.2%
25% Honduras 18% Thailand 6% Nepal 4% Cabo Verde 3% Bhutan 3% Israel 2% Liberia 10% English 8% American 4% German 3% European 3% Irish 2% Scottish 2% African
Year of entry for the foreign-born population
2,274 2010 or later 1,750 2000 to 2009 944 1990 to 1999 1,604 Before 1990
There are
199 Medical Specialists in Zip Code 76017 .
Facilities with environmental interests located in this zip code:
AUTOZONE (6011 SOUTH COOPER in ARLINGTON, TX)
AIR MINOR (AIRS/AFS) ENFORCEMENT/COMPLIANCE ACTIVITY (Integrated Compliance Information System) - ICIS-06-2004-3320, FORMAL ENFORCEMENT ACTION (Integrated Compliance Information System) - ICIS-06-2004-3320, FORMAL ENFORCEMENT ACTION Business SIC classification: GENERAL AUTOMOTIVE REPAIR SHOPS
ANDRITZ RUTHNER INC (1010 COMMERCIAL BLVD S in ARLINGTON, TX)
(Resource Conservation and Recovery Act (tracking hazardous waste)) Business NAICS classification: ALL OTHER MISCELLANEOUS GENERAL PURPOSE MACHINERY MANUFACTURING.Alternative names: ARUS ANDRITZ INC
ARLINGTON MEMORIAL HOSPITAL (801 IH 20 W in ARLINGTON, TX)
Small Quantity Generators, between 100 kg and 1000 kg of hazardous waste/month (Resource Conservation and Recovery Act (tracking hazardous waste)) - notification Business NAICS classification: ALL OTHER OUTPATIENT CARE CENTERS.Organizations: ARLINGTON MEMORIAL SOUTH MEDICAL CENTER (CONTACT/OPERATOR)
, HARRIS METHODIST FORT WORTH (CONTACT/OWNER)
Alternative names: ARLINGTON MEMORIAL SOUTH MEDICAL CENTER
ARLINGTON CHRISTIAN SCHOOL (801 BARDEN ROAD in ARLINGTON, TX)
COMPLIANCE ACTIVITY (Tracking inspections of insecticide, fungicide, and rodenticide, and toxic substances)
ATOS ORIGIN (5000 S. BOWEN in ARLINGTON, TX)
ENFORCEMENT/COMPLIANCE ACTIVITY (Integrated Compliance Information System)
Housing units lacking complete kitchen facilities: 2.1%
71.7% Electricity 25.6% Utility gas 1.8% No fuel used 0.7% Bottled, tank, or LP gas
Population in 1990: 42,829.
Place of birth for U.S.-born residents:
This state: 24,526Northeast: 2,267Midwest: 4,414South: 5,977West: 3,991
50% of the 76017 zip code residents lived in the same house 5 years ago.
Out of people who lived in different houses, 60% lived in this county.
Out of people who lived in different counties, 50% lived in Texas.
89% of the 76017 zip code residents lived in the same house 1 year ago.
Out of people who lived in different houses, 62% moved from this county.
Out of people who lived in different houses, 22% moved from different county within same state.
Out of people who lived in different houses, 12% moved from different state.
Out of people who lived in different houses, 2% moved from abroad.
Private vs. public school enrollment:
Students in private schools in grades 1 to 8 (elementary and middle school): 459
Students in private schools in grades 9 to 12 (high school): 245
Students in private undergraduate colleges: 306
Occupation by median earnings in the past 12 months ($)
91,188 Legal occupations 86,322 Computer and mathematical occupations 82,787 Health diagnosing and treating practitioners and other technical occupations 80,504 Architecture and engineering occupations 77,662 Business and financial operations occupations 70,618 Management occupations
Companies with federal contracts located in this zip code:
DOSKOCIL MANUFACTURING COMPANY (4209 BARNETT BLVD in ARLINGTON, TX) in 3 contracts from 2005 to 2006
$37,360 with Army for Guns, through 30 mm. Signed on 2006-06-19. Completion date: 2006-12-31.
with U.S. Customs Service for . Signed on 2005-04-11. Completion date: 2005-05-11.
with Army for Specialized Ammunition Handling Servicing Equipment. Signed on 2005-02-09. Completion date: 2005-02-28.
CHARLES J BRAINERD (4704 COVENTRY LN in ARLINGTON, TX; small business)
$2,813 with Army for Legal Services. Taking place in KS. Signed on 2005-03-24. Completion date: 2005-03-23.
Top industries in this zip code by the number of employees in 2005:
Accommodation and Food Services: Full-Service Restaurants (100-249 employees: 3 establishments, 50-99 employees: 9 establishments, 20-49 employees: 3 establishments, 10-19 employees: 3 establishments, 5-9 employees: 5 establishments)Accommodation and Food Services: Limited-Service Restaurants (100-249: 1, 20-49: 18, 10-19: 6, 5-9: 7, 1-4: 5)Health Care and Social Assistance: General Medical and Surgical Hospitals (250-499: 1)Other Services (except Public Administration): Religious Organizations (20-49: 6, 10-19: 3, 5-9: 5, 1-4: 9)Educational Services: Elementary and Secondary Schools (50-99: 3, 20-49: 2)Health Care and Social Assistance: Child Day Care Services (50-99: 1, 20-49: 1, 10-19: 5, 5-9: 2, 1-4: 1)
People in group quarters in 2010:
18 people in emergency and transitional shelters (with sleeping facilities) for people experiencing homelessness
18 people in group homes intended for adults
17 people in other noninstitutional facilities
5 people in group homes for juveniles (non-correctional)
People in group quarters in 2000:
31 people in homes for the mentally retarded
12 people in religious group quarters
3 people in homes for the mentally ill
Fatal accident statistics in 2014:
Fatal accident count: 5Vehicles involved in fatal accidents: 7Fatal accidents caused by drunken drivers: 3Fatalities: 7Persons involved in fatal accidents: 13Pedestrians involved in fatal accidents: 2
Fatal accident statistics in 2013:
Fatal accident count: 2Vehicles involved in fatal accidents: 4Fatal accidents caused by drunken drivers: 0Fatalities: 2Persons involved in fatal accidents: 3Pedestrians involved in fatal accidents: 0
Home Mortgage Disclosure Act Aggregated Statistics For Year 2009(Based on 9 full and 6 partial tracts) A) FHA, FSA/RHS & VA B) Conventional C) Refinancings D) Home Improvement Loans F) Non-occupant Loans on G) Loans On Manufactured Number Average Value Number Average Value Number Average Value Number Average Value Number Average Value Number Average Value
LOANS ORIGINATED 495 $127,345 336 $127,703 992 $137,109 53 $78,385 101 $86,774 5 $51,972 APPLICATIONS APPROVED, NOT ACCEPTED 31 $123,436 20 $107,688 97 $119,204 10 $11,824 9 $106,372 4 $39,860 APPLICATIONS DENIED 57 $114,506 46 $89,903 422 $132,533 96 $24,676 30 $103,731 6 $55,755 APPLICATIONS WITHDRAWN 74 $126,861 35 $106,073 269 $122,682 25 $61,739 16 $72,845 4 $37,392 FILES CLOSED FOR INCOMPLETENESS 12 $139,874 10 $106,709 72 $118,790 16 $30,731 1 $120,780 4 $38,330
Aggregated Statistics For Year 2008(Based on 9 full and 6 partial tracts) A) FHA, FSA/RHS & VA B) Conventional C) Refinancings D) Home Improvement Loans E) Loans on Dwellings For 5+ Families F) Non-occupant Loans on G) Loans On Manufactured Number Average Value Number Average Value Number Average Value Number Average Value Number Average Value Number Average Value Number Average Value
LOANS ORIGINATED 432 $124,404 595 $111,266 648 $119,496 142 $29,721 0 $0 172 $91,754 74 $26,157 APPLICATIONS APPROVED, NOT ACCEPTED 24 $144,947 77 $102,667 120 $114,849 36 $38,349 0 $0 14 $80,374 21 $31,138 APPLICATIONS DENIED 51 $134,701 99 $109,616 475 $117,008 254 $31,895 0 $0 73 $83,420 4 $35,390 APPLICATIONS WITHDRAWN 57 $117,143 84 $138,714 194 $121,413 20 $64,808 0 $0 30 $81,372 4 $19,960 FILES CLOSED FOR INCOMPLETENESS 6 $108,845 9 $108,558 45 $113,301 8 $41,095 2 $2,997,600 5 $74,662 0 $0
Aggregated Statistics For Year 2007(Based on 9 full and 6 partial tracts) A) FHA, FSA/RHS & VA B) Conventional C) Refinancings D) Home Improvement Loans E) Loans on Dwellings For 5+ Families F) Non-occupant Loans on G) Loans On Manufactured Number Average Value Number Average Value Number Average Value Number Average Value Number Average Value Number Average Value Number Average Value
LOANS ORIGINATED 252 $116,217 1,263 $110,512 658 $122,804 179 $37,943 3 $5,744,990 270 $91,064 34 $38,292 APPLICATIONS APPROVED, NOT ACCEPTED 10 $123,569 143 $101,639 120 $116,120 46 $43,695 0 $0 40 $71,457 7 $44,226 APPLICATIONS DENIED 31 $110,844 289 $106,180 798 $129,921 271 $38,684 0 $0 87 $95,374 12 $39,129 APPLICATIONS WITHDRAWN 22 $127,062 169 $108,039 448 $117,216 30 $43,021 0 $0 37 $91,503 2 $89,930 FILES CLOSED FOR INCOMPLETENESS 2 $127,900 48 $116,882 140 $139,044 9 $67,197 0 $0 9 $84,301 0 $0
Aggregated Statistics For Year 2006(Based on 9 full and 6 partial tracts) A) FHA, FSA/RHS & VA B) Conventional C) Refinancings D) Home Improvement Loans E) Loans on Dwellings For 5+ Families F) Non-occupant Loans on G) Loans On Manufactured Number Average Value Number Average Value Number Average Value Number Average Value Number Average Value Number Average Value Number Average Value
LOANS ORIGINATED 282 $118,132 2,111 $91,834 777 $112,631 180 $37,488 2 $3,620,150 460 $81,499 5 $76,436 APPLICATIONS APPROVED, NOT ACCEPTED 8 $106,986 266 $86,716 160 $109,623 54 $33,390 0 $0 47 $95,404 4 $17,005 APPLICATIONS DENIED 40 $112,496 550 $88,339 739 $115,841 245 $29,323 0 $0 135 $87,432 22 $46,602 APPLICATIONS WITHDRAWN 27 $106,097 275 $100,382 553 $115,014 29 $53,429 0 $0 40 $89,638 2 $54,870 FILES CLOSED FOR INCOMPLETENESS 2 $198,125 73 $106,588 270 $111,249 5 $122,418 0 $0 20 $105,443 0 $0
Aggregated Statistics For Year 2005(Based on 9 full and 6 partial tracts) A) FHA, FSA/RHS & VA B) Conventional C) Refinancings D) Home Improvement Loans E) Loans on Dwellings For 5+ Families F) Non-occupant Loans on G) Loans On Manufactured Number Average Value Number Average Value Number Average Value Number Average Value Number Average Value Number Average Value Number Average Value
LOANS ORIGINATED 292 $111,659 2,137 $88,760 1,243 $107,172 195 $57,129 4 $10,732,962 434 $78,398 8 $52,365 APPLICATIONS APPROVED, NOT ACCEPTED 11 $127,587 223 $75,604 191 $108,531 47 $41,293 0 $0 41 $69,948 10 $54,358 APPLICATIONS DENIED 50 $110,026 546 $88,112 1,130 $106,862 271 $39,409 0 $0 127 $88,116 30 $44,217 APPLICATIONS WITHDRAWN 34 $117,880 359 $98,905 787 $125,717 106 $189,373 0 $0 107 $115,662 2 $99,920 FILES CLOSED FOR INCOMPLETENESS 2 $174,650 74 $111,753 541 $115,335 12 $23,777 0 $0 25 $107,744 0 $0
Aggregated Statistics For Year 2004(Based on 9 full and 6 partial tracts) A) FHA, FSA/RHS & VA B) Conventional C) Refinancings D) Home Improvement Loans E) Loans on Dwellings For 5+ Families F) Non-occupant Loans on G) Loans On Manufactured Number Average Value Number Average Value Number Average Value Number Average Value Number Average Value Number Average Value Number Average Value
LOANS ORIGINATED 427 $112,429 1,609 $97,928 2,137 $104,958 182 $41,174 2 $2,772,780 443 $86,770 8 $38,599 APPLICATIONS APPROVED, NOT ACCEPTED 18 $122,370 220 $91,719 332 $103,362 44 $31,465 0 $0 74 $88,096 9 $49,406 APPLICATIONS DENIED 59 $105,269 317 $96,194 1,308 $96,269 241 $36,435 0 $0 105 $79,208 15 $35,510 APPLICATIONS WITHDRAWN 52 $115,644 161 $112,810 720 $105,633 26 $60,490 0 $0 42 $79,700 0 $0 FILES CLOSED FOR INCOMPLETENESS 8 $114,515 35 $131,572 591 $112,278 17 $40,048 0 $0 18 $82,614 0 $0
Aggregated Statistics For Year 2003(Based on 9 full and 6 partial tracts) A) FHA, FSA/RHS & VA B) Conventional C) Refinancings D) Home Improvement Loans F) Non-occupant Loans on Number Average Value Number Average Value Number Average Value Number Average Value Number Average Value
LOANS ORIGINATED 711 $115,069 1,556 $97,280 4,916 $100,970 193 $31,994 363 $77,838 APPLICATIONS APPROVED, NOT ACCEPTED 20 $110,469 198 $101,973 628 $99,780 87 $41,341 66 $73,689 APPLICATIONS DENIED 99 $127,042 265 $97,898 1,777 $91,505 237 $25,244 106 $83,303 APPLICATIONS WITHDRAWN 84 $118,647 253 $108,801 978 $98,626 22 $52,450 50 $80,785 FILES CLOSED FOR INCOMPLETENESS 8 $114,841 73 $111,147 233 $95,499 9 $33,570 22 $84,132
Aggregated Statistics For Year 2002(Based on 9 full and 2 partial tracts) A) FHA, FSA/RHS & VA B) Conventional C) Refinancings D) Home Improvement Loans F) Non-occupant Loans on Number Average Value Number Average Value Number Average Value Number Average Value Number Average Value
LOANS ORIGINATED 672 $111,890 1,060 $97,356 2,083 $100,336 173 $26,337 166 $72,876 APPLICATIONS APPROVED, NOT ACCEPTED 22 $107,060 112 $123,048 269 $91,460 62 $24,445 20 $81,756 APPLICATIONS DENIED 48 $107,395 181 $90,935 554 $83,502 147 $19,403 42 $71,661 APPLICATIONS WITHDRAWN 80 $117,606 149 $103,831 448 $95,898 18 $43,226 17 $65,161 FILES CLOSED FOR INCOMPLETENESS 15 $98,480 57 $85,925 234 $90,552 7 $13,703 5 $82,718
Aggregated Statistics For Year 2001(Based on 9 full and 2 partial tracts) A) FHA, FSA/RHS & VA B) Conventional C) Refinancings D) Home Improvement Loans E) Loans on Dwellings For 5+ Families F) Non-occupant Loans on Number Average Value Number Average Value Number Average Value Number Average Value Number Average Value Number Average Value
LOANS ORIGINATED 690 $104,620 925 $93,432 1,296 $110,627 215 $23,096 4 $1,504,475 104 $75,687 APPLICATIONS APPROVED, NOT ACCEPTED 28 $93,905 128 $89,661 184 $85,238 49 $27,345 0 $0 8 $89,498 APPLICATIONS DENIED 37 $142,851 213 $74,586 570 $79,593 153 $24,845 0 $0 27 $48,264 APPLICATIONS WITHDRAWN 75 $113,446 116 $98,838 349 $93,023 17 $15,234 0 $0 20 $74,892 FILES CLOSED FOR INCOMPLETENESS 5 $72,430 64 $74,316 69 $102,804 5 $15,372 0 $0 0 $0
Aggregated Statistics For Year 2000(Based on 9 full and 2 partial tracts) A) FHA, FSA/RHS & VA B) Conventional C) Refinancings D) Home Improvement Loans E) Loans on Dwellings For 5+ Families F) Non-occupant Loans on Number Average Value Number Average Value Number Average Value Number Average Value Number Average Value Number Average Value
LOANS ORIGINATED 692 $97,223 915 $88,295 323 $83,564 210 $23,685 2 $66,165 81 $69,199 APPLICATIONS APPROVED, NOT ACCEPTED 26 $86,068 131 $77,952 68 $73,221 113 $24,517 0 $0 14 $74,506 APPLICATIONS DENIED 29 $100,191 268 $70,812 212 $80,325 162 $19,974 0 $0 31 $52,461 APPLICATIONS WITHDRAWN 33 $109,306 108 $103,111 143 $88,944 7 $25,396 0 $0 7 $51,184 FILES CLOSED FOR INCOMPLETENESS 12 $98,240 46 $102,261 105 $89,650 1 $25,000 0 $0 4 $45,660
Aggregated Statistics For Year 1999(Based on 6 full and 3 partial tracts) A) FHA, FSA/RHS & VA B) Conventional C) Refinancings D) Home Improvement Loans E) Loans on Dwellings For 5+ Families F) Non-occupant Loans on Number Average Value Number Average Value Number Average Value Number Average Value Number Average Value Number Average Value
LOANS ORIGINATED 440 $93,936 655 $92,699 531 $82,288 158 $22,901 1 $35,625,300 76 $66,147 APPLICATIONS APPROVED, NOT ACCEPTED 13 $96,151 118 $66,165 108 $138,622 67 $26,007 0 $0 16 $56,991 APPLICATIONS DENIED 28 $94,350 197 $68,652 172 $69,429 145 $18,721 0 $0 18 $53,996 APPLICATIONS WITHDRAWN 29 $93,681 67 $103,495 154 $81,780 20 $18,868 0 $0 10 $60,020 FILES CLOSED FOR INCOMPLETENESS 4 $89,778 17 $98,451 91 $91,801 4 $21,090 0 $0 6 $76,270
Private Mortgage Insurance Companies Aggregated Statistics For Year 2009(Based on 9 full and 6 partial tracts) A) Conventional B) Refinancings C) Non-occupant Loans on Number Average Value Number Average Value Number Average Value
LOANS ORIGINATED 59 $162,414 43 $133,101 0 $0 APPLICATIONS APPROVED, NOT ACCEPTED 5 $205,278 8 $138,960 0 $0 APPLICATIONS DENIED 5 $164,846 6 $131,667 0 $0 APPLICATIONS WITHDRAWN 22 $129,282 3 $168,030 0 $0 FILES CLOSED FOR INCOMPLETENESS 1 $69,540 0 $0 1 $69,540
Aggregated Statistics For Year 2008(Based on 9 full and 6 partial tracts) A) Conventional B) Refinancings C) Non-occupant Loans on Number Average Value Number Average Value Number Average Value
LOANS ORIGINATED 249 $136,083 58 $140,959 37 $92,258 APPLICATIONS APPROVED, NOT ACCEPTED 61 $122,677 35 $196,722 19 $93,785 APPLICATIONS DENIED 18 $103,772 3 $147,293 8 $87,318 APPLICATIONS WITHDRAWN 12 $145,492 4 $98,162 4 $92,305 FILES CLOSED FOR INCOMPLETENESS 3 $152,773 1 $104,000 4 $140,580
Aggregated Statistics For Year 2007(Based on 9 full and 6 partial tracts) A) Conventional B) Refinancings C) Non-occupant Loans on Number Average Value Number Average Value Number Average Value
LOANS ORIGINATED 444 $123,727 43 $130,292 62 $98,916 APPLICATIONS APPROVED, NOT ACCEPTED 53 $144,081 18 $131,049 10 $97,312 APPLICATIONS DENIED 10 $114,917 2 $95,215 2 $95,215 APPLICATIONS WITHDRAWN 9 $139,518 14 $103,160 1 $122,240 FILES CLOSED FOR INCOMPLETENESS 2 $128,900 2 $76,660 4 $72,220
Aggregated Statistics For Year 2006(Based on 9 full and 6 partial tracts) A) Conventional B) Refinancings C) Non-occupant Loans on Number Average Value Number Average Value Number Average Value
LOANS ORIGINATED 218 $128,553 32 $139,292 31 $102,256 APPLICATIONS APPROVED, NOT ACCEPTED 43 $118,999 23 $165,813 5 $84,972 APPLICATIONS DENIED 9 $128,231 0 $0 2 $68,995 APPLICATIONS WITHDRAWN 6 $170,315 5 $213,364 1 $156,650 FILES CLOSED FOR INCOMPLETENESS 2 $57,290 0 $0 2 $57,290
Aggregated Statistics For Year 2005(Based on 9 full and 6 partial tracts) A) Conventional B) Refinancings C) Non-occupant Loans on Number Average Value Number Average Value Number Average Value
LOANS ORIGINATED 235 $121,761 74 $125,816 38 $90,758 APPLICATIONS APPROVED, NOT ACCEPTED 36 $112,970 22 $155,430 10 $77,718 APPLICATIONS DENIED 0 $0 0 $0 0 $0 APPLICATIONS WITHDRAWN 0 $0 2 $135,435 0 $0 FILES CLOSED FOR INCOMPLETENESS 2 $118,905 0 $0 0 $0
Aggregated Statistics For Year 2004(Based on 9 full and 6 partial tracts) A) Conventional B) Refinancings C) Non-occupant Loans on Number Average Value Number Average Value Number Average Value
LOANS ORIGINATED 310 $120,748 104 $121,709 65 $87,715 APPLICATIONS APPROVED, NOT ACCEPTED 42 $116,358 75 $121,567 12 $78,611 APPLICATIONS DENIED 3 $74,777 2 $135,435 0 $0 APPLICATIONS WITHDRAWN 15 $139,016 12 $123,031 10 $113,260 FILES CLOSED FOR INCOMPLETENESS 4 $167,355 2 $105,650 2 $164,275
Aggregated Statistics For Year 2003(Based on 9 full and 6 partial tracts) A) Conventional B) Refinancings C) Non-occupant Loans on Number Average Value Number Average Value Number Average Value
LOANS ORIGINATED 374 $120,378 348 $120,530 48 $84,604 APPLICATIONS APPROVED, NOT ACCEPTED 68 $112,499 54 $115,764 16 $84,770 APPLICATIONS DENIED 8 $108,852 2 $129,430 3 $87,477 APPLICATIONS WITHDRAWN 20 $107,638 28 $136,664 5 $89,764 FILES CLOSED FOR INCOMPLETENESS 0 $0 2 $132,330 0 $0
Aggregated Statistics For Year 2002(Based on 9 full and 2 partial tracts) A) Conventional B) Refinancings C) Non-occupant Loans on Number Average Value Number Average Value Number Average Value
LOANS ORIGINATED 295 $117,823 131 $128,135 30 $87,066 APPLICATIONS APPROVED, NOT ACCEPTED 39 $134,011 32 $114,947 2 $135,550 APPLICATIONS DENIED 3 $136,807 0 $0 2 $87,710 APPLICATIONS WITHDRAWN 34 $147,465 17 $100,526 0 $0 FILES CLOSED FOR INCOMPLETENESS 1 $228,000 2 $119,905 0 $0
Aggregated Statistics For Year 2001(Based on 9 full and 2 partial tracts) A) Conventional B) Refinancings C) Non-occupant Loans on Number Average Value Number Average Value Number Average Value
LOANS ORIGINATED 267 $113,332 93 $114,084 15 $98,877 APPLICATIONS APPROVED, NOT ACCEPTED 30 $96,122 16 $102,234 7 $70,503 APPLICATIONS DENIED 5 $151,174 4 $120,598 3 $103,047 APPLICATIONS WITHDRAWN 10 $137,338 10 $112,285 0 $0 FILES CLOSED FOR INCOMPLETENESS 2 $48,900 0 $0 2 $48,900
Aggregated Statistics For Year 2000(Based on 9 full and 2 partial tracts) A) Conventional B) Refinancings C) Non-occupant Loans on Number Average Value Number Average Value Number Average Value
LOANS ORIGINATED 281 $105,588 31 $112,394 26 $77,115 APPLICATIONS APPROVED, NOT ACCEPTED 36 $111,876 7 $95,330 4 $64,402 APPLICATIONS DENIED 9 $82,791 1 $86,000 2 $92,695 APPLICATIONS WITHDRAWN 12 $88,203 0 $0 0 $0 FILES CLOSED FOR INCOMPLETENESS 10 $109,081 2 $141,885 0 $0
Aggregated Statistics For Year 1999(Based on 6 full and 3 partial tracts) A) Conventional B) Refinancings C) Non-occupant Loans on Number Average Value Number Average Value Number Average Value
LOANS ORIGINATED 214 $108,736 75 $103,331 9 $71,976 APPLICATIONS APPROVED, NOT ACCEPTED 14 $103,264 18 $95,156 4 $64,750 APPLICATIONS DENIED 11 $109,956 3 $97,747 2 $69,780 APPLICATIONS WITHDRAWN 5 $106,392 3 $137,720 0 $0 FILES CLOSED FOR INCOMPLETENESS 2 $133,185 3 $122,640 0 $0
2003 - 2018 National Fire Incident Reporting System (NFIRS) incidents See full 2006 National Fire Incident Reporting System statistics for zip code 76017, Texas
Most common first names in zip code 76017 among deceased individuals Name Count Lived (average)
Robert 62 69.6 years Mary 61 77.8 years James 59 72.2 years John 41 74.0 years William 39 72.2 years Dorothy 31 78.8 years Charles 26 68.3 years Richard 24 65.5 years Margaret 23 78.4 years George 21 67.8 years
Most common last names in zip code 76017 among deceased individuals Last name Count Lived (average)
Smith 36 72.4 years Davis 17 78.1 years Moore 15 79.1 years Williams 14 71.3 years Jones 13 67.3 years Hill 13 75.9 years Brown 13 69.1 years Wilson 12 82.7 years Johnson 12 76.2 years Taylor 9 71.6 years
Businesses in zip code 76017
Name Count Name Count
7-Eleven 3 Kroger 1 AT&T 1 LA Fitness 1 Albertsons 2 La-Z-Boy 1 Applebee's 1 Lane Furniture 1 Ashley Furniture 1 Little Caesars Pizza 1 AutoZone 1 Long John Silver's 1 Baskin-Robbins 1 McDonald's 4 Blockbuster 1 Nike 2 CVS 1 OfficeMax 1 Carl\s Jr. 1 Olive Garden 1 Chevrolet 1 On The Border 1 Chick-Fil-A 1 Panda Express 2 Chipotle 1 Payless 1 Cinnabon 1 Pizza Hut 2 DHL 1 Plato's Closet 1 Dennys 1 RadioShack 1 Discount Tire 2 Ryan's Grill 1 Domino's Pizza 2 SONIC Drive-In 3 FedEx 8 Safeway 1 Firestone Complete Auto Care 1 Starbucks 2 Ford 1 Subway 1 GNC 1 T-Mobile 4 GameStop 1 T.G.I. Driday's 1 H&R Block 3 Taco Bell 2 Hobby Lobby 1 The Room Place 1 Home Depot 1 Toyota 1 Honda 1 UPS 4 IHOP 2 Verizon Wireless 2 InTown Suites 1 Vons 1 Jack In The Box 1 Waffle House 1 KFC 1 Walgreens 1 Kohl's 1 Walmart 4

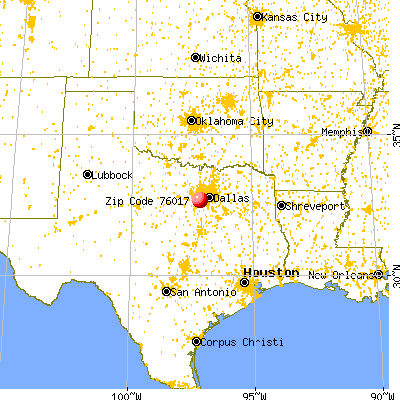


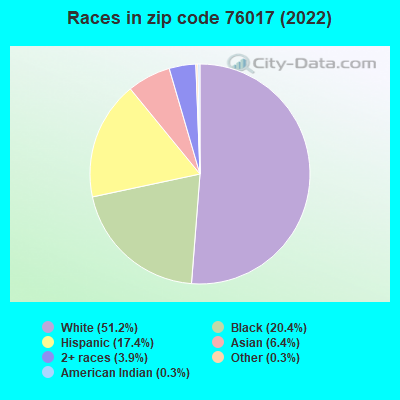


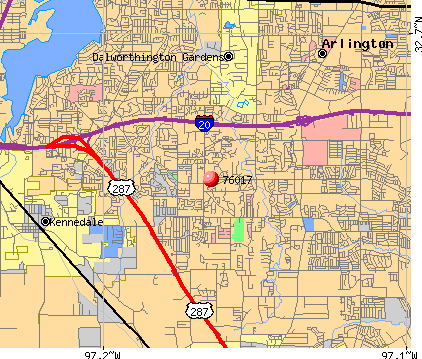 Nearest zip codes: 76001, 76016, 76015, 76013, 76060, 76018.
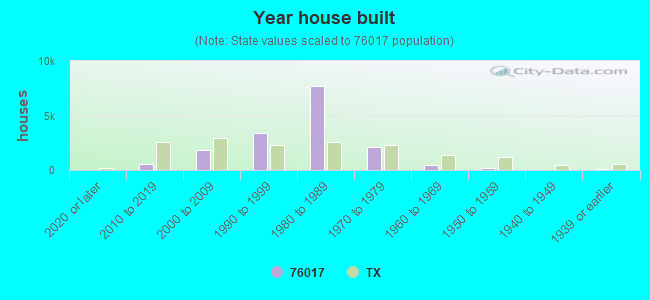
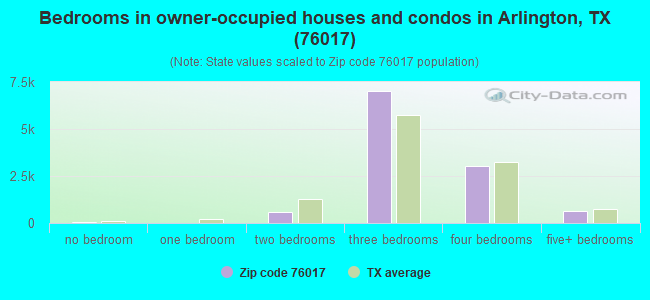
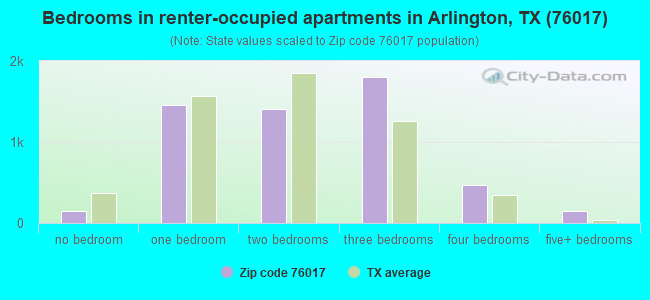
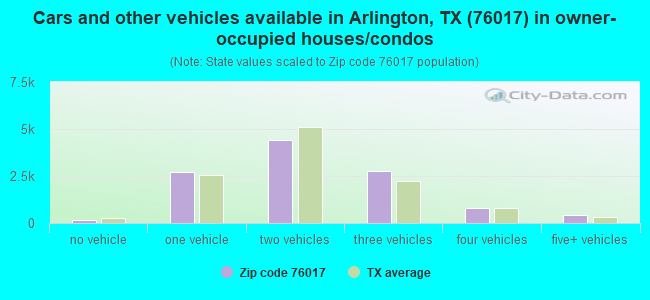
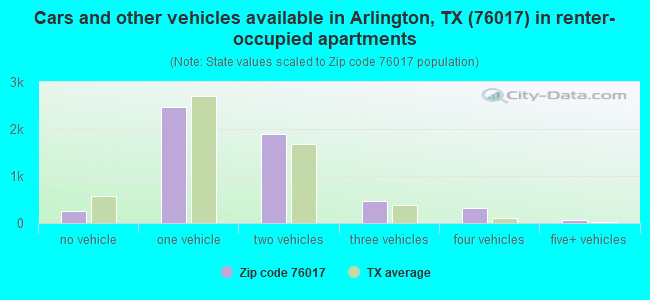


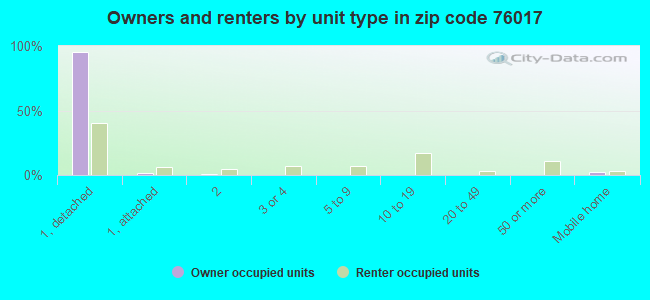
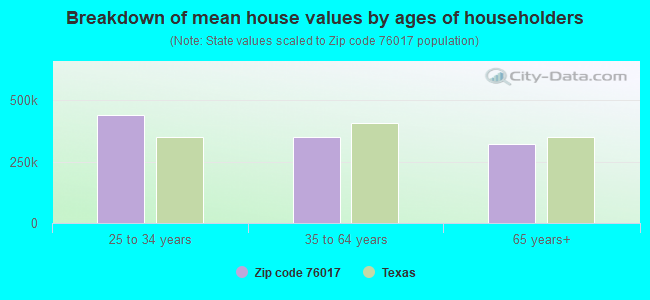


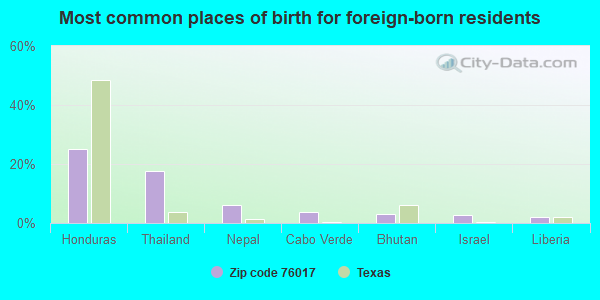
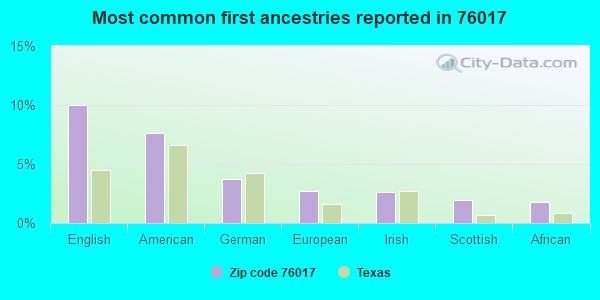
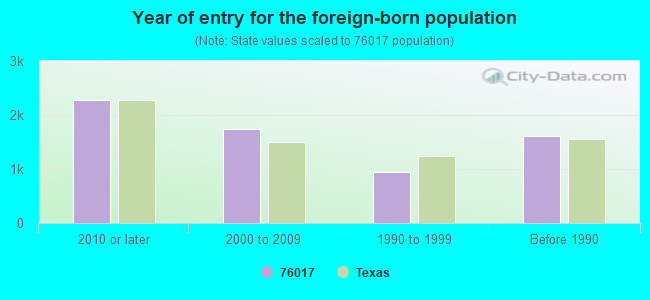

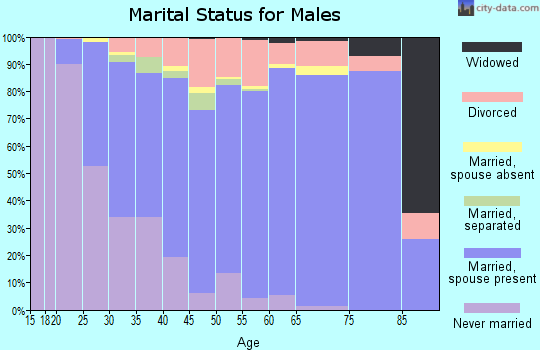
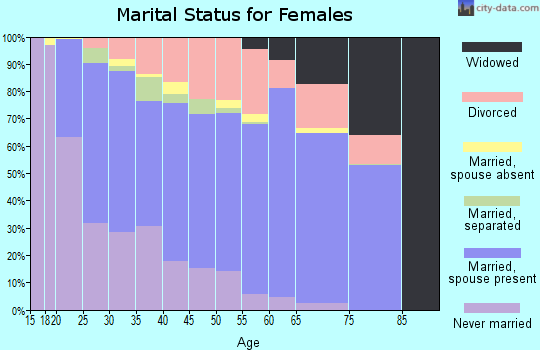
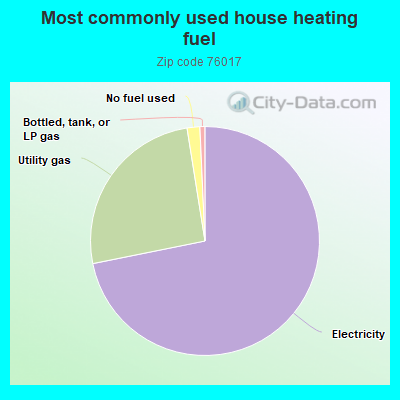
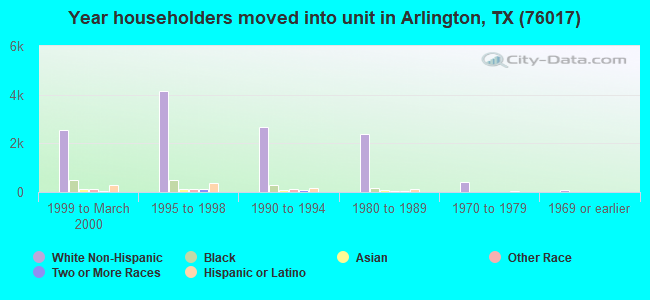
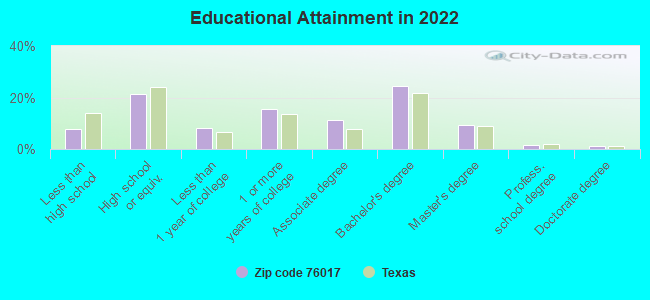
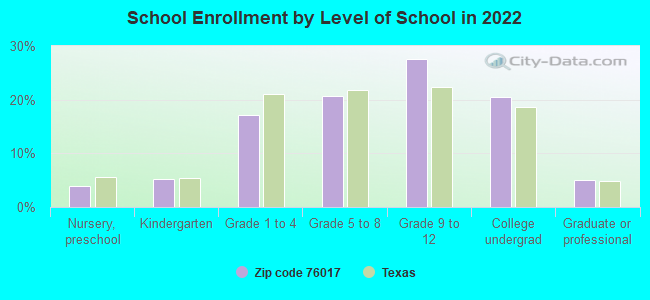
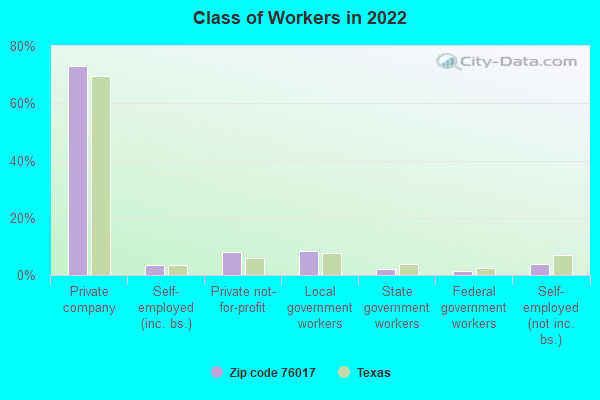
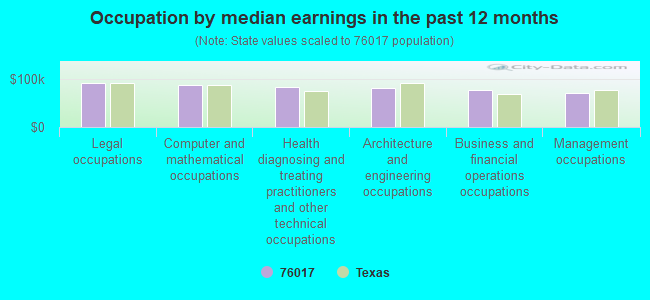
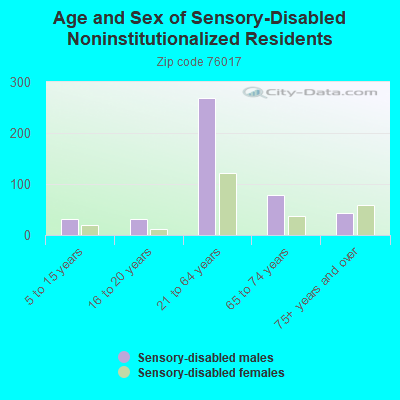
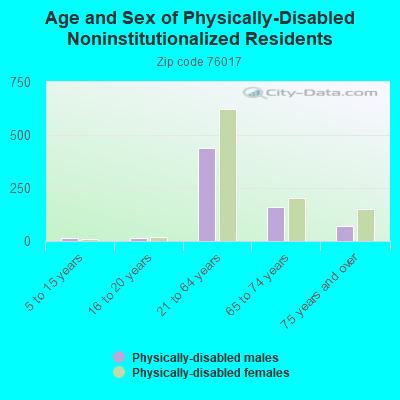
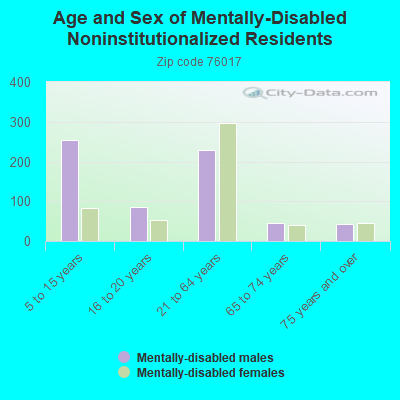
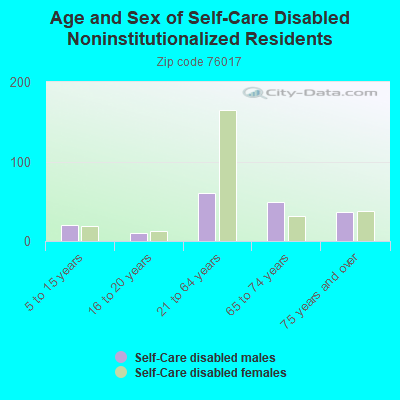
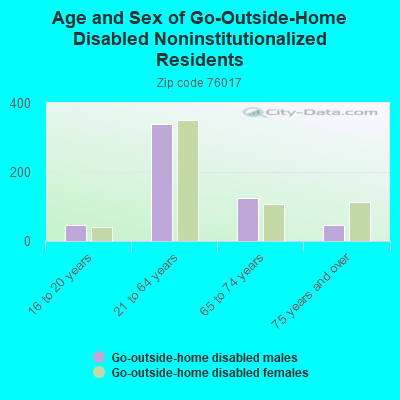
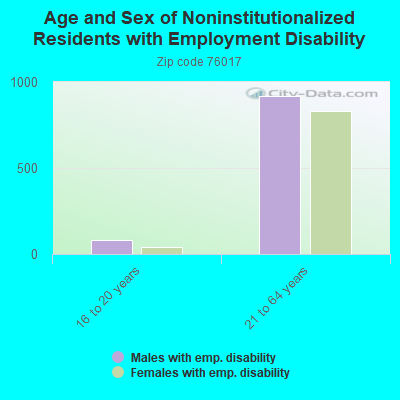
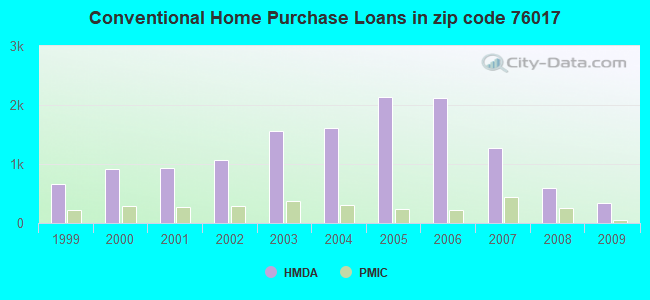
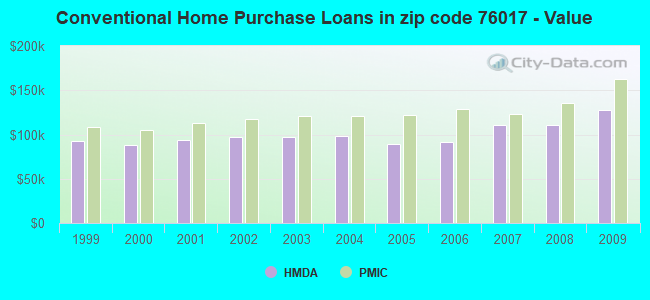
 According to the data from the years 2003 - 2018 the average number of fires per year is 89. The highest number of reported fires - 142 took place in 2006, and the least - 0 in 2004. The data has an increasing trend.
 When looking into fire subcategories, the most reports belonged to: Outside Fires (39.7%), and Structure Fires (32.7%).