Estimated zip code population in 2022: 28,515 Zip code population in 2010: 25,689 Zip code population in 2000: 25,488
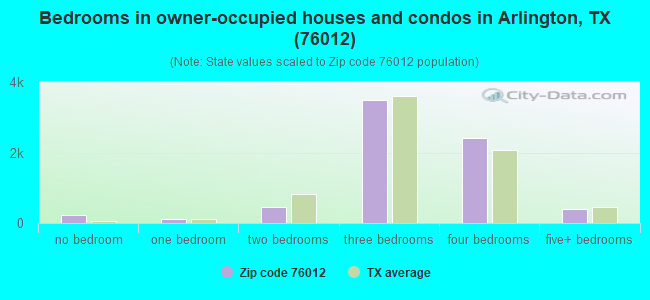
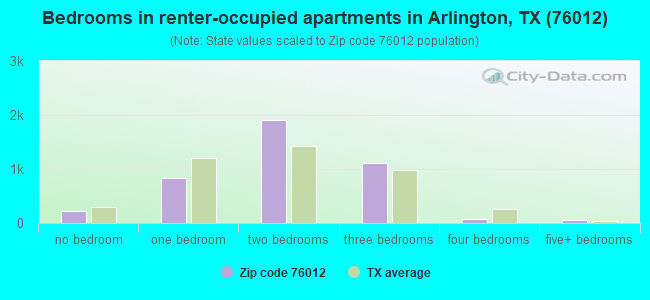
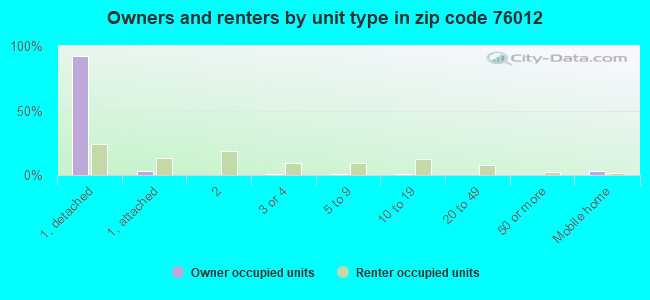
Houses and condos: 12,014 Renter-occupied apartments: 4,237
% of renters here:
37%
State:
38%
March 2022 cost of living index in zip code 76012: 95.4 (near average, U.S. average is 100)
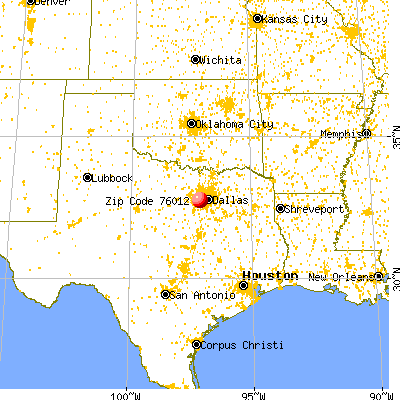
Land area: 8.2 sq. mi. Water area: 0.1 sq. mi.
Population density: 3,488 people per square mile
(average).
OSM Map
General Map
Google Map
MSN Map
OSM Map
General Map
Google Map
MSN Map
OSM Map
General Map
Google Map
MSN Map
OSM Map
General Map
Google Map
MSN Map
Please wait while loading the map...
Real estate property taxes paid for housing units in 2022:
This zip code:
1.5% ($4,811)
Texas:
1.5% ($4,050)
Median real estate property taxes paid for housing units with mortgages in 2022: $5,636 (1.7%) Median real estate property taxes paid for housing units with no mortgage in 2022: $3,869 (1.2%)
Averages for the 2020 tax year for zip code 76012, filed in 2021:
Average Adjusted Gross Income (AGI) in 2020: $73,436 (Individual Income Tax Returns)
Here:
$73,436
State:
$77,054
Salary/wage: $60,926 (reported on 79.2% of returns)
Here:
$60,926
State:
$62,766
(% of AGI for various income ranges: 1200.5% for AGIs below $25k, 3584.7% for AGIs $25k-50k, 6298.7% for AGIs $50k-75k, 9317.6% for AGIs $75k-100k, 17690.0% for AGIs $100k-200k, 58037.3% for AGIs over 200k)
Taxable interest for individuals: $2,159 (reported on 27.3% of returns)
This zip code:
$2,159
Texas:
$2,665
(% of AGI for various income ranges: 11.4% for AGIs below $25k, 25.6% for AGIs $25k-50k, 42.9% for AGIs $50k-75k, 74.3% for AGIs $75k-100k, 186.7% for AGIs $100k-200k, 1328.8% for AGIs over 200k)
Ordinary dividends: $8,859 (reported on 20.6% of returns)
Here:
$8,859
State:
$10,044
(% of AGI for various income ranges: 29.6% for AGIs below $25k, 38.9% for AGIs $25k-50k, 124.9% for AGIs $50k-75k, 232.3% for AGIs $75k-100k, 521.3% for AGIs $100k-200k, 4844.2% for AGIs over 200k)
Net capital gain/loss in AGI: +$22,339 (reported on 19.3% of returns)
Here:
+$22,339
State:
+$39,590
(% of AGI for various income ranges: 3.0% for AGIs below $25k, 21.9% for AGIs $25k-50k, 97.1% for AGIs $50k-75k, 203.7% for AGIs $75k-100k, 637.7% for AGIs $100k-200k, 17460.4% for AGIs over 200k)
Profit/loss from business: +$10,845 (reported on 21.6% of returns)
Here:
+$10,845
State:
+$10,888
(% of AGI for various income ranges: 103.3% for AGIs below $25k, 134.3% for AGIs $25k-50k, 161.8% for AGIs $50k-75k, 396.9% for AGIs $75k-100k, 797.4% for AGIs $100k-200k, 3806.2% for AGIs over 200k)
Taxable individual retirement arrangement distribution: $21,894 (reported on 10.5% of returns)
76012:
$21,894
Texas:
$24,740
(% of AGI for various income ranges: 51.5% for AGIs below $25k, 119.2% for AGIs $25k-50k, 242.6% for AGIs $50k-75k, 606.7% for AGIs $75k-100k, 908.6% for AGIs $100k-200k, 2794.6% for AGIs over 200k)
Self-employed (Keogh) retirement plans: $22,167 (reported on 0.5% of returns)
76012:
$22,167
Texas:
$29,298
(% of AGI for various income ranges: 41.0% for AGIs $100k-200k, 331.9% for AGIs over 200k)
Total itemized deductions: $35,560 (reported on 8.4% of returns)
Here:
$35,560
State:
$40,428
(% of AGI for various income ranges: 57.0% for AGIs below $25k, 132.3% for AGIs $25k-50k, 271.0% for AGIs $50k-75k, 536.8% for AGIs $75k-100k, 919.7% for AGIs $100k-200k, 6075.0% for AGIs over 200k)
Charity contributions: $16,162 (reported on 7.0% of returns)
Here:
$16,162
State:
$18,201
(% of AGI for various income ranges: 4.7% for AGIs below $25k, 29.2% for AGIs $25k-50k, 67.1% for AGIs $50k-75k, 149.3% for AGIs $75k-100k, 338.7% for AGIs $100k-200k, 3079.6% for AGIs over 200k)
Taxes paid: $7,141 (reported on 8.2% of returns)
76012:
$7,141
State:
$7,821
(% of AGI for various income ranges: 9.0% for AGIs below $25k, 29.3% for AGIs $25k-50k, 63.4% for AGIs $50k-75k, 129.5% for AGIs $75k-100k, 218.2% for AGIs $100k-200k, 914.6% for AGIs over 200k)
Earned income credit: $2,365 (reported on 16.7% of returns)
Here:
$2,365
State:
$2,584
(% of AGI for various income ranges: 107.3% for AGIs below $25k, 75.5% for AGIs $25k-50k, 0.9% for AGIs $50k-75k)
Percentage of individuals using paid preparers for their 2020 taxes: 90.9%
Here:
91%
State:
92%
(% for various income ranges: 90.3% for AGIs below $25k, 92.0% for AGIs $25k-50k, 91.6% for AGIs $50k-75k, 91.5% for AGIs $75k-100k, 89.9% for AGIs $100k-200k, 90.4% for AGIs over 200k)
Averages for the 2012 tax year for zip code 76012, filed in 2013:
Average Adjusted Gross Income (AGI) in 2012: $67,061 (Individual Income Tax Returns)
Here:
$67,061
State:
$65,384
Salary/wage: $55,248 (reported on 80.7% of returns)
Here:
$55,248
State:
$52,524
(% of AGI for various income ranges: 75.9% for AGIs below $25k, 77.6% for AGIs $25k-50k, 70.7% for AGIs $50k-75k, 69.5% for AGIs $75k-100k, 70.8% for AGIs $100k-200k, 52.9% for AGIs over 200k)
Taxable interest for individuals: $2,061 (reported on 33.7% of returns)
This zip code:
$2,061
Texas:
$2,372
(% of AGI for various income ranges: 0.8% for AGIs below $25k, 0.9% for AGIs $25k-50k, 1.0% for AGIs $50k-75k, 0.9% for AGIs $75k-100k, 0.8% for AGIs $100k-200k, 1.5% for AGIs over 200k)
Ordinary dividends: $7,360 (reported on 22.6% of returns)
Here:
$7,360
State:
$9,721
(% of AGI for various income ranges: 1.7% for AGIs below $25k, 1.3% for AGIs $25k-50k, 1.8% for AGIs $50k-75k, 1.8% for AGIs $75k-100k, 2.2% for AGIs $100k-200k, 3.9% for AGIs over 200k)
Net capital gain/loss in AGI: +$7,663 (reported on 18.6% of returns)
Here:
+$7,663
State:
+$35,319
(% of AGI for various income ranges: 0.3% for AGIs $50k-75k, 1.0% for AGIs $75k-100k, 1.2% for AGIs $100k-200k, 5.5% for AGIs over 200k)
Profit/loss from business: +$13,842 (reported on 20.4% of returns)
Here:
+$13,842
State:
+$13,732
(% of AGI for various income ranges: 8.8% for AGIs below $25k, 4.0% for AGIs $25k-50k, 2.8% for AGIs $50k-75k, 3.2% for AGIs $75k-100k, 3.6% for AGIs $100k-200k, 4.7% for AGIs over 200k)
Taxable individual retirement arrangement distribution: $19,630 (reported on 13.5% of returns)
76012:
$19,630
Texas:
$19,511
(% of AGI for various income ranges: 3.2% for AGIs below $25k, 3.2% for AGIs $25k-50k, 4.1% for AGIs $50k-75k, 4.3% for AGIs $75k-100k, 4.7% for AGIs $100k-200k, 3.5% for AGIs over 200k)
Self-employment retirement plans: $16,544 (reported on 0.7% of returns)
76012:
$16,544
Texas:
$23,938
(% of AGI for various income ranges: 0.2% for AGIs $25k-50k, 0.2% for AGIs $100k-200k, 0.3% for AGIs over 200k)
Total itemized deductions: $22,171 (17% of AGI, reported on 30.4% of returns)
Here:
$22,171
State:
$24,724
Here:
17.0% of AGI
State:
15.9% of AGI
(% of AGI for various income ranges: 8.1% for AGIs below $25k, 10.0% for AGIs $25k-50k, 11.5% for AGIs $50k-75k, 11.4% for AGIs $75k-100k, 10.4% for AGIs $100k-200k, 9.2% for AGIs over 200k)
Charity contributions: $6,775 (reported on 25.4% of returns)
Here:
$6,775
State:
$6,808
(% of AGI for various income ranges: 0.7% for AGIs below $25k, 1.6% for AGIs $25k-50k, 2.1% for AGIs $50k-75k, 2.2% for AGIs $75k-100k, 2.7% for AGIs $100k-200k, 3.6% for AGIs over 200k)
Taxes paid: $6,043 (reported on 29.8% of returns)
76012:
$6,043
State:
$6,921
(% of AGI for various income ranges: 1.5% for AGIs below $25k, 2.1% for AGIs $25k-50k, 3.0% for AGIs $50k-75k, 3.3% for AGIs $75k-100k, 3.1% for AGIs $100k-200k, 2.4% for AGIs over 200k)
Earned income credit: $2,485 (reported on 18.3% of returns)
Here:
$2,485
State:
$2,570
(% of AGI for various income ranges: 8.0% for AGIs below $25k, 1.0% for AGIs $25k-50k)
Percentage of individuals using paid preparers for their 2012 taxes: 50.0%
Here:
50%
State:
51%
(% for various income ranges: 49.4% for AGIs below $25k, 50.2% for AGIs $25k-50k, 47.4% for AGIs $50k-75k, 46.0% for AGIs $75k-100k, 50.0% for AGIs $100k-200k, 67.8% for AGIs over 200k)
Averages for the 2004 tax year for zip code 76012, filed in 2005:
Average Adjusted Gross Income (AGI) in 2004: $60,198 (Individual Income Tax Returns)
Here:
$60,198
State:
$47,881
Salary/wage: $52,321 (reported on 81.5% of returns)
Here:
$52,321
State:
$41,947
(% of AGI for various income ranges: 186.8% for AGIs below $10k, 76.5% for AGIs $10k-25k, 77.0% for AGIs $25k-50k, 73.1% for AGIs $50k-75k, 75.2% for AGIs $75k-100k, 65.4% for AGIs over 100k)
Taxable interest for individuals: $2,483 (reported on 47.4% of returns)
This zip code:
$2,483
Texas:
$2,255
(% of AGI for various income ranges: 15.1% for AGIs below $10k, 2.7% for AGIs $10k-25k, 1.8% for AGIs $25k-50k, 1.6% for AGIs $50k-75k, 1.6% for AGIs $75k-100k, 1.9% for AGIs over 100k)
Taxable dividends: $3,229 (reported on 29.8% of returns)
Here:
$3,229
State:
$4,261
(% of AGI for various income ranges: 11.3% for AGIs below $10k, 1.5% for AGIs $10k-25k, 1.2% for AGIs $25k-50k, 1.3% for AGIs $50k-75k, 1.3% for AGIs $75k-100k, 1.7% for AGIs over 100k)
Net capital gain/loss: +$11,061 (reported on 25.6% of returns)
Here:
+$11,061
State:
+$16,110
(% of AGI for various income ranges: -4.0% for AGIs below $10k, 0.0% for AGIs $10k-25k, 0.4% for AGIs $25k-50k, 0.8% for AGIs $50k-75k, 1.5% for AGIs $75k-100k, 8.3% for AGIs over 100k)
Profit/loss from business: +$15,017 (reported on 18.4% of returns)
Here:
+$15,017
State:
+$11,013
(% of AGI for various income ranges: 3.2% for AGIs below $10k, 6.6% for AGIs $10k-25k, 3.7% for AGIs $25k-50k, 4.0% for AGIs $50k-75k, 3.4% for AGIs $75k-100k, 5.1% for AGIs over 100k)
IRA payment deduction: $3,500 (reported on 3.0% of returns)
76012:
$3,500
Texas:
$3,120
(% of AGI for various income ranges: 0.2% for AGIs $10k-25k, 0.3% for AGIs $25k-50k, 0.2% for AGIs $50k-75k, 0.2% for AGIs $75k-100k, 0.1% for AGIs over 100k)
Self-employed pension: $15,073 (reported on 1.3% of returns)
Here:
$15,073
Texas:
$16,401
(% of AGI for various income ranges: 0.1% for AGIs $25k-50k, 0.2% for AGIs $50k-75k, 0.3% for AGIs $75k-100k, 0.5% for AGIs over 100k)
Total itemized deductions: $18,760 (18% of AGI, reported on 37.3% of returns)
Here:
$18,760
State:
$19,631
Here:
17.9% of AGI
State:
18.9% of AGI
(% of AGI for various income ranges: 30.2% for AGIs below $10k, 9.8% for AGIs $10k-25k, 12.2% for AGIs $25k-50k, 15.4% for AGIs $50k-75k, 15.0% for AGIs $75k-100k, 9.5% for AGIs over 100k)
Charity contributions deductions: $4,482 (4% of AGI, reported on 32.9% of returns)
Here:
$4,482
State:
$4,753
Here:
4.1% of AGI
State:
4.2% of AGI
(% of AGI for various income ranges: 1.7% for AGIs below $10k, 1.2% for AGIs $10k-25k, 2.0% for AGIs $25k-50k, 2.5% for AGIs $50k-75k, 3.0% for AGIs $75k-100k, 2.6% for AGIs over 100k)
Total tax: $11,624 (reported on 76.0% of returns)
76012:
$11,624
State:
$9,058
(% of AGI for various income ranges: 6.2% for AGIs below $10k, 4.0% for AGIs $10k-25k, 7.1% for AGIs $25k-50k, 10.3% for AGIs $50k-75k, 11.3% for AGIs $75k-100k, 20.0% for AGIs over 100k)
Earned income credit: $1,871 (reported on 14.4% of returns)
Here:
$1,871
State:
$2,024
Percentage of individuals using paid preparers for their 2004 taxes: 51.7%
Here:
52%
State:
57%
(% for various income ranges: 47.7% for AGIs below $10k, 55.3% for AGIs $10k-25k, 52.3% for AGIs $25k-50k, 48.6% for AGIs $50k-75k, 48.9% for AGIs $75k-100k, 54.9% for AGIs over 100k)
Likely homosexual households (counted as self-reported same-sex unmarried-partner households)
Lesbian couples: 0.0% of all households
Gay men: 0.4% of all households
Household received Food Stamps/SNAP in the past 12 months: 1,410 Household did not receive Food Stamps/SNAP in the past 12 months: 9,924
Women who had a birth in the past 12 months: 349 (205 now married, 141 unmarried) Women who did not have a birth in the past 12 months: 6,179 (2,601 now married, 3,581 unmarried)
Housing units in zip code 76012 with a mortgage: 3,826 (144 second mortgage, 156 both second mortgage and home equity loan) Houses without a mortgage: 72
Median monthly owner costs for units with a mortgage: $1,902 Median monthly owner costs for units without a mortgage: $881
Residents with income below the poverty level in 2022:
This zip code:
15.6%
Whole state:
14.0%
Residents with income below 50% of the poverty level in 2022:
This zip code:
7.9%
Whole state:
7.4%
Median number of rooms in houses and condos:
Here:
6.9
State:
6.3
Median number of rooms in apartments:
Here:
4.5
State:
4.0
Notable locations in this zip code not listed on our city pages
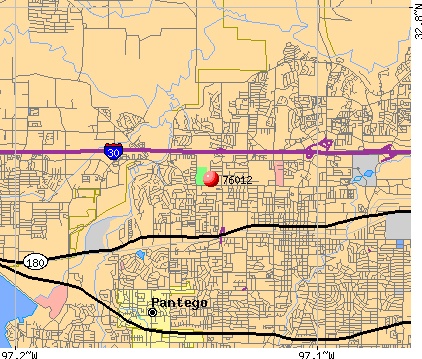
Notable locations in zip code 76012: Fort Worth Village Creek Sewage Disposal (A), Arlington Texas Fire Department Station 4 (B). Display/hide their locations on the map
Churches in zip code 76012 include: Westside Missionary Church (A), Lamar Baptist Church (B), Parkview Baptist Church (C), Saint Mary the Virgin Catholic Church (D), Most Blessed Sacrament Catholic Church in Arlington (E), Church of Saint Mary the Virgin (F), Tabernacle Baptist Church (G), The Church of Jesus Christ of Latter Day Saints (H), Saint Stephen United Methodist Church (I). Display/hide their locations on the map
Parks in zip code 76012 include: Pirie Park (1), Randol Mill Park (2), Cravens Field (3), Lamar High School Baseball Field (4), Gibbins Park (5). Display/hide their locations on the map
Tourist attractions (not listed on the city page) : Craig's Bon Voyage Travel (600A Starlinda Court), Fabbri Amusement Inc (405 Dodson Lake Drive).
3,191 married couples with children.
2,103 single-parent households (587 men, 1,516 women).
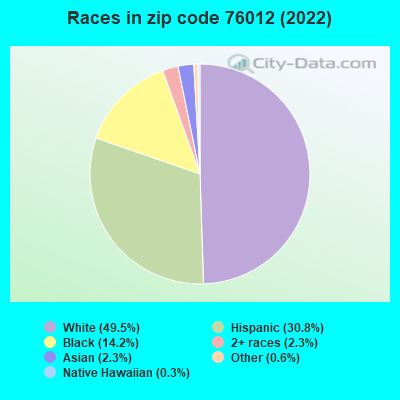
69.1% of residents of 76012 zip code speak English at home.
24.8% of residents speak Spanish at home (58% very well, 27% well, 12% not well, 3% not at all).
3.3% of residents speak other Indo-European language at home (50% very well, 50% well).
1.4% of residents speak Asian or Pacific Island language at home (77% very well, 9% well, 14% not well).
1.9% of residents speak other language at home (76% very well, 22% well, 3% not at all).
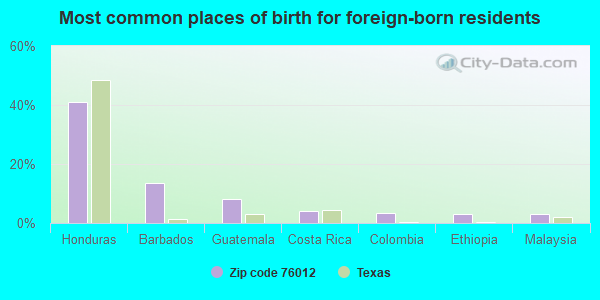
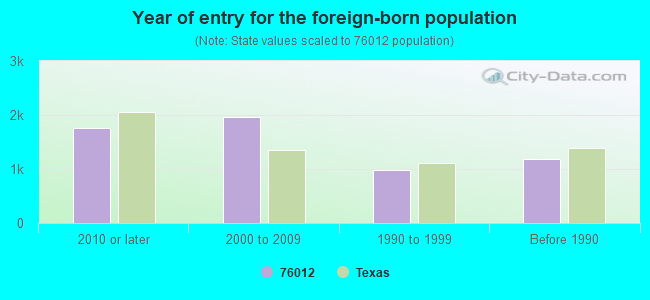
Foreign born population: 5,487 (19.2%) (43.2% of them are naturalized citizens)
AIRLINE EQUIPMENT & SV CO# (1911 W DIVISION in ARLINGTON, TX)
(Resource Conservation and Recovery Act (tracking hazardous waste)) Business NAICS classification: OTHER COMMERCIAL AND SERVICE INDUSTRY MACHINERY MANUFACTURING.; INDUSTRIAL TRUCK, TRACTOR, TRAILER, AND STACKER MACHINERY MANUFACTURING.
Housing units lacking complete plumbing facilities: 0.4% Housing units lacking complete kitchen facilities: 2.2%
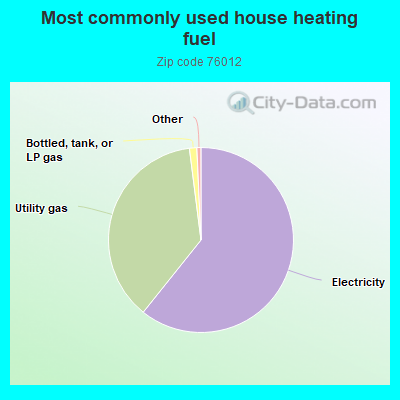
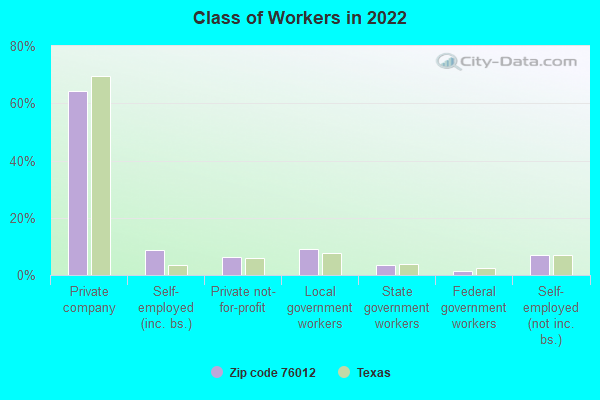
60.8%Electricity
37.3%Utility gas
1.3%Bottled, tank, or LP gas
Population in 1990: 24,141. Population change in the 1990s: +1,347 (+5.6%).
Place of birth for U.S.-born residents:
This state: 14,388
Northeast: 1,014
Midwest: 2,809
South: 2,696
West: 1,701
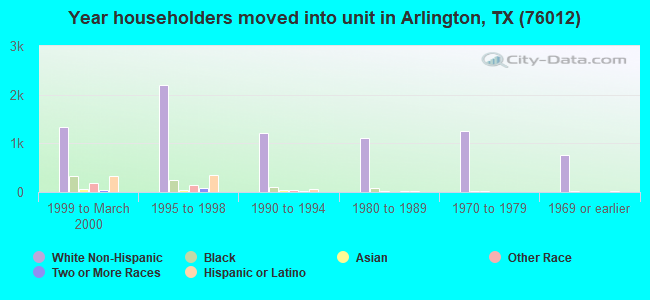
51% of the 76012 zip code residents lived in the same house 5 years ago. Out of people who lived in different houses, 65% lived in this county. Out of people who lived in different counties, 50% lived in Texas.
91% of the 76012 zip code residents lived in the same house 1 year ago. Out of people who lived in different houses, 41% moved from this county. Out of people who lived in different houses, 37% moved from different county within same state. Out of people who lived in different houses, 15% moved from different state. Out of people who lived in different houses, 10% moved from abroad.
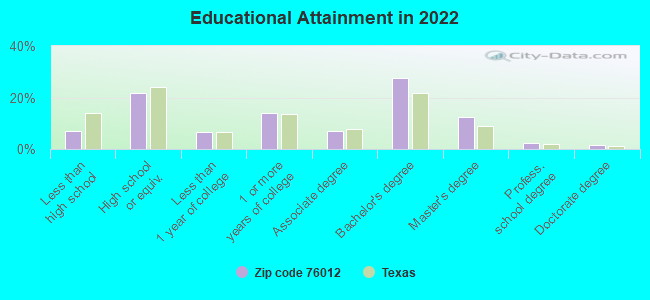
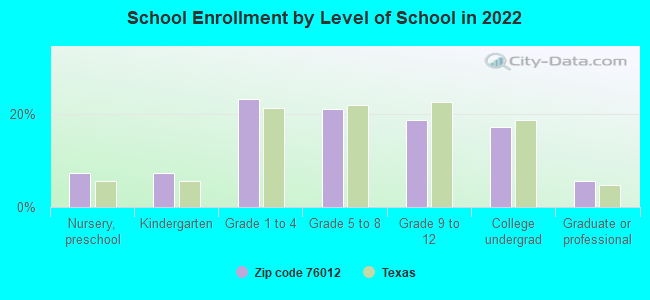
Private vs. public school enrollment:
Students in private schools in grades 1 to 8 (elementary and middle school): 368
Here:
13.7%
Texas:
8.8%
Students in private schools in grades 9 to 12 (high school): 165
Here:
14.5%
Texas:
8.0%
Students in private undergraduate colleges: 312
Here:
30.0%
Texas:
16.2%
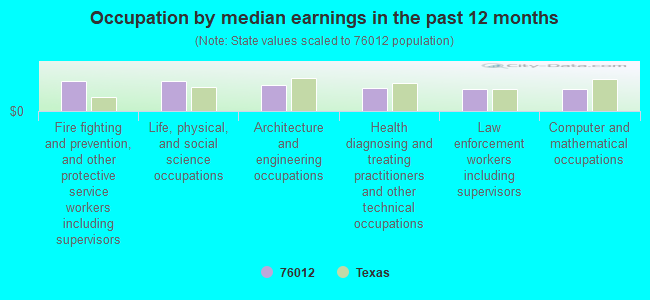
Occupation by median earnings in the past 12 months ($)
109,142Fire fighting and prevention, and other protective service workers including supervisors
108,336Life, physical, and social science occupations
94,584Architecture and engineering occupations
84,100Health diagnosing and treating practitioners and other technical occupations
80,236Law enforcement workers including supervisors
79,934Computer and mathematical occupations
Companies with biggest federal contracts located in this zip code (ARLINGTON, TX):
INDIAN AEROSPACE, INC (427A W FORK DR; small business) : $5,224,064 in 360 contractsfrom 1999 to 2006
Contracts for Hardware, Weapon System, Packing and Gasket Materials, Circuit Breakers, Batteries, Rechargeable, and moreby Defense Logistics Agency, Navy, Army, Air Force, and others Signed by year:2000: $0; 2001: $66,248; 2002: $401,566; 2003: $376,010; 2004: $1,724,057; 2005: $1,897,809; 2006: $696,417.
Biggest contracts:
$129,325 with Defense Logistics Agency for Hardware, Weapon System. Signed on 2005-05-13. Completion date: 2005-09-25.
$129,325, same as above.Signed on 2005-05-13. Completion date: 2005-09-25.
$98,907 with Defense Logistics Agency for Packing and Gasket Materials. Signed on 2004-05-05. Completion date: 2004-05-05.
$95,239 with Defense Logistics Agency for Circuit Breakers. Signed on 2002-08-19. Completion date: 2003-09-25.
BETA ENGINEERING, INC (468 DODSON LAKE DR) : $5,074,076 in 317 contractsfrom 1999 to 2006
Contracts for Airframe Structural Components, Power and Hand Pumps, Aircraft Hydraulic, Vacuum, and De-icing System Components, Hardware, Commercial, and moreby Defense Logistics Agency, Army, Air Force Signed by year:2000: $314,438; 2001: $1,019,665; 2002: $714,305; 2003: $235,739; 2004: $482,946; 2005: $1,530,141; 2006: $572,925.
Biggest contracts:
$293,306 with Defense Logistics Agency for Airframe Structural Components. Signed on 2005-02-09. Completion date: 2005-11-06.
$244,653, same as above.Signed on 2002-02-27. Completion date: 2003-03-05.
$134,775 with Defense Logistics Agency for Power and Hand Pumps. Signed on 2003-10-29. Completion date: 2004-04-28.
$99,830 with Defense Logistics Agency for Aircraft Hydraulic, Vacuum, and De-icing System Components. Signed on 2001-07-26. Completion date: 2001-12-23.
REFA INTERNATIONAL, INC (414 WEST FORK DR; small business) : $3,408,544 in 241 contractsfrom 2000 to 2006
Contracts for Nuts and Washers, Hose, Pipe, Tube, Lubrication, and Railing Fittings, Hardware, Commercial, Screws, and moreby Navy, Defense Logistics Agency, U.S. Coast Guard Signed by year:2000: $540,337; 2001: $838,083; 2002: $477,034; 2003: $231,069; 2004: $629,279; 2005: $529,562; 2006: $163,180.
Biggest contracts:
$93,075 with Navy for Nuts and Washers. Signed on 2001-06-20. Completion date: 2002-03-15.
$88,200 with Defense Logistics Agency for Hose, Pipe, Tube, Lubrication, and Railing Fittings. Signed on 2003-11-08. Completion date: 2004-10-03.
$78,475 with Defense Logistics Agency for Hardware, Commercial. Signed on 2004-04-05. Completion date: 2004-07-30.
$69,000 with Defense Logistics Agency for Nuts and Washers. Signed on 2000-11-21. Completion date: 2000-12-04.
FALCON AEROSPACE INC (3307 W DIVISION ST; small business) : $3,031,536 in 257 contractsfrom 2000 to 2006
Contracts for Bolts, Helicopter Rotor Blades, Drive Mechanisms and Components, Packing and Gasket Materials, Semiconductor Devices and Associated Hardware, and moreby Air Force, Defense Logistics Agency, Navy Signed by year:2000: $216,693; 2001: $100,118; 2002: $120,420; 2003: $55,340; 2004: $982,048; 2005: $1,041,040; 2006: $515,877.
Biggest contracts:
$355,789 with Air Force for Bolts. Signed on 2004-03-04. Completion date: 2004-11-30.
$99,360 with Defense Logistics Agency for Helicopter Rotor Blades, Drive Mechanisms and Components. Signed on 2005-04-05. Completion date: 2005-11-11.
$94,588 with Air Force for Bolts. Signed on 2006-02-21. Completion date: 2006-11-30.
$92,364 with Defense Logistics Agency for Packing and Gasket Materials. Signed on 2002-06-26. Completion date: 2003-01-21.
A E PETSCHE COMPANY INC (2112 W DIVISION ST; small business) : $2,568,985 in 195 contractsfrom 1999 to 2005
Contracts for Wire and Cable, Electrical, Connectors, Electrical, Chain and Wire Rope, Sound Recording and Reproducing Equipment, and moreby Bureau of Prisoners/Federal Prison System, Air Force, Navy, United States Coast Guard (disused code: now 7008), and others Signed by year:2000: $907,743; 2001: $682,000; 2002: $0; 2003: $58,699; 2004: $409,770; 2005: $257,773; 2006: $0.
Biggest contracts:
$192,500 with Bureau of Prisoners/Federal Prison System for Wire and Cable, Electrical. Signed on 2004-04-12. Completion date: 2008-04-30.
$172,000 with Bureau of Prisoners/Federal Prison System for Connectors, Electrical. Taking place in GA. Signed on 1999-11-15. Completion date: 2001-06-15.
$112,000, same as above.Signed on 2001-04-15. Completion date: 2001-07-15.
$102,824 with Bureau of Prisoners/Federal Prison System for Chain and Wire Rope. Signed on 2005-06-27. Completion date: 2008-04-30.
UNIVERSITY OF MONTANA (No data from D and B) : $416,387 in 16 contractsfrom 1999 to 2003
Contracts for Chemical/Biological Studies and Analyses, Lease or Rental of Facilities -- Office Buildings by Forest Service (disused code: now 12C2), Forest Service Signed by year:2000: $91,000; 2001: $222,000; 2002: $81,752; 2003: $15,635; 2004: $0; 2005: $0; 2006: $0.
Biggest contracts:
$83,000 with Forest Service (disused code: now 12C2) for Chemical/Biological Studies and Analyses. Taking place in MT. Signed on 2001-05-15. Completion date: 2002-03-15.
$81,000, same as above.Signed on 2000-02-15. Completion date: 2000-08-15.
$60,000, same as above.Signed on 2002-04-15. Completion date: 2002-11-15.
$50,000, same as above.Signed on 2001-01-15. Completion date: 2001-05-15.
CHIEF MANUFACTURING INC (423B WESTFORK DR; small business) : $353,763 in 55 contractsfrom 2005 to 2006
Contracts for Nuts and Washers, Bolts, Screws, Packing and Gasket Materials, and moreby Defense Logistics Agency Signed by year:2000: $0; 2001: $0; 2002: $0; 2003: $0; 2004: $0; 2005: $219,939; 2006: $133,824.
Biggest contracts:
$18,635 with Defense Logistics Agency for Nuts and Washers. Signed on 2006-06-19. Completion date: 2006-11-16.
$16,477 with Defense Logistics Agency for Bolts. Signed on 2005-06-08. Completion date: 2005-11-16.
$15,956 with Defense Logistics Agency for Nuts and Washers. Signed on 2005-11-29. Completion date: 2006-05-28.
$15,617 with Defense Logistics Agency for Screws. Signed on 2005-05-05. Completion date: 2005-06-20.
DEFENSE COMPONENTS (502 B OAKWOOD LN; small business) : $245,105 in 31 contractsfrom 2005 to 2006
Contracts for Coil, Flat, Leaf, and Wire Springs, Hardware, Commercial, Hardware, Weapon System, Screws, and moreby Defense Logistics Agency Signed by year:2000: $0; 2001: $0; 2002: $0; 2003: $0; 2004: $0; 2005: $157,243; 2006: $87,862.
Biggest contracts:
$26,068 with Defense Logistics Agency for Coil, Flat, Leaf, and Wire Springs. Signed on 2005-07-07. Completion date: 2005-09-07.
$24,441 with Defense Logistics Agency for Hardware, Commercial. Signed on 2005-07-07. Completion date: 2005-09-06.
$22,652 with Defense Logistics Agency for Hardware, Weapon System. Signed on 2006-04-28. Completion date: 2006-08-26.
$19,309 with Defense Logistics Agency for Screws. Signed on 2005-04-15. Completion date: 2005-06-15.
INDIAN INDUSTRIES, LP (432 WEST FORK DRIVE; small business) : $167,689 in 13 contractsfrom 2000 to 2006
Contracts for Switches, Nuts and Washers, Refrigeration and Air Conditioning Components, Miscellaneous Electrical and Electronic Components by Defense Logistics Agency Signed by year:2000: $32,340; 2001: $39,532; 2002: $0; 2003: $0; 2004: $31,582; 2005: $60,891; 2006: $3,344.
Biggest contracts:
$39,532 with Defense Logistics Agency for Switches. Signed on 2001-10-11. Completion date: 2002-06-04.
$32,340 with Defense Logistics Agency for Nuts and Washers. Signed on 2000-08-07. Completion date: 2001-01-01.
$22,428 with Defense Logistics Agency for Refrigeration and Air Conditioning Components. Signed on 2004-11-03. Completion date: 2005-01-18.
$12,597 with Defense Logistics Agency for Miscellaneous Electrical and Electronic Components. Signed on 2005-05-03. Completion date: 2005-07-03.
W H HENKEN INDUSTRIES, INC (415 LILLARD ROAD; small business) : $100,655 in 3 contractsfrom 2003 to 2004
$46,382 with Navy for Photographic Supplies. Signed on 2003-11-26. Completion date: 2003-12-06.
$38,040 with Air Force for Maintenance, Repair and Rebuilding of Equipment -- Miscellaneous. Taking place in OK. Signed on 2003-10-08. Completion date: 2003-11-05.
$16,233 with Navy for Photographic Supplies. Taking place in VA. Signed on 2004-03-29. Completion date: 2004-04-08.
Top industries in this zip code by the number of employees in 2005:
Health Care and Social Assistance: General Medical and Surgical Hospitals (over 1000 employees: 1 establishment)
Health Care and Social Assistance: Offices of Physicians (except Mental Health Specialists) (100-249: 1, 50-99: 1, 20-49: 7, 10-19: 14, 5-9: 21, 1-4: 65)
Administrative and Support and Waste Management and Remediation Services: Temporary Help Services (100-249: 2, 50-99: 1, 10-19: 1)
Health Care and Social Assistance: Nursing Care Facilities (100-249: 2, 50-99: 1, 5-9: 1)
Health Care and Social Assistance: Services for the Elderly and Persons with Disabilities (250-499: 1)
Health Care and Social Assistance: Home Health Care Services (100-249: 1, 50-99: 1, 10-19: 2)
Administrative and Support and Waste Management and Remediation Services: Janitorial Services (100-249: 1, 50-99: 1, 5-9: 1, 1-4: 1)
Health Care and Social Assistance: Offices of Dentists (20-49: 1, 10-19: 3, 5-9: 17, 1-4: 10)
Health Care and Social Assistance: Diagnostic Imaging Centers (100-249: 1, 20-49: 1, 5-9: 1, 1-4: 1)
People in group quarters in 2010:
296 people in nursing facilities/skilled-nursing facilities
57 people in college/university student housing
3 people in other noninstitutional facilities
People in group quarters in 2000:
249 people in nursing homes
188 people in college dormitories (includes college quarters off campus)
92 people in other noninstitutional group quarters
43 people in local jails and other confinement facilities (including police lockups)
11 people in homes for the mentally retarded
Fatal accident statistics in 2014:
Fatal accident count: 3
Vehicles involved in fatal accidents: 3
Fatal accidents caused by drunken drivers: 1
Fatalities: 3
Persons involved in fatal accidents: 8
Pedestrians involved in fatal accidents: 1
Fatal accident statistics in 2013:
Fatal accident count: 2
Vehicles involved in fatal accidents: 5
Fatal accidents caused by drunken drivers: 2
Fatalities: 4
Persons involved in fatal accidents: 9
Pedestrians involved in fatal accidents: 0
Home Mortgage Disclosure Act Aggregated Statistics For Year 2009 (Based on 9 full and 6 partial tracts)
A) FHA, FSA/RHS & VA Home Purchase Loans
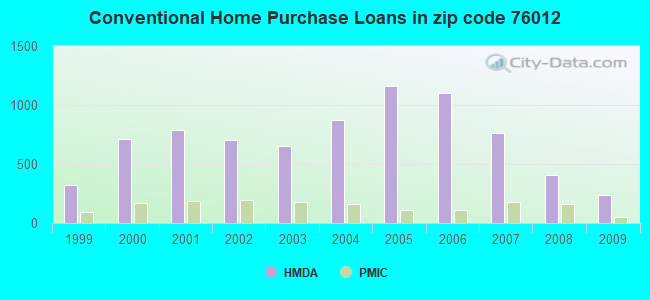
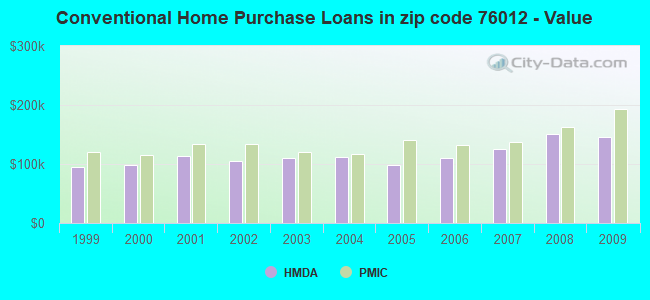
B) Conventional Home Purchase Loans
C) Refinancings
D) Home Improvement Loans
E) Loans on Dwellings For 5+ Families
F) Non-occupant Loans on < 5 Family Dwellings (A B C & D)
G) Loans On Manufactured Home Dwelling (A B C & D)
Number
Average Value
Number
Average Value
Number
Average Value
Number
Average Value
Number
Average Value
Number
Average Value
Number
Average Value
LOANS ORIGINATED
181
$147,750
239
$145,320
588
$144,919
41
$58,834
0
$0
53
$83,162
6
$24,958
APPLICATIONS APPROVED, NOT ACCEPTED
9
$146,450
6
$273,043
69
$160,808
7
$51,774
0
$0
6
$183,402
2
$21,795
APPLICATIONS DENIED
34
$138,582
32
$134,331
162
$135,539
32
$34,925
2
$491,340
18
$84,078
3
$30,813
APPLICATIONS WITHDRAWN
22
$151,285
36
$149,104
153
$135,482
8
$62,324
0
$0
14
$93,895
0
$0
FILES CLOSED FOR INCOMPLETENESS
2
$126,795
5
$154,854
48
$141,659
2
$38,435
1
$877,650
1
$100,000
0
$0
Aggregated Statistics For Year 2008 (Based on 9 full and 6 partial tracts)
A) FHA, FSA/RHS & VA Home Purchase Loans
B) Conventional Home Purchase Loans
C) Refinancings
D) Home Improvement Loans
E) Loans on Dwellings For 5+ Families
F) Non-occupant Loans on < 5 Family Dwellings (A B C & D)
G) Loans On Manufactured Home Dwelling (A B C & D)
Number
Average Value
Number
Average Value
Number
Average Value
Number
Average Value
Number
Average Value
Number
Average Value
Number
Average Value
LOANS ORIGINATED
161
$140,426
403
$151,664
330
$154,869
82
$31,335
2
$2,775,975
115
$100,811
18
$27,731
APPLICATIONS APPROVED, NOT ACCEPTED
6
$224,247
51
$202,645
45
$135,132
18
$28,629
0
$0
16
$87,139
0
$0
APPLICATIONS DENIED
13
$134,387
83
$197,393
219
$132,833
111
$55,710
0
$0
38
$95,627
10
$31,616
APPLICATIONS WITHDRAWN
17
$123,245
62
$152,446
108
$141,947
5
$157,614
0
$0
11
$96,474
0
$0
FILES CLOSED FOR INCOMPLETENESS
5
$143,234
14
$129,221
20
$140,150
6
$32,267
0
$0
6
$106,232
0
$0
Aggregated Statistics For Year 2007 (Based on 9 full and 6 partial tracts)
A) FHA, FSA/RHS & VA Home Purchase Loans
B) Conventional Home Purchase Loans
C) Refinancings
D) Home Improvement Loans
E) Loans on Dwellings For 5+ Families
F) Non-occupant Loans on < 5 Family Dwellings (A B C & D)
G) Loans On Manufactured Home Dwelling (A B C & D)
Number
Average Value
Number
Average Value
Number
Average Value
Number
Average Value
Number
Average Value
Number
Average Value
Number
Average Value
LOANS ORIGINATED
67
$120,731
766
$125,424
362
$126,065
93
$49,913
13
$2,477,718
237
$88,116
4
$13,975
APPLICATIONS APPROVED, NOT ACCEPTED
13
$100,361
122
$96,710
94
$116,399
26
$30,305
0
$0
61
$61,431
0
$0
APPLICATIONS DENIED
26
$108,409
253
$145,479
333
$134,844
115
$42,371
0
$0
106
$94,083
7
$38,066
APPLICATIONS WITHDRAWN
11
$117,838
92
$138,657
168
$134,939
10
$30,920
0
$0
40
$118,987
2
$147,020
FILES CLOSED FOR INCOMPLETENESS
2
$111,810
34
$133,847
54
$133,122
4
$81,775
0
$0
25
$123,798
0
$0
Aggregated Statistics For Year 2006 (Based on 9 full and 6 partial tracts)
A) FHA, FSA/RHS & VA Home Purchase Loans
B) Conventional Home Purchase Loans
C) Refinancings
D) Home Improvement Loans
E) Loans on Dwellings For 5+ Families
F) Non-occupant Loans on < 5 Family Dwellings (A B C & D)
G) Loans On Manufactured Home Dwelling (A B C & D)
Number
Average Value
Number
Average Value
Number
Average Value
Number
Average Value
Number
Average Value
Number
Average Value
Number
Average Value
LOANS ORIGINATED
98
$130,995
1,101
$110,785
385
$129,869
113
$43,632
7
$261,431
299
$87,364
5
$46,716
APPLICATIONS APPROVED, NOT ACCEPTED
5
$109,464
184
$118,501
65
$155,671
43
$54,691
2
$2,970
85
$90,453
4
$24,868
APPLICATIONS DENIED
14
$97,171
238
$130,037
283
$131,930
102
$46,796
2
$1,225,785
84
$105,852
1
$41,820
APPLICATIONS WITHDRAWN
12
$116,298
156
$120,123
183
$130,756
26
$83,106
0
$0
51
$104,605
0
$0
FILES CLOSED FOR INCOMPLETENESS
2
$115,900
35
$128,539
97
$131,457
11
$34,162
0
$0
6
$121,127
0
$0
Aggregated Statistics For Year 2005 (Based on 9 full and 6 partial tracts)
A) FHA, FSA/RHS & VA Home Purchase Loans
B) Conventional Home Purchase Loans
C) Refinancings
D) Home Improvement Loans
E) Loans on Dwellings For 5+ Families
F) Non-occupant Loans on < 5 Family Dwellings (A B C & D)
G) Loans On Manufactured Home Dwelling (A B C & D)
Number
Average Value
Number
Average Value
Number
Average Value
Number
Average Value
Number
Average Value
Number
Average Value
Number
Average Value
LOANS ORIGINATED
93
$129,127
1,164
$98,107
578
$124,374
100
$77,751
13
$803,203
409
$79,032
25
$28,090
APPLICATIONS APPROVED, NOT ACCEPTED
6
$112,910
164
$118,550
103
$118,467
23
$45,597
0
$0
54
$97,291
3
$27,863
APPLICATIONS DENIED
10
$104,136
292
$117,486
395
$131,941
65
$50,261
0
$0
126
$89,412
8
$47,605
APPLICATIONS WITHDRAWN
11
$98,323
216
$97,652
263
$148,649
55
$158,913
0
$0
90
$105,382
4
$29,718
FILES CLOSED FOR INCOMPLETENESS
0
$0
40
$88,708
183
$149,399
6
$30,310
0
$0
29
$111,773
0
$0
Aggregated Statistics For Year 2004 (Based on 9 full and 6 partial tracts)
A) FHA, FSA/RHS & VA Home Purchase Loans
B) Conventional Home Purchase Loans
C) Refinancings
D) Home Improvement Loans
E) Loans on Dwellings For 5+ Families
F) Non-occupant Loans on < 5 Family Dwellings (A B C & D)
G) Loans On Manufactured Home Dwelling (A B C & D)
Number
Average Value
Number
Average Value
Number
Average Value
Number
Average Value
Number
Average Value
Number
Average Value
Number
Average Value
LOANS ORIGINATED
122
$109,968
872
$111,434
887
$111,911
130
$48,127
15
$1,378,797
299
$85,086
2
$23,960
APPLICATIONS APPROVED, NOT ACCEPTED
11
$137,276
119
$141,767
140
$98,558
39
$30,831
0
$0
59
$87,366
8
$40,619
APPLICATIONS DENIED
13
$97,296
237
$94,574
457
$110,318
102
$52,774
0
$0
71
$87,505
26
$42,032
APPLICATIONS WITHDRAWN
13
$114,218
125
$104,354
260
$129,145
23
$106,597
0
$0
38
$93,712
4
$26,520
FILES CLOSED FOR INCOMPLETENESS
1
$212,020
38
$109,755
216
$130,344
5
$89,450
0
$0
10
$71,365
0
$0
Aggregated Statistics For Year 2003 (Based on 9 full and 6 partial tracts)
A) FHA, FSA/RHS & VA Home Purchase Loans
B) Conventional Home Purchase Loans
C) Refinancings
D) Home Improvement Loans
E) Loans on Dwellings For 5+ Families
F) Non-occupant Loans on < 5 Family Dwellings (A B C & D)
Number
Average Value
Number
Average Value
Number
Average Value
Number
Average Value
Number
Average Value
Number
Average Value
LOANS ORIGINATED
123
$118,934
653
$109,704
2,284
$112,814
144
$44,666
2
$917,435
271
$71,518
APPLICATIONS APPROVED, NOT ACCEPTED
6
$86,350
104
$102,872
288
$114,863
22
$34,175
0
$0
17
$93,409
APPLICATIONS DENIED
15
$94,775
170
$91,063
723
$99,125
72
$35,986
0
$0
88
$63,437
APPLICATIONS WITHDRAWN
15
$109,761
118
$125,270
361
$109,579
7
$194,507
0
$0
43
$87,595
FILES CLOSED FOR INCOMPLETENESS
0
$0
29
$91,704
85
$129,278
2
$259,445
0
$0
11
$117,873
Aggregated Statistics For Year 2002 (Based on 9 full and 4 partial tracts)
A) FHA, FSA/RHS & VA Home Purchase Loans
B) Conventional Home Purchase Loans
C) Refinancings
D) Home Improvement Loans
E) Loans on Dwellings For 5+ Families
F) Non-occupant Loans on < 5 Family Dwellings (A B C & D)
Number
Average Value
Number
Average Value
Number
Average Value
Number
Average Value
Number
Average Value
Number
Average Value
LOANS ORIGINATED
157
$118,868
703
$104,251
1,340
$112,454
111
$34,179
10
$607,606
155
$78,682
APPLICATIONS APPROVED, NOT ACCEPTED
9
$105,560
70
$105,783
179
$92,798
31
$40,322
0
$0
20
$87,218
APPLICATIONS DENIED
16
$122,122
138
$69,670
293
$110,128
79
$29,228
0
$0
37
$76,646
APPLICATIONS WITHDRAWN
19
$108,059
79
$100,907
223
$108,006
6
$19,058
0
$0
15
$72,617
FILES CLOSED FOR INCOMPLETENESS
6
$79,252
30
$103,454
82
$96,884
4
$21,995
0
$0
8
$55,495
Aggregated Statistics For Year 2001 (Based on 9 full and 4 partial tracts)
A) FHA, FSA/RHS & VA Home Purchase Loans
B) Conventional Home Purchase Loans
C) Refinancings
D) Home Improvement Loans
E) Loans on Dwellings For 5+ Families
F) Non-occupant Loans on < 5 Family Dwellings (A B C & D)
Number
Average Value
Number
Average Value
Number
Average Value
Number
Average Value
Number
Average Value
Number
Average Value
LOANS ORIGINATED
247
$111,167
791
$113,276
790
$107,951
135
$26,214
3
$3,318,667
94
$75,610
APPLICATIONS APPROVED, NOT ACCEPTED
9
$133,370
134
$95,768
102
$84,129
48
$41,390
0
$0
19
$81,913
APPLICATIONS DENIED
7
$96,624
275
$46,570
223
$85,025
54
$21,939
0
$0
25
$65,079
APPLICATIONS WITHDRAWN
25
$112,291
91
$107,721
131
$105,599
11
$21,340
0
$0
17
$64,006
FILES CLOSED FOR INCOMPLETENESS
4
$97,838
32
$93,301
60
$128,719
9
$57,881
0
$0
2
$34,670
Aggregated Statistics For Year 2000 (Based on 9 full and 4 partial tracts)
A) FHA, FSA/RHS & VA Home Purchase Loans
B) Conventional Home Purchase Loans
C) Refinancings
D) Home Improvement Loans
E) Loans on Dwellings For 5+ Families
F) Non-occupant Loans on < 5 Family Dwellings (A B C & D)
Number
Average Value
Number
Average Value
Number
Average Value
Number
Average Value
Number
Average Value
Number
Average Value
LOANS ORIGINATED
217
$102,124
715
$98,777
173
$78,443
132
$32,823
0
$0
91
$91,496
APPLICATIONS APPROVED, NOT ACCEPTED
21
$77,012
69
$84,216
32
$69,168
47
$25,694
2
$129,720
7
$96,107
APPLICATIONS DENIED
24
$77,410
258
$48,082
90
$72,686
71
$31,290
0
$0
34
$52,921
APPLICATIONS WITHDRAWN
29
$86,510
52
$95,849
42
$88,714
10
$10,990
0
$0
5
$50,148
FILES CLOSED FOR INCOMPLETENESS
6
$107,225
32
$96,911
30
$91,084
4
$46,400
0
$0
6
$57,892
Aggregated Statistics For Year 1999 (Based on 4 full and 4 partial tracts)
A) FHA, FSA/RHS & VA Home Purchase Loans
B) Conventional Home Purchase Loans
C) Refinancings
D) Home Improvement Loans
E) Loans on Dwellings For 5+ Families
F) Non-occupant Loans on < 5 Family Dwellings (A B C & D)
2003 - 2018 National Fire Incident Reporting System (NFIRS) incidents
According to the data from the years 2003 - 2018 the average number of fire incidents per year is 63. The highest number of reported fires - 101 took place in 2008, and the least - 3 in 2004. The data has a growing trend.
When looking into fire subcategories, the most incidents belonged to: Outside Fires (45.3%), and Structure Fires (34.5%).
Fire incident types reported to NFIRS in Zip Code 76012


 Nearest zip codes: 76013, 76120, 76006, 76011, 76015, 76010.


 According to the data from the years 2003 - 2018 the average number of fire incidents per year is 63. The highest number of reported fires - 101 took place in 2008, and the least - 3 in 2004. The data has a growing trend.
 When looking into fire subcategories, the most incidents belonged to: Outside Fires (45.3%), and Structure Fires (34.5%).