Estimated zip code population in 2022: 6,506 Zip code population in 2010: 6,005 Zip code population in 2000: 5,604
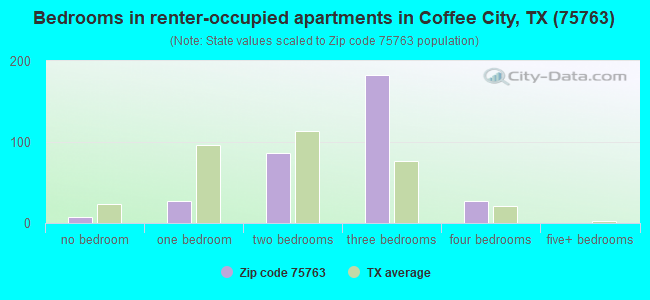
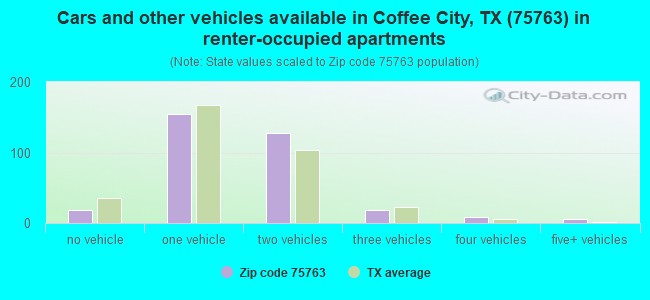
Houses and condos: 3,068 Renter-occupied apartments: 337
% of renters here:
13%
State:
38%
March 2022 cost of living index in zip code 75763: 79.9 (low, U.S. average is 100)
Land area: 107.8 sq. mi. Water area: 7.3 sq. mi.
Population density: 60 people per square mile
(very low).
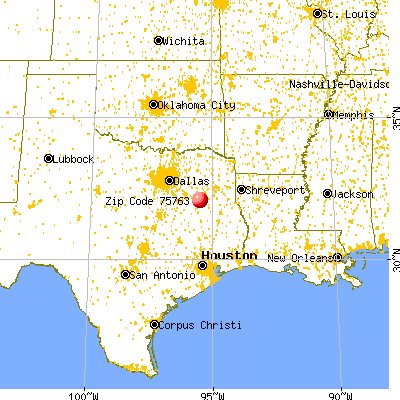
OSM Map
General Map
Google Map
MSN Map
OSM Map
General Map
Google Map
MSN Map
OSM Map
General Map
Google Map
MSN Map
OSM Map
General Map
Google Map
MSN Map
Please wait while loading the map...
Real estate property taxes paid for housing units in 2022:
This zip code:
0.9% ($1,521)
Texas:
1.5% ($4,050)
Median real estate property taxes paid for housing units with mortgages in 2022: $1,976 (1.0%) Median real estate property taxes paid for housing units with no mortgage in 2022: $1,137 (0.8%)
Business Search- 14 Million verified businesses
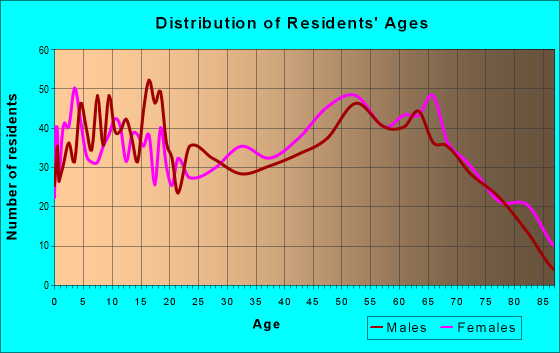
Males: 3,057
(47.0%)
Females: 3,448
(53.0%)
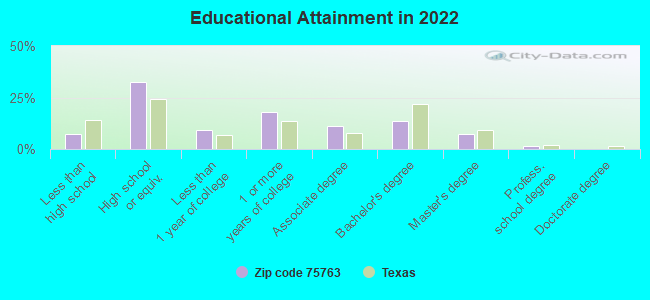
For population 25 years and over in 75763:
High school or higher: 91.8%
Bachelor's degree or higher: 21.7%
Graduate or professional degree: 8.5%
Unemployed: 4.9%
Mean travel time to work (commute): 26.3 minutes
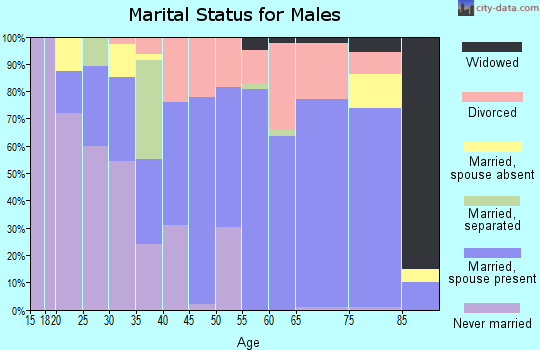
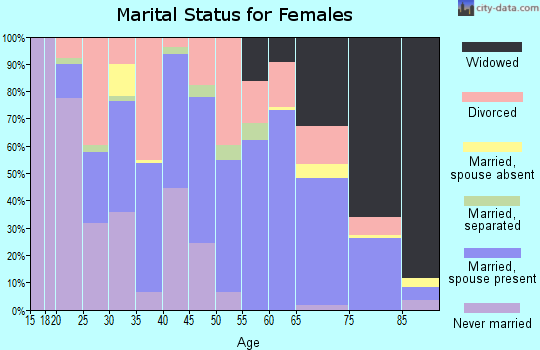
For population 15 years and over in 75763:
Never married: 20.1%
Now married: 60.0%
Separated: 2.0%
Widowed: 7.8%
Divorced: 10.1%
Zip code 75763 compared to state average:
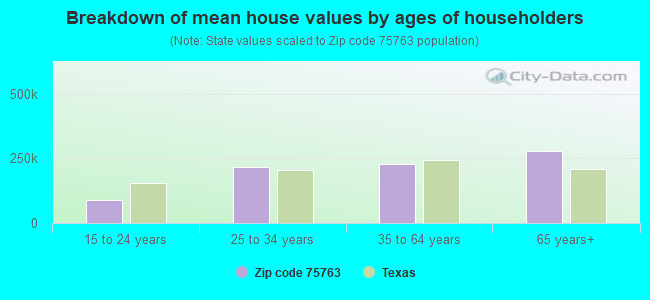
Median house value below state average.
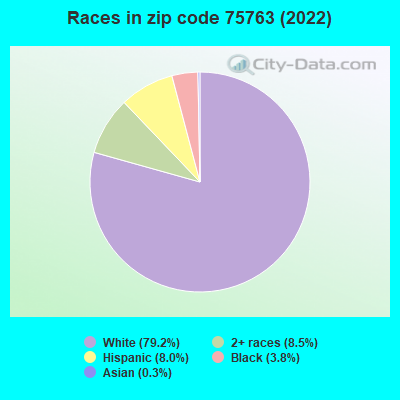
Black race population percentage significantly below state average.
Hispanic race population percentage significantly below state average.
Median age significantly above state average.
Foreign-born population percentage significantly below state average.
Renting percentage significantly below state average.
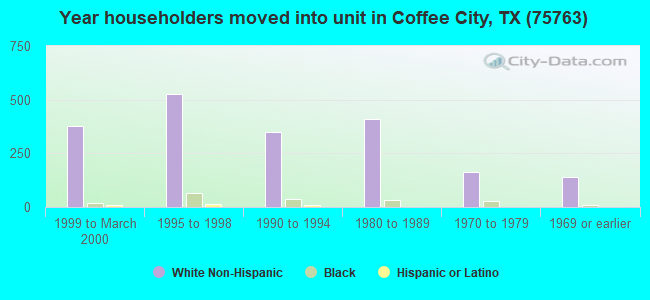
Length of stay since moving in significantly above state average.
Averages for the 2020 tax year for zip code 75763, filed in 2021:
Average Adjusted Gross Income (AGI) in 2020: $62,459 (Individual Income Tax Returns)
Here:
$62,459
State:
$77,054
Salary/wage: $52,454 (reported on 76.3% of returns)
Here:
$52,454
State:
$62,766
(% of AGI for various income ranges: 1085.7% for AGIs below $25k, 3306.4% for AGIs $25k-50k, 5717.4% for AGIs $50k-75k, 9427.3% for AGIs $75k-100k, 16090.0% for AGIs $100k-200k, 68230.0% for AGIs over 200k)
Taxable interest for individuals: $2,252 (reported on 27.1% of returns)
This zip code:
$2,252
Texas:
$2,665
(% of AGI for various income ranges: 25.7% for AGIs below $25k, 19.3% for AGIs $25k-50k, 28.9% for AGIs $50k-75k, 108.0% for AGIs $75k-100k, 377.8% for AGIs $100k-200k, 1320.0% for AGIs over 200k)
Ordinary dividends: $8,462 (reported on 15.3% of returns)
Here:
$8,462
State:
$10,044
(% of AGI for various income ranges: 29.4% for AGIs below $25k, 31.8% for AGIs $25k-50k, 83.7% for AGIs $50k-75k, 263.3% for AGIs $75k-100k, 434.4% for AGIs $100k-200k, 5346.7% for AGIs over 200k)
Net capital gain/loss in AGI: +$20,090 (reported on 15.3% of returns)
Here:
+$20,090
State:
+$39,590
(% of AGI for various income ranges: 6.3% for AGIs below $25k, 37.7% for AGIs $25k-50k, 142.2% for AGIs $50k-75k, 437.3% for AGIs $75k-100k, 1142.2% for AGIs $100k-200k, 15620.0% for AGIs over 200k)
Profit/loss from business: +$9,241 (reported on 19.5% of returns)
Here:
+$9,241
State:
+$10,888
(% of AGI for various income ranges: 192.9% for AGIs below $25k, 98.2% for AGIs $25k-50k, 183.7% for AGIs $50k-75k, 280.7% for AGIs $75k-100k, 1074.4% for AGIs $100k-200k)
Taxable individual retirement arrangement distribution: $23,879 (reported on 10.7% of returns)
75763:
$23,879
Texas:
$24,740
(% of AGI for various income ranges: 88.5% for AGIs below $25k, 116.3% for AGIs $25k-50k, 310.0% for AGIs $50k-75k, 446.0% for AGIs $75k-100k, 1354.4% for AGIs $100k-200k, 4963.3% for AGIs over 200k)
Total itemized deductions: $33,738 (reported on 5.0% of returns)
Here:
$33,738
State:
$40,428
(% of AGI for various income ranges: 119.6% for AGIs $25k-50k, 359.6% for AGIs $50k-75k, 841.1% for AGIs $100k-200k, 4103.3% for AGIs over 200k)
Charity contributions: $15,230 (reported on 3.8% of returns)
Here:
$15,230
State:
$18,201
(% of AGI for various income ranges: 102.2% for AGIs $50k-75k, 326.1% for AGIs $100k-200k, 2200.0% for AGIs over 200k)
Taxes paid: $6,077 (reported on 5.0% of returns)
75763:
$6,077
State:
$7,821
(% of AGI for various income ranges: 19.1% for AGIs $25k-50k, 62.2% for AGIs $50k-75k, 153.3% for AGIs $100k-200k, 796.7% for AGIs over 200k)
Earned income credit: $2,594 (reported on 19.8% of returns)
Here:
$2,594
State:
$2,584
(% of AGI for various income ranges: 135.4% for AGIs below $25k, 76.4% for AGIs $25k-50k)
Percentage of individuals using paid preparers for their 2020 taxes: 94.3%
Here:
94%
State:
92%
(% for various income ranges: 93.4% for AGIs below $25k, 92.9% for AGIs $25k-50k, 97.2% for AGIs $50k-75k, 95.8% for AGIs $75k-100k, 93.9% for AGIs $100k-200k, 100.0% for AGIs over 200k)
Averages for the 2012 tax year for zip code 75763, filed in 2013:
Average Adjusted Gross Income (AGI) in 2012: $51,225 (Individual Income Tax Returns)
Here:
$51,225
State:
$65,384
Salary/wage: $43,678 (reported on 79.0% of returns)
Here:
$43,678
State:
$52,524
(% of AGI for various income ranges: 72.4% for AGIs below $25k, 74.6% for AGIs $25k-50k, 69.4% for AGIs $50k-75k, 74.3% for AGIs $75k-100k, 73.1% for AGIs $100k-200k, 43.0% for AGIs over 200k)
Taxable interest for individuals: $1,865 (reported on 29.0% of returns)
This zip code:
$1,865
Texas:
$2,372
(% of AGI for various income ranges: 1.3% for AGIs below $25k, 1.0% for AGIs $25k-50k, 0.9% for AGIs $50k-75k, 0.5% for AGIs $75k-100k, 1.0% for AGIs $100k-200k, 1.6% for AGIs over 200k)
Ordinary dividends: $6,879 (reported on 14.3% of returns)
Here:
$6,879
State:
$9,721
(% of AGI for various income ranges: 1.5% for AGIs below $25k, 1.2% for AGIs $25k-50k, 1.9% for AGIs $50k-75k, 0.9% for AGIs $75k-100k, 1.5% for AGIs $100k-200k, 4.1% for AGIs over 200k)
Net capital gain/loss in AGI: +$3,945 (reported on 12.2% of returns)
Here:
+$3,945
State:
+$35,319
(% of AGI for various income ranges: 0.1% for AGIs $25k-50k, 0.8% for AGIs $50k-75k, 1.0% for AGIs $75k-100k, 2.0% for AGIs $100k-200k, 1.1% for AGIs over 200k)
Profit/loss from business: +$13,970 (reported on 19.7% of returns)
Here:
+$13,970
State:
+$13,732
(% of AGI for various income ranges: 11.2% for AGIs below $25k, 4.5% for AGIs $25k-50k, 3.2% for AGIs $50k-75k, 2.3% for AGIs $75k-100k, 10.9% for AGIs $100k-200k)
Taxable individual retirement arrangement distribution: $14,996 (reported on 11.3% of returns)
75763:
$14,996
Texas:
$19,511
(% of AGI for various income ranges: 3.0% for AGIs below $25k, 3.8% for AGIs $25k-50k, 4.4% for AGIs $50k-75k, 3.9% for AGIs $75k-100k, 4.6% for AGIs $100k-200k)
Total itemized deductions: $20,455 (19% of AGI, reported on 21.4% of returns)
Here:
$20,455
State:
$24,724
Here:
18.9% of AGI
State:
15.9% of AGI
(% of AGI for various income ranges: 6.8% for AGIs below $25k, 7.3% for AGIs $25k-50k, 10.1% for AGIs $50k-75k, 8.2% for AGIs $75k-100k, 10.6% for AGIs $100k-200k, 6.8% for AGIs over 200k)
Charity contributions: $4,916 (reported on 16.0% of returns)
Here:
$4,916
State:
$6,808
(% of AGI for various income ranges: 0.5% for AGIs below $25k, 1.0% for AGIs $25k-50k, 1.5% for AGIs $50k-75k, 1.4% for AGIs $75k-100k, 2.1% for AGIs $100k-200k, 2.0% for AGIs over 200k)
Taxes paid: $4,832 (reported on 21.0% of returns)
75763:
$4,832
State:
$6,921
(% of AGI for various income ranges: 1.1% for AGIs below $25k, 1.4% for AGIs $25k-50k, 2.4% for AGIs $50k-75k, 2.0% for AGIs $75k-100k, 2.5% for AGIs $100k-200k, 1.9% for AGIs over 200k)
Earned income credit: $2,469 (reported on 24.8% of returns)
Here:
$2,469
State:
$2,570
(% of AGI for various income ranges: 8.8% for AGIs below $25k, 1.6% for AGIs $25k-50k)
Percentage of individuals using paid preparers for their 2012 taxes: 60.5%
Here:
61%
State:
51%
(% for various income ranges: 57.3% for AGIs below $25k, 60.4% for AGIs $25k-50k, 58.8% for AGIs $50k-75k, 66.7% for AGIs $75k-100k, 72.7% for AGIs $100k-200k, 60.0% for AGIs over 200k)
Averages for the 2004 tax year for zip code 75763, filed in 2005:
Average Adjusted Gross Income (AGI) in 2004: $34,801 (Individual Income Tax Returns)
Here:
$34,801
State:
$47,881
Salary/wage: $31,127 (reported on 78.7% of returns)
Here:
$31,127
State:
$41,947
(% of AGI for various income ranges: 159.6% for AGIs below $10k, 73.9% for AGIs $10k-25k, 75.2% for AGIs $25k-50k, 74.9% for AGIs $50k-75k, 67.2% for AGIs $75k-100k, 53.2% for AGIs over 100k)
Taxable interest for individuals: $2,226 (reported on 37.1% of returns)
This zip code:
$2,226
Texas:
$2,255
(% of AGI for various income ranges: 9.7% for AGIs below $10k, 3.4% for AGIs $10k-25k, 1.7% for AGIs $25k-50k, 1.2% for AGIs $50k-75k, 1.2% for AGIs $75k-100k, 4.0% for AGIs over 100k)
Taxable dividends: $3,313 (reported on 16.3% of returns)
Here:
$3,313
State:
$4,261
(% of AGI for various income ranges: 3.8% for AGIs below $10k, 0.8% for AGIs $10k-25k, 1.0% for AGIs $25k-50k, 1.0% for AGIs $50k-75k, 0.3% for AGIs $75k-100k, 3.9% for AGIs over 100k)
Net capital gain/loss: +$6,289 (reported on 15.4% of returns)
Here:
+$6,289
State:
+$16,110
(% of AGI for various income ranges: 2.6% for AGIs below $10k, 0.2% for AGIs $10k-25k, 0.3% for AGIs $25k-50k, 0.7% for AGIs $50k-75k, 2.5% for AGIs $75k-100k, 9.6% for AGIs over 100k)
Profit/loss from business: +$11,838 (reported on 19.5% of returns)
Here:
+$11,838
State:
+$11,013
(% of AGI for various income ranges: 37.1% for AGIs below $10k, 7.6% for AGIs $10k-25k, 4.4% for AGIs $25k-50k, 3.4% for AGIs $50k-75k, 5.3% for AGIs $75k-100k, 10.6% for AGIs over 100k)
IRA payment deduction: $3,537 (reported on 2.9% of returns)
75763:
$3,537
Texas:
$3,120
(% of AGI for various income ranges: 0.2% for AGIs $10k-25k, 0.4% for AGIs $25k-50k, 0.5% for AGIs $50k-75k, 0.2% for AGIs over 100k)
Self-employed pension: $16,417 (reported on 0.5% of returns)
Here:
$16,417
Texas:
$16,401
Total itemized deductions: $17,522 (25% of AGI, reported on 17.7% of returns)
Here:
$17,522
State:
$19,631
Here:
24.7% of AGI
State:
18.9% of AGI
(% of AGI for various income ranges: 7.4% for AGIs below $10k, 6.0% for AGIs $10k-25k, 8.3% for AGIs $25k-50k, 9.0% for AGIs $50k-75k, 10.3% for AGIs $75k-100k, 10.6% for AGIs over 100k)
Charity contributions deductions: $4,632 (6% of AGI, reported on 14.3% of returns)
Here:
$4,632
State:
$4,753
Here:
6.2% of AGI
State:
4.2% of AGI
(% of AGI for various income ranges: 1.0% for AGIs $10k-25k, 1.5% for AGIs $25k-50k, 1.2% for AGIs $50k-75k, 2.4% for AGIs $75k-100k, 3.5% for AGIs over 100k)
Total tax: $4,918 (reported on 68.9% of returns)
75763:
$4,918
State:
$9,058
(% of AGI for various income ranges: 6.2% for AGIs below $10k, 3.8% for AGIs $10k-25k, 6.2% for AGIs $25k-50k, 8.7% for AGIs $50k-75k, 11.4% for AGIs $75k-100k, 17.7% for AGIs over 100k)
Earned income credit: $1,940 (reported on 24.4% of returns)
Here:
$1,940
State:
$2,024
Percentage of individuals using paid preparers for their 2004 taxes: 66.5%
Here:
67%
State:
57%
(% for various income ranges: 61.7% for AGIs below $10k, 66.7% for AGIs $10k-25k, 68.1% for AGIs $25k-50k, 67.6% for AGIs $50k-75k, 67.4% for AGIs $75k-100k, 77.3% for AGIs over 100k)
Household received Food Stamps/SNAP in the past 12 months: 304 Household did not receive Food Stamps/SNAP in the past 12 months: 2,234
Women who had a birth in the past 12 months: 54 (48 now married, 6 unmarried) Women who did not have a birth in the past 12 months: 1,083 (570 now married, 509 unmarried)
Housing units in zip code 75763 with a mortgage: 811 (23 second mortgage, 25 both second mortgage and home equity loan) Houses without a mortgage: 25
Median monthly owner costs for units with a mortgage: $1,467 Median monthly owner costs for units without a mortgage: $476
Residents with income below the poverty level in 2022:
This zip code:
12.9%
Whole state:
14.0%
Residents with income below 50% of the poverty level in 2022:
This zip code:
8.4%
Whole state:
7.4%
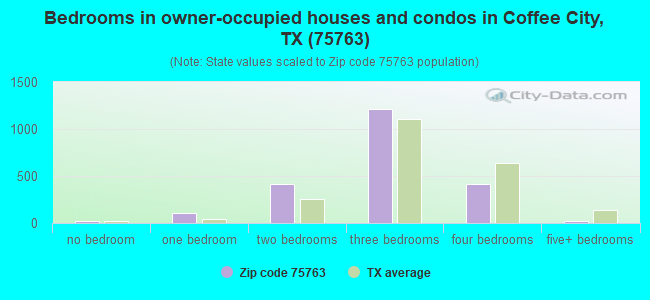
Median number of rooms in houses and condos:
Here:
5.7
State:
6.3
Median number of rooms in apartments:
Here:
4.6
State:
4.0
Notable locations in this zip code not listed on our city pages
Notable locations in zip code 75763: Frankston Depot Museum (A), Frankston Depot Library (B), Frankston Volunteer Fire Department (C), Berryville Volunteer Fire Department (D), Coffee City Fire Department (E), Kathleen C Fitzgerald Museum (F). Display/hide their locations on the map
Churches in zip code 75763 include: Olive Branch Church (A), Hardshell Church (B), Pert Church (C), First Baptist Church of Frankston (D), Bethel Church (E), Mount Pleasant Church (F), Gentry Temple Church of God and Christ (G), Pine Springs Baptist Church (H), Hilltop Baptist Church (I). Display/hide their locations on the map
Cemeteries: Hardshell Cemetery (1), Owens Cemetery (2), Wofford Cemetery (3), Dabbs Cemetery (4), Liberty Hill Cemetery (5). Display/hide their locations on the map
Lakes and reservoirs: Honey Lake (A), Alligator Lake (B), Hurts Lake (C), Lake Palestine (D), Lake Frankston (E), Pineywoods Lake (F). Display/hide their locations on the map
Streams, rivers, and creeks: Ledbetter Creek (A), Norwegian Creek (B), Highsaw Creek (C), Cobb Creek (D), Caney Branch (E), Dunn Creek (F), Little Brushy Creek (G). Display/hide their locations on the map
In group quarters: 37 (-1 institutionalized population)
Size of family households: 1,079 2-persons, 354 3-persons, 115 4-persons, 254 5-persons, 66 6-persons, 7 7-or-more-persons
Size of nonfamily households: 561 1-person, 104 2-persons
882 married couples with children.
361 single-parent households (68 men, 293 women).
94.6% of residents of 75763 zip code speak English at home.
5.5% of residents speak Spanish at home (64% very well, 21% well, 15% not well).
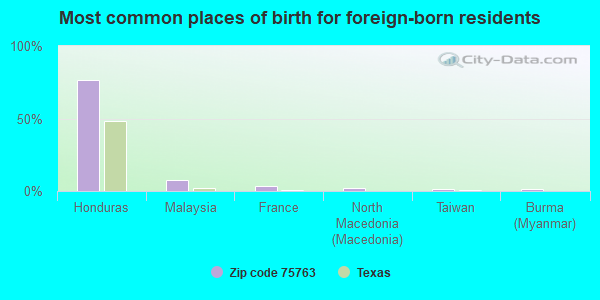
Foreign born population: 186 (2.9%) (5.3% of them are naturalized citizens)
This zip code:
2.9%
Whole state:
17.2%
77%Honduras
8%Malaysia
4%France
2%North Macedonia (Macedonia)
1%Taiwan
1%Burma (Myanmar)
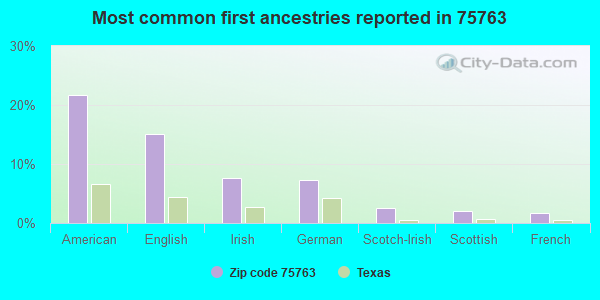
22%American
15%English
8%Irish
7%German
3%Scotch-Irish
2%Scottish
2%French
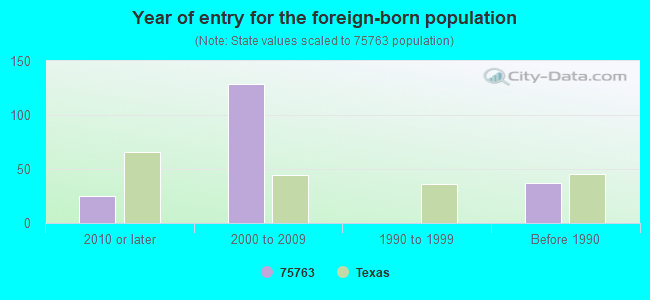
Year of entry for the foreign-born population
252010 or later
1292000 to 2009
01990 to 1999
37Before 1990
Facilities with environmental interests located in this zip code:
BACON CHEVROLET (N HWY 155 in FRANKSTON, TX)
(Resource Conservation and Recovery Act (tracking hazardous waste))
Housing units lacking complete plumbing facilities: 3.1% Housing units lacking complete kitchen facilities: 5.9%
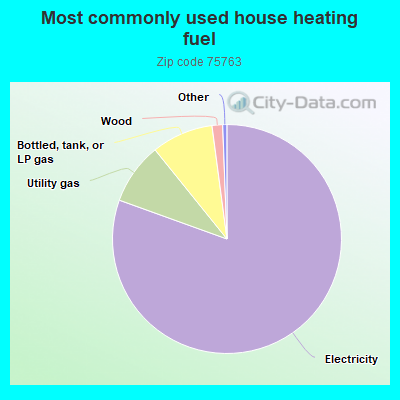
80.6%Electricity
8.7%Utility gas
8.7%Bottled, tank, or LP gas
1.5%Wood
Population in 1990: 5,394. Population change in the 1990s: +210 (+3.9%).
Place of birth for U.S.-born residents:
This state: 4,817
Northeast: 139
Midwest: 442
South: 484
West: 392
56% of the 75763 zip code residents lived in the same house 5 years ago. Out of people who lived in different houses, 27% lived in this county. Out of people who lived in different counties, 50% lived in Texas.
92% of the 75763 zip code residents lived in the same house 1 year ago. Out of people who lived in different houses, 15% moved from this county. Out of people who lived in different houses, 74% moved from different county within same state. Out of people who lived in different houses, 9% moved from different state. Out of people who lived in different houses, 7% moved from abroad.
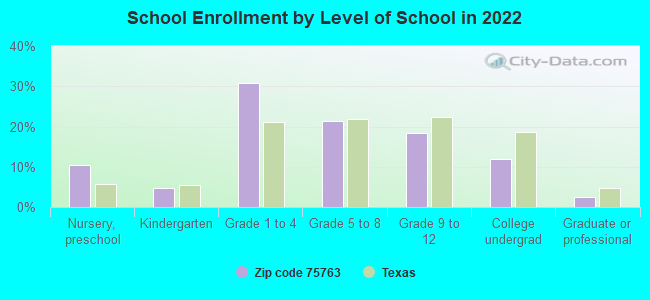
Private vs. public school enrollment:
Students in private schools in grades 1 to 8 (elementary and middle school): 40
Here:
6.9%
Texas:
8.8%
Students in private schools in grades 9 to 12 (high school): 20
Here:
9.7%
Texas:
8.0%
Students in private undergraduate colleges: 40
Here:
29.6%
Texas:
16.2%
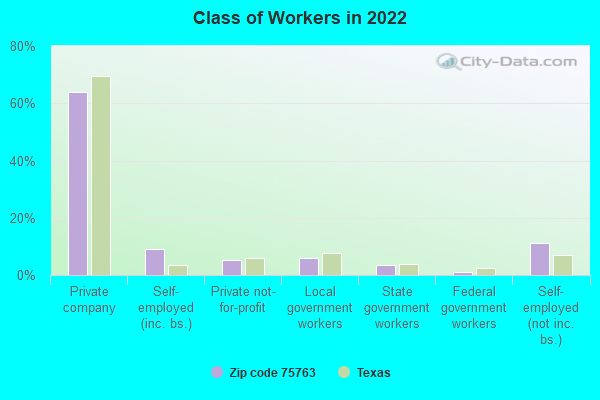
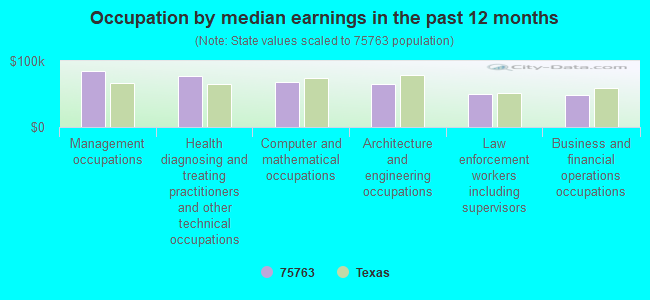
Occupation by median earnings in the past 12 months ($)
85,073Management occupations
77,590Health diagnosing and treating practitioners and other technical occupations
67,995Computer and mathematical occupations
65,755Architecture and engineering occupations
49,539Law enforcement workers including supervisors
48,116Business and financial operations occupations
Top industries in this zip code by the number of employees in 2005:
Health Care and Social Assistance: Nursing Care Facilities (50-99 employees: 1 establishment)
Accommodation and Food Services: Full-Service Restaurants (20-49: 1, 10-19: 1)
Other Services (except Public Administration): Religious Organizations (10-19: 1, 5-9: 3, 1-4: 1)
Finance and Insurance: Commercial Banking (20-49: 1)
Arts, Entertainment, and Recreation: Golf Courses and Country Clubs (20-49: 1)
Accommodation and Food Services: Limited-Service Restaurants (10-19: 1, 5-9: 1)
People in group quarters in 2010:
49 people in nursing facilities/skilled-nursing facilities
People in group quarters in 2000:
59 people in nursing homes
Fatal accident statistics in 2014:
Fatal accident count: 3
Vehicles involved in fatal accidents: 7
Fatal accidents caused by drunken drivers: 0
Fatalities: 4
Persons involved in fatal accidents: 8
Pedestrians involved in fatal accidents: 0
Fatal accident statistics in 2013:
Fatal accident count: 1
Vehicles involved in fatal accidents: 1
Fatal accidents caused by drunken drivers: 1
Fatalities: 1
Persons involved in fatal accidents: 1
Pedestrians involved in fatal accidents: 0
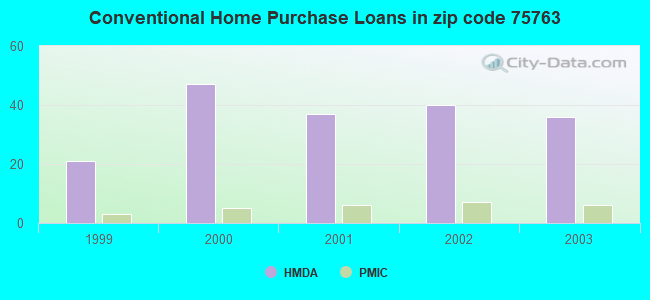
Home Mortgage Disclosure Act Aggregated Statistics For Year 2003 (Based on 2 partial tracts)
A) FHA, FSA/RHS & VA Home Purchase Loans
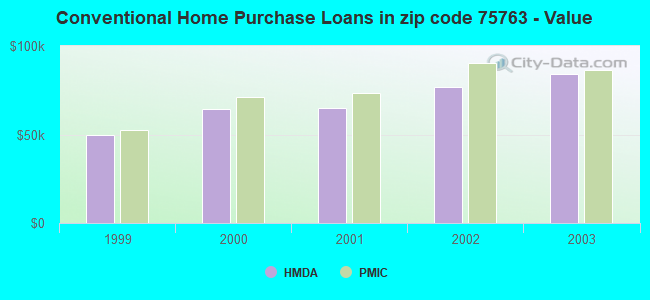
B) Conventional Home Purchase Loans
C) Refinancings
D) Home Improvement Loans
F) Non-occupant Loans on < 5 Family Dwellings (A B C & D)
Number
Average Value
Number
Average Value
Number
Average Value
Number
Average Value
Number
Average Value
LOANS ORIGINATED
4
$87,390
36
$84,162
44
$91,749
5
$41,666
13
$71,768
APPLICATIONS APPROVED, NOT ACCEPTED
1
$26,040
3
$45,907
9
$75,954
1
$10,020
1
$64,600
APPLICATIONS DENIED
2
$55,340
24
$46,887
42
$72,914
7
$23,466
5
$39,162
APPLICATIONS WITHDRAWN
1
$71,610
5
$82,832
21
$83,228
1
$54,090
3
$44,737
FILES CLOSED FOR INCOMPLETENESS
0
$0
1
$397,130
2
$103,165
0
$0
0
$0
Aggregated Statistics For Year 2002 (Based on 2 partial tracts)
A) FHA, FSA/RHS & VA Home Purchase Loans
B) Conventional Home Purchase Loans
C) Refinancings
D) Home Improvement Loans
F) Non-occupant Loans on < 5 Family Dwellings (A B C & D)
Number
Average Value
Number
Average Value
Number
Average Value
Number
Average Value
Number
Average Value
LOANS ORIGINATED
7
$65,176
40
$76,936
31
$85,168
9
$27,266
13
$88,449
APPLICATIONS APPROVED, NOT ACCEPTED
2
$46,575
9
$51,193
6
$78,960
1
$6,010
1
$11,020
APPLICATIONS DENIED
1
$33,050
28
$49,579
29
$54,915
9
$8,402
4
$65,980
APPLICATIONS WITHDRAWN
0
$0
3
$59,260
16
$95,528
1
$52,080
1
$12,020
FILES CLOSED FOR INCOMPLETENESS
0
$0
1
$65,100
2
$102,415
0
$0
1
$40,060
Aggregated Statistics For Year 2001 (Based on 2 partial tracts)
A) FHA, FSA/RHS & VA Home Purchase Loans
B) Conventional Home Purchase Loans
C) Refinancings
D) Home Improvement Loans
F) Non-occupant Loans on < 5 Family Dwellings (A B C & D)
Number
Average Value
Number
Average Value
Number
Average Value
Number
Average Value
Number
Average Value
LOANS ORIGINATED
5
$58,494
37
$65,185
30
$71,865
6
$30,715
8
$73,116
APPLICATIONS APPROVED, NOT ACCEPTED
0
$0
22
$45,254
6
$43,987
1
$7,510
2
$39,565
APPLICATIONS DENIED
0
$0
41
$45,780
16
$48,953
3
$20,867
5
$39,964
APPLICATIONS WITHDRAWN
1
$61,600
5
$50,982
13
$79,358
1
$7,510
0
$0
FILES CLOSED FOR INCOMPLETENESS
0
$0
1
$15,020
3
$75,120
0
$0
0
$0
Aggregated Statistics For Year 2000 (Based on 2 partial tracts)
A) FHA, FSA/RHS & VA Home Purchase Loans
B) Conventional Home Purchase Loans
C) Refinancings
D) Home Improvement Loans
F) Non-occupant Loans on < 5 Family Dwellings (A B C & D)
Number
Average Value
Number
Average Value
Number
Average Value
Number
Average Value
Number
Average Value
LOANS ORIGINATED
3
$48,077
47
$64,390
9
$59,428
10
$14,874
11
$46,028
APPLICATIONS APPROVED, NOT ACCEPTED
0
$0
14
$53,264
3
$35,890
3
$19,197
1
$55,090
APPLICATIONS DENIED
2
$27,795
48
$41,525
16
$55,432
10
$11,118
3
$33,220
APPLICATIONS WITHDRAWN
0
$0
5
$76,522
3
$62,600
1
$29,550
0
$0
FILES CLOSED FOR INCOMPLETENESS
0
$0
1
$20,030
1
$44,070
0
$0
0
$0
Aggregated Statistics For Year 1999 (Based on 1 partial tract)
A) FHA, FSA/RHS & VA Home Purchase Loans
B) Conventional Home Purchase Loans
C) Refinancings
D) Home Improvement Loans
F) Non-occupant Loans on < 5 Family Dwellings (A B C & D)
Detailed PMIC statistics for the following Tracts:9514.00
2002 - 2018 National Fire Incident Reporting System (NFIRS) incidents
According to the data from the years 2002 - 2018 the average number of fire incidents per year is 83. The highest number of fire incidents - 165 took place in 2011, and the least - 23 in 2002. The data has a growing trend.
When looking into fire subcategories, the most reports belonged to: Outside Fires (55.2%), and Structure Fires (33.1%).
Fire incident types reported to NFIRS in Zip Code 75763


 Nearest zip codes: 75759, 75770, 75779, 75757, 75762, 75803.
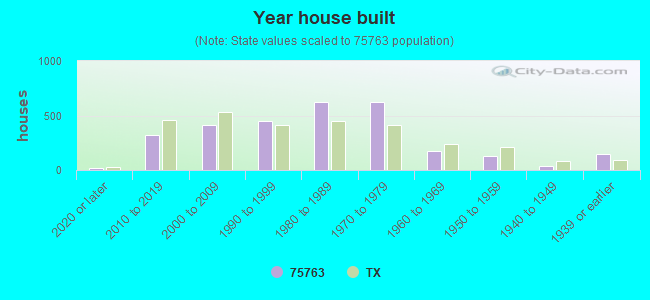


 According to the data from the years 2002 - 2018 the average number of fire incidents per year is 83. The highest number of fire incidents - 165 took place in 2011, and the least - 23 in 2002. The data has a growing trend.
 When looking into fire subcategories, the most reports belonged to: Outside Fires (55.2%), and Structure Fires (33.1%).