Estimated zip code population in 2022: 2,561 Zip code population in 2010: 2,876 Zip code population in 2000: 2,893
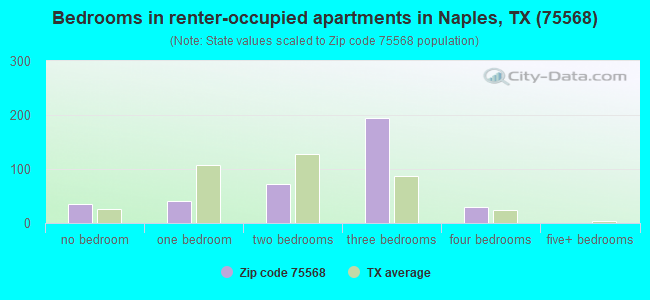
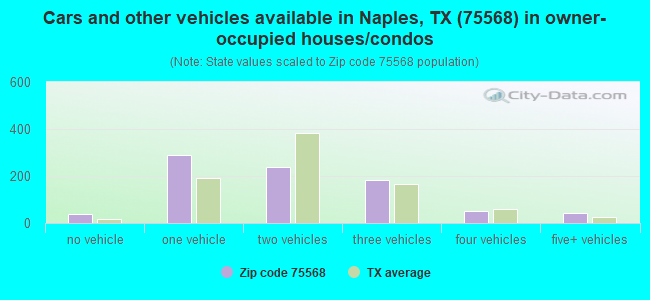
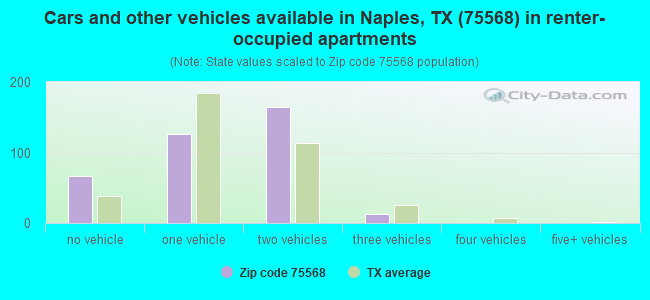
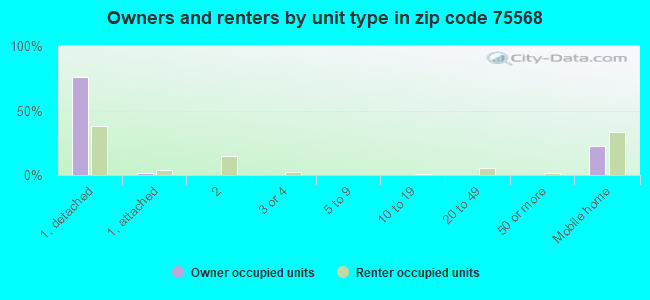
Houses and condos: 1,507 Renter-occupied apartments: 372
% of renters here:
31%
State:
38%
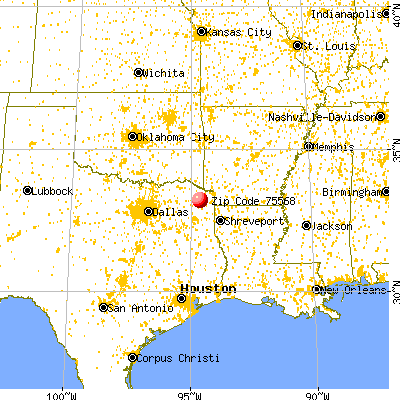
March 2022 cost of living index in zip code 75568: 78.7 (low, U.S. average is 100)
Land area: 134.1 sq. mi. Water area: 1.2 sq. mi.
Population density: 19 people per square mile
(very low).
OSM Map
General Map
Google Map
MSN Map
OSM Map
General Map
Google Map
MSN Map
OSM Map
General Map
Google Map
MSN Map
OSM Map
General Map
Google Map
MSN Map
Please wait while loading the map...
Real estate property taxes paid for housing units in 2022:
This zip code:
1.0% ($1,299)
Texas:
1.5% ($4,050)
Median real estate property taxes paid for housing units with mortgages in 2022: $1,954 (1.5%) Median real estate property taxes paid for housing units with no mortgage in 2022: $1,267 (0.9%)
Averages for the 2020 tax year for zip code 75568, filed in 2021:
Average Adjusted Gross Income (AGI) in 2020: $49,607 (Individual Income Tax Returns)
Here:
$49,607
State:
$77,054
Salary/wage: $42,916 (reported on 79.5% of returns)
Here:
$42,916
State:
$62,766
(% of AGI for various income ranges: 1274.7% for AGIs below $25k, 3631.1% for AGIs $25k-50k, 6585.0% for AGIs $50k-75k, 9858.8% for AGIs $75k-100k, 16717.1% for AGIs $100k-200k)
Taxable interest for individuals: $1,243 (reported on 23.0% of returns)
This zip code:
$1,243
Texas:
$2,665
(% of AGI for various income ranges: 18.5% for AGIs below $25k, 50.4% for AGIs $25k-50k, 49.2% for AGIs $50k-75k, 48.8% for AGIs $75k-100k, 72.9% for AGIs $100k-200k)
Ordinary dividends: $2,160 (reported on 8.2% of returns)
Here:
$2,160
State:
$10,044
(% of AGI for various income ranges: 29.3% for AGIs $25k-50k, 65.8% for AGIs $50k-75k, 82.9% for AGIs $100k-200k)
Net capital gain/loss in AGI: +$9,391 (reported on 9.0% of returns)
Here:
+$9,391
State:
+$39,590
(% of AGI for various income ranges: 1.5% for AGIs below $25k, 13.0% for AGIs $25k-50k, 150.8% for AGIs $50k-75k, 1160.0% for AGIs $100k-200k)
Profit/loss from business: +$9,884 (reported on 15.6% of returns)
Here:
+$9,884
State:
+$10,888
(% of AGI for various income ranges: 171.5% for AGIs below $25k, 223.7% for AGIs $25k-50k, 219.2% for AGIs $50k-75k, 202.5% for AGIs $75k-100k, 380.0% for AGIs $100k-200k)
Taxable individual retirement arrangement distribution: $12,438 (reported on 6.6% of returns)
75568:
$12,438
Texas:
$24,740
(% of AGI for various income ranges: 189.3% for AGIs $25k-50k, 605.0% for AGIs $75k-100k)
Total itemized deductions: $36,500 (reported on 2.5% of returns)
Here:
$36,500
State:
$40,428
(% of AGI for various income ranges: 1368.8% for AGIs $75k-100k)
Charity contributions: $12,700 (reported on 1.6% of returns)
Here:
$12,700
State:
$18,201
(% of AGI for various income ranges: 94.1% for AGIs $25k-50k)
Taxes paid: $3,900 (reported on 2.5% of returns)
75568:
$3,900
State:
$7,821
(% of AGI for various income ranges: 97.5% for AGIs $50k-75k)
Earned income credit: $2,603 (reported on 25.4% of returns)
Here:
$2,603
State:
$2,584
(% of AGI for various income ranges: 163.5% for AGIs below $25k, 93.0% for AGIs $25k-50k)
Percentage of individuals using paid preparers for their 2020 taxes: 87.7%
Here:
88%
State:
92%
(% for various income ranges: 85.1% for AGIs below $25k, 91.4% for AGIs $25k-50k, 83.3% for AGIs $50k-75k, 90.9% for AGIs $75k-100k, 90.9% for AGIs $100k-200k)
Averages for the 2012 tax year for zip code 75568, filed in 2013:
Average Adjusted Gross Income (AGI) in 2012: $38,183 (Individual Income Tax Returns)
Here:
$38,183
State:
$65,384
Salary/wage: $37,425 (reported on 77.1% of returns)
Here:
$37,425
State:
$52,524
(% of AGI for various income ranges: 68.4% for AGIs below $25k, 78.1% for AGIs $25k-50k, 80.6% for AGIs $50k-75k, 83.0% for AGIs $75k-100k, 69.1% for AGIs $100k-200k)
Taxable interest for individuals: $1,631 (reported on 27.1% of returns)
This zip code:
$1,631
Texas:
$2,372
(% of AGI for various income ranges: 2.1% for AGIs below $25k, 1.7% for AGIs $25k-50k, 1.0% for AGIs $50k-75k, 0.3% for AGIs $75k-100k, 0.6% for AGIs $100k-200k)
Ordinary dividends: $2,520 (reported on 8.5% of returns)
Here:
$2,520
State:
$9,721
(% of AGI for various income ranges: 0.5% for AGIs below $25k, 0.5% for AGIs $25k-50k, 1.4% for AGIs $50k-75k, 0.4% for AGIs $75k-100k)
Net capital gain/loss in AGI: +$3,111 (reported on 7.6% of returns)
Here:
+$3,111
State:
+$35,319
(% of AGI for various income ranges: 0.4% for AGIs below $25k, 1.1% for AGIs $25k-50k, 1.9% for AGIs $75k-100k)
Profit/loss from business: +$6,900 (reported on 18.6% of returns)
Here:
+$6,900
State:
+$13,732
(% of AGI for various income ranges: 11.2% for AGIs below $25k, 2.3% for AGIs $25k-50k, 0.8% for AGIs $50k-75k, 5.6% for AGIs $75k-100k)
Taxable individual retirement arrangement distribution: $10,044 (reported on 7.6% of returns)
75568:
$10,044
Texas:
$19,511
(% of AGI for various income ranges: 4.2% for AGIs below $25k, 3.6% for AGIs $25k-50k, 2.3% for AGIs $50k-75k)
Total itemized deductions: $19,287 (27% of AGI, reported on 12.7% of returns)
Here:
$19,287
State:
$24,724
Here:
27.5% of AGI
State:
15.9% of AGI
(% of AGI for various income ranges: 5.4% for AGIs below $25k, 6.9% for AGIs $25k-50k, 6.1% for AGIs $50k-75k, 7.1% for AGIs $75k-100k, 6.6% for AGIs $100k-200k)
Charity contributions: $4,767 (reported on 10.2% of returns)
Here:
$4,767
State:
$6,808
(% of AGI for various income ranges: 0.8% for AGIs below $25k, 1.1% for AGIs $25k-50k, 2.0% for AGIs $50k-75k, 1.9% for AGIs $100k-200k)
Taxes paid: $3,293 (reported on 12.7% of returns)
75568:
$3,293
State:
$6,921
(% of AGI for various income ranges: 0.8% for AGIs below $25k, 1.0% for AGIs $25k-50k, 1.0% for AGIs $50k-75k, 1.3% for AGIs $75k-100k, 1.4% for AGIs $100k-200k)
Earned income credit: $2,488 (reported on 28.8% of returns)
Here:
$2,488
State:
$2,570
(% of AGI for various income ranges: 9.2% for AGIs below $25k, 1.6% for AGIs $25k-50k)
Percentage of individuals using paid preparers for their 2012 taxes: 61.0%
Here:
61%
State:
51%
(% for various income ranges: 59.6% for AGIs below $25k, 58.1% for AGIs $25k-50k, 66.7% for AGIs $50k-75k, 62.5% for AGIs $75k-100k, 71.4% for AGIs $100k-200k)
Averages for the 2004 tax year for zip code 75568, filed in 2005:
Average Adjusted Gross Income (AGI) in 2004: $29,470 (Individual Income Tax Returns)
Here:
$29,470
State:
$47,881
Salary/wage: $29,252 (reported on 77.9% of returns)
Here:
$29,252
State:
$41,947
(% of AGI for various income ranges: 207.3% for AGIs below $10k, 70.7% for AGIs $10k-25k, 77.9% for AGIs $25k-50k, 82.1% for AGIs $50k-75k, 82.3% for AGIs $75k-100k, 55.5% for AGIs over 100k)
Taxable interest for individuals: $1,861 (reported on 36.1% of returns)
This zip code:
$1,861
Texas:
$2,255
(% of AGI for various income ranges: 11.5% for AGIs below $10k, 2.9% for AGIs $10k-25k, 2.0% for AGIs $25k-50k, 1.5% for AGIs $50k-75k, 1.9% for AGIs $75k-100k, 2.3% for AGIs over 100k)
Taxable dividends: $1,859 (reported on 10.7% of returns)
Here:
$1,859
State:
$4,261
(% of AGI for various income ranges: 0.4% for AGIs below $10k, 0.3% for AGIs $10k-25k, 0.8% for AGIs $25k-50k, 0.4% for AGIs $50k-75k, 0.1% for AGIs $75k-100k, 1.7% for AGIs over 100k)
Net capital gain/loss: +$6,476 (reported on 10.5% of returns)
Here:
+$6,476
State:
+$16,110
(% of AGI for various income ranges: 1.4% for AGIs below $10k, 2.2% for AGIs $10k-25k, 1.7% for AGIs $25k-50k, 0.3% for AGIs $50k-75k, 8.3% for AGIs over 100k)
Profit/loss from business: +$5,606 (reported on 15.7% of returns)
Here:
+$5,606
State:
+$11,013
(% of AGI for various income ranges: 32.1% for AGIs below $10k, 7.1% for AGIs $10k-25k, 1.8% for AGIs $25k-50k, 1.7% for AGIs $50k-75k, 0.6% for AGIs over 100k)
IRA payment deduction: $3,231 (reported on 1.1% of returns)
75568:
$3,231
Texas:
$3,120
Total itemized deductions: $15,287 (25% of AGI, reported on 10.7% of returns)
Here:
$15,287
State:
$19,631
Here:
24.5% of AGI
State:
18.9% of AGI
(% of AGI for various income ranges: 3.6% for AGIs $10k-25k, 5.4% for AGIs $25k-50k, 5.1% for AGIs $50k-75k, 7.2% for AGIs $75k-100k, 8.6% for AGIs over 100k)
Charity contributions deductions: $4,119 (6% of AGI, reported on 8.4% of returns)
Here:
$4,119
State:
$4,753
Here:
6.0% of AGI
State:
4.2% of AGI
(% of AGI for various income ranges: 5.4% for AGIs below $10k, 0.9% for AGIs $25k-50k, 1.2% for AGIs $50k-75k, 1.4% for AGIs $75k-100k, 2.2% for AGIs over 100k)
Total tax: $3,955 (reported on 65.2% of returns)
75568:
$3,955
State:
$9,058
(% of AGI for various income ranges: 5.8% for AGIs below $10k, 3.6% for AGIs $10k-25k, 6.2% for AGIs $25k-50k, 8.8% for AGIs $50k-75k, 11.8% for AGIs $75k-100k, 17.5% for AGIs over 100k)
Earned income credit: $2,015 (reported on 27.2% of returns)
Here:
$2,015
State:
$2,024
Percentage of individuals using paid preparers for their 2004 taxes: 64.0%
Here:
64%
State:
57%
(% for various income ranges: 60.1% for AGIs below $10k, 63.2% for AGIs $10k-25k, 64.9% for AGIs $25k-50k, 67.6% for AGIs $50k-75k, 72.7% for AGIs $75k-100k, 73.7% for AGIs over 100k)
Household received Food Stamps/SNAP in the past 12 months: 306 Household did not receive Food Stamps/SNAP in the past 12 months: 910
Women who had a birth in the past 12 months: 31 (31 now married, 0 unmarried) Women who did not have a birth in the past 12 months: 510 (332 now married, 175 unmarried)
Housing units in zip code 75568 with a mortgage: 219 (28 second mortgage, 30 both second mortgage and home equity loan) Median monthly owner costs for units with a mortgage: $956 Median monthly owner costs for units without a mortgage: $453
Residents with income below the poverty level in 2022:
This zip code:
10.2%
Whole state:
14.0%
Residents with income below 50% of the poverty level in 2022:
This zip code:
6.2%
Whole state:
7.4%
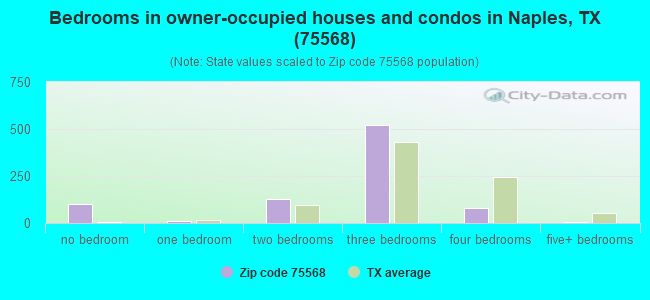
Median number of rooms in houses and condos:
Here:
5.6
State:
6.3
Median number of rooms in apartments:
Here:
4.7
State:
4.0
Notable locations in this zip code not listed on our city pages
Churches in zip code 75568 include: Rocky Point Church (A), Unionville Church (B), Wilkerson Temple (C), Williams Chapel (D), Bethlehem Church (E), Daniels Chapel (F), Gethsemane Church (G), Mount Olive Church (H), Pine Bluff Church (I). Display/hide their locations on the map
Cemeteries: Morning Star Cemetery (1), Bell Cemetery (2), New Hope Cemetery (3), Creekmore Cemetery (4), Spring Hill Cemetery (5), Wheatville Cemetery (6), Pleasant Hill Cemetery (7). Display/hide their locations on the map
Lakes and reservoirs: Jennings Lake (A), Reddon Lake (B), Thomas Lake (C), Twin Lakes (D), Jerry Pratt Lake (E), Justiss Farms Lake (F), Coker Lake (G). Display/hide their locations on the map
Streams, rivers, and creeks: Watson Creek (A), Tuck Branch (B), Sweet Creek (C), White Oak Creek (D), Elliot Creek (E), Thomas Creek (F), Floyd Creek (G), Crow Creek (H), Caney Creek (I). Display/hide their locations on the map
In group quarters: 40 (-1 institutionalized population)
Size of family households: 191 2-persons, 242 3-persons, 174 4-persons, 20 5-persons, 12 6-persons, 7 7-or-more-persons
Size of nonfamily households: 522 1-person, 44 2-persons
410 married couples with children.
9 single-parent households (9 women).
83.8% of residents of 75568 zip code speak English at home.
15.0% of residents speak Spanish at home (57% very well, 41% well, 2% not well).
0.1% of residents speak other Indo-European language at home (100% well).
1.2% of residents speak Asian or Pacific Island language at home (50% very well, 50% well).
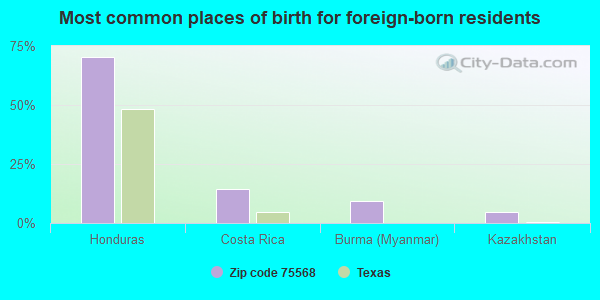
Foreign born population: 259 (10.1%) (11.9% of them are naturalized citizens)
This zip code:
10.1%
Whole state:
17.2%
71%Honduras
15%Costa Rica
9%Burma (Myanmar)
4%Kazakhstan
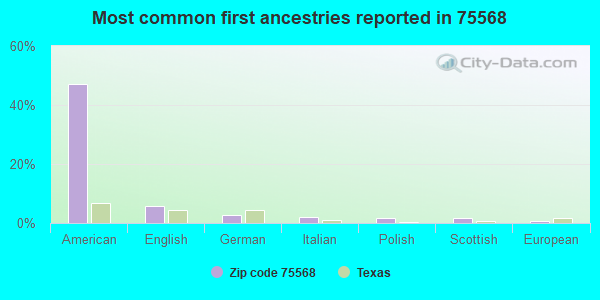
47%American
6%English
3%German
2%Italian
2%Polish
2%Scottish
1%European
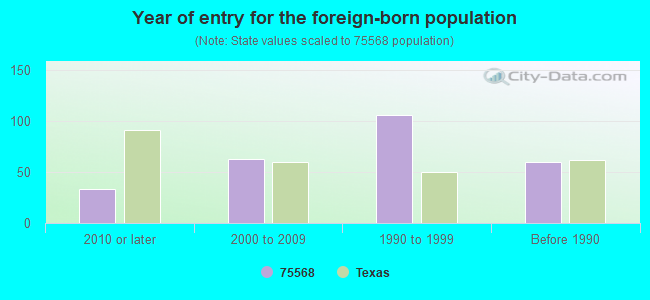
Year of entry for the foreign-born population
332010 or later
632000 to 2009
1061990 to 1999
60Before 1990
Housing units lacking complete plumbing facilities: 14.9% Housing units lacking complete kitchen facilities: 12.7%
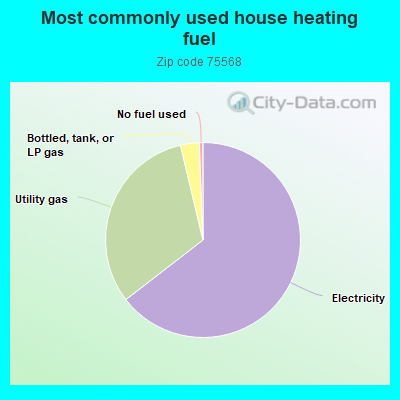
64.4%Electricity
31.7%Utility gas
3.1%Bottled, tank, or LP gas
0.6%No fuel used
Population in 1990: 2,752. Population change in the 1990s: +141 (+5.1%).
Place of birth for U.S.-born residents:
This state: 1,910
Northeast: 28
Midwest: 116
South: 167
West: 42
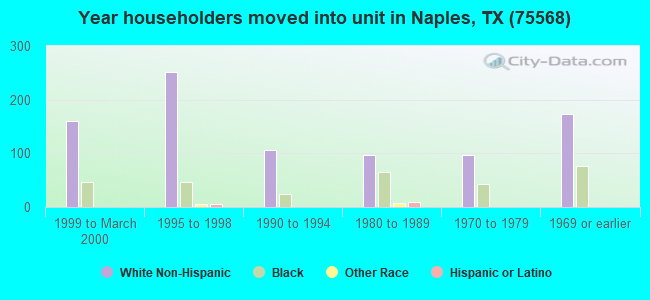
65% of the 75568 zip code residents lived in the same house 5 years ago. Out of people who lived in different houses, 33% lived in this county. Out of people who lived in different counties, 50% lived in Texas.
88% of the 75568 zip code residents lived in the same house 1 year ago. Out of people who lived in different houses, 10% moved from this county. Out of people who lived in different houses, 88% moved from different county within same state. Out of people who lived in different houses, 4% moved from different state.
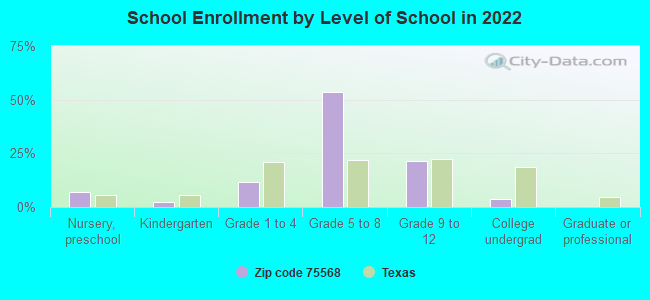
Private vs. public school enrollment:
Students in private schools in grades 1 to 8 (elementary and middle school):
Here:
0.0%
Texas:
8.8%
Students in private schools in grades 9 to 12 (high school):
Here:
0.0%
Texas:
8.0%
Students in private undergraduate colleges:
Here:
0.0%
Texas:
16.2%
Occupation by median earnings in the past 12 months ($)
112,362Transportation occupations
93,285Computer and mathematical occupations
77,600Sales and related occupations
36,520Management occupations
32,546Production occupations
32,377Material moving occupations
Companies with federal contracts located in this zip code:
JEREMY ABSTON (25767 TEXAS HIGHWAY 77 W in NAPLES, TX; small business) : $45,652 in 6 contractsfrom 2005 to 2006
Contracts for Other Natural Resources and Conservation Services, Maintenance, Repair or Alteration of Real Property -- Other Non-Building Facilities, Forest Tree Planting Services, Other Wildlife Management Services by Army Signed by year:2000: $0; 2001: $0; 2002: $0; 2003: $0; 2004: $0; 2005: $44,164; 2006: $1,488.
Biggest contracts:
$25,347 with Army for Other Natural Resources and Conservation Services. Signed on 2005-12-07. Completion date: 2006-03-31.
$12,885 with Army for Maintenance, Repair or Alteration of Real Property -- Other Non-Building Facilities. Signed on 2006-05-03. Completion date: 2006-08-15.
$11,822 with Army for Forest Tree Planting Services. Signed on 2005-12-07. Completion date: 2006-02-28.
$6,995 with Army for Other Wildlife Management Services. Signed on 2005-05-16. Completion date: 2005-09-01.
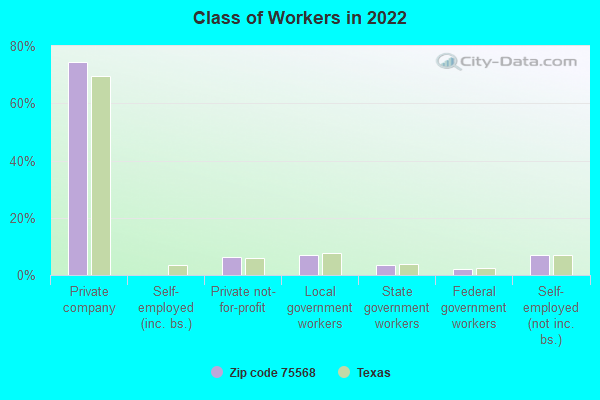
Top industries in this zip code by the number of employees in 2005:
Finance and Insurance: Commercial Banking (20-49 employees: 1 establishment)
Other Services (except Public Administration): Religious Organizations (5-9: 2, 1-4: 3)
Health Care and Social Assistance: Offices of Physicians (except Mental Health Specialists) (10-19: 1)
Fatal accident statistics in 2013:
Fatal accident count: 1
Vehicles involved in fatal accidents: 1
Fatal accidents caused by drunken drivers: 1
Fatalities: 2
Persons involved in fatal accidents: 4
Pedestrians involved in fatal accidents: 0
Fatal accident statistics in 2012:
Fatal accident count: 1
Vehicles involved in fatal accidents: 1
Fatal accidents caused by drunken drivers: 0
Fatalities: 1
Persons involved in fatal accidents: 2
Pedestrians involved in fatal accidents: 0
2002 - 2018 National Fire Incident Reporting System (NFIRS) incidents
Based on the data from the years 2002 - 2018 the average number of fire incidents per year is 22. The highest number of fire incidents - 47 took place in 2005, and the least - 2 in 2010. The data has a decreasing trend.
When looking into fire subcategories, the most incidents belonged to: Outside Fires (52.9%), and Structure Fires (30.8%).
Fire incident types reported to NFIRS in Zip Code 75568


 Nearest zip codes: 75566, 75574, 75656, 75571, 75638, 75560.


 : $45,652 in 6 contracts from 2005 to 2006

 Based on the data from the years 2002 - 2018 the average number of fire incidents per year is 22. The highest number of fire incidents - 47 took place in 2005, and the least - 2 in 2010. The data has a decreasing trend.
 When looking into fire subcategories, the most incidents belonged to: Outside Fires (52.9%), and Structure Fires (30.8%).