Estimated zip code population in 2022: 2,172 Zip code population in 2010: 2,254 Zip code population in 2000: 2,030
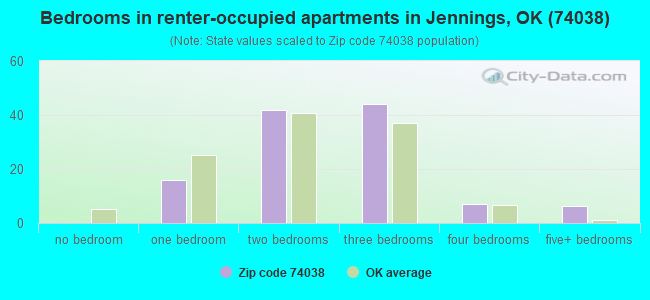
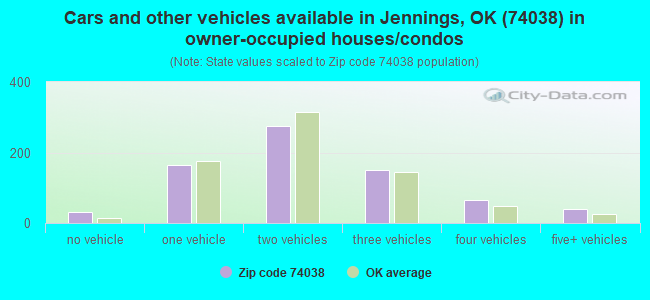
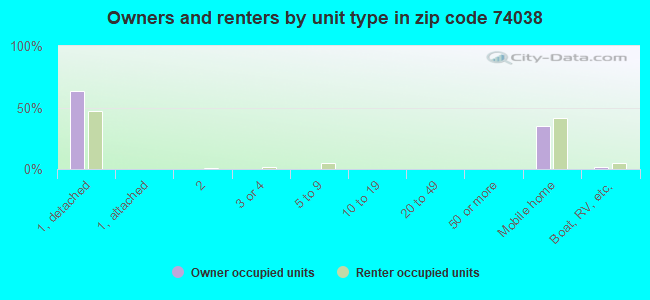
Houses and condos: 976 Renter-occupied apartments: 116
% of renters here:
14%
State:
35%
March 2022 cost of living index in zip code 74038: 79.6 (low, U.S. average is 100)
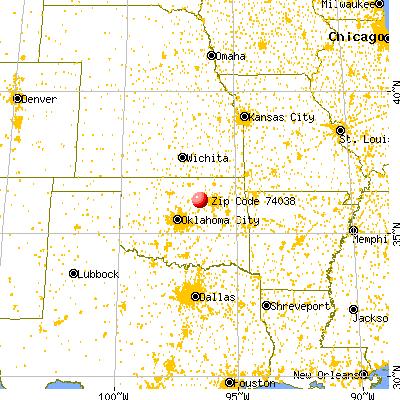
Land area: 96.9 sq. mi. Water area: 0.6 sq. mi.
Population density: 22 people per square mile
(very low).
OSM Map
General Map
Google Map
MSN Map
OSM Map
General Map
Google Map
MSN Map
OSM Map
General Map
Google Map
MSN Map
OSM Map
General Map
Google Map
MSN Map
Please wait while loading the map...
Real estate property taxes paid for housing units in 2022:
This zip code:
0.6% ($1,029)
Oklahoma:
0.8% ($1,501)
Median real estate property taxes paid for housing units with mortgages in 2022: $1,267 (0.7%) Median real estate property taxes paid for housing units with no mortgage in 2022: $825 (0.6%)
Business Search- 14 Million verified businesses
Males: 1,204
(55.4%)
Females: 968
(44.6%)
For population 25 years and over in 74038:
High school or higher: 84.9%
Bachelor's degree or higher: 14.2%
Graduate or professional degree: 4.5%
Unemployed: 2.2%
Mean travel time to work (commute): 36.2 minutes
For population 15 years and over in 74038:
Never married: 21.8%
Now married: 57.6%
Separated: 2.4%
Widowed: 7.0%
Divorced: 11.2%
Zip code 74038 compared to state average:
Unemployed percentage below state average.
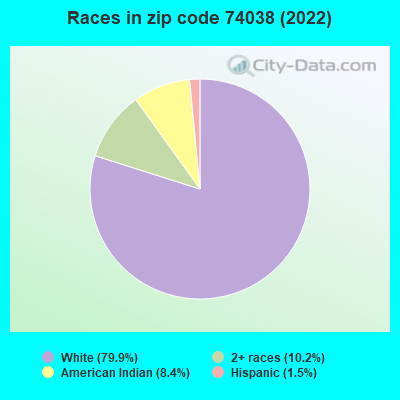
Black race population percentage significantly below state average.
Hispanic race population percentage significantly below state average.
Median age above state average.
Foreign-born population percentage significantly below state average.
Renting percentage significantly below state average.
Length of stay since moving in significantly above state average.
Number of college students below state average.
Percentage of population with a bachelor's degree or higher below state average.
Averages for the 2020 tax year for zip code 74038, filed in 2021:
Average Adjusted Gross Income (AGI) in 2020: $47,176 (Individual Income Tax Returns)
Here:
$47,176
State:
$63,060
Salary/wage: $44,518 (reported on 82.9% of returns)
Here:
$44,518
State:
$52,427
(% of AGI for various income ranges: 1177.3% for AGIs below $25k, 3473.8% for AGIs $25k-50k, 5960.0% for AGIs $50k-75k, 10013.3% for AGIs $75k-100k, 16838.0% for AGIs $100k-200k)
Taxable interest for individuals: $375 (reported on 19.5% of returns)
This zip code:
$375
Oklahoma:
$1,603
(% of AGI for various income ranges: 4.5% for AGIs below $25k, 8.6% for AGIs $25k-50k, 28.0% for AGIs $50k-75k, 8.0% for AGIs $100k-200k)
Ordinary dividends: $1,983 (reported on 7.3% of returns)
Here:
$1,983
State:
$7,001
(% of AGI for various income ranges: 42.9% for AGIs $25k-50k, 48.3% for AGIs $75k-100k)
Net capital gain/loss in AGI: +$980 (reported on 6.1% of returns)
Here:
+$980
State:
+$19,855
(% of AGI for various income ranges: 0.5% for AGIs $25k-50k, 80.0% for AGIs $75k-100k)
Profit/loss from business: +$12,592 (reported on 14.6% of returns)
Here:
+$12,592
State:
+$9,904
(% of AGI for various income ranges: 120.9% for AGIs below $25k, 225.7% for AGIs $25k-50k, 371.0% for AGIs $50k-75k, 666.7% for AGIs $75k-100k)
Taxable individual retirement arrangement distribution: $12,525 (reported on 4.9% of returns)
74038:
$12,525
Oklahoma:
$20,476
(% of AGI for various income ranges: 238.6% for AGIs $25k-50k)
Total itemized deductions: $43,550 (reported on 2.4% of returns)
Here:
$43,550
State:
$39,736
(% of AGI for various income ranges: 871.0% for AGIs $50k-75k)
Taxes paid: $8,850 (reported on 2.4% of returns)
74038:
$8,850
State:
$7,046
(% of AGI for various income ranges: 177.0% for AGIs $50k-75k)
Earned income credit: $2,132 (reported on 23.2% of returns)
Here:
$2,132
State:
$2,435
(% of AGI for various income ranges: 84.5% for AGIs below $25k, 104.3% for AGIs $25k-50k)
Percentage of individuals using paid preparers for their 2020 taxes: 93.9%
Here:
94%
State:
94%
(% for various income ranges: 92.9% for AGIs below $25k, 96.0% for AGIs $25k-50k, 92.3% for AGIs $50k-75k, 100.0% for AGIs $75k-100k, 87.5% for AGIs $100k-200k)
Averages for the 2012 tax year for zip code 74038, filed in 2013:
Average Adjusted Gross Income (AGI) in 2012: $47,655 (Individual Income Tax Returns)
Here:
$47,655
State:
$58,581
Salary/wage: $40,411 (reported on 86.8% of returns)
Here:
$40,411
State:
$45,973
(% of AGI for various income ranges: 75.0% for AGIs below $25k, 80.8% for AGIs $25k-50k, 87.9% for AGIs $50k-75k, 86.4% for AGIs $75k-100k, 53.0% for AGIs $100k-200k)
Taxable interest for individuals: $489 (reported on 23.7% of returns)
This zip code:
$489
Oklahoma:
$1,625
(% of AGI for various income ranges: 0.6% for AGIs below $25k, 0.3% for AGIs $25k-50k, 0.2% for AGIs $50k-75k, 0.3% for AGIs $75k-100k)
Ordinary dividends: $1,543 (reported on 9.2% of returns)
Here:
$1,543
State:
$6,374
Net capital gain/loss in AGI: +$2,120 (reported on 6.6% of returns)
Here:
+$2,120
State:
+$24,023
Profit/loss from business: +$7,527 (reported on 14.5% of returns)
Here:
+$7,527
State:
+$11,913
(% of AGI for various income ranges: 7.4% for AGIs below $25k, 3.1% for AGIs $25k-50k, 5.8% for AGIs $75k-100k)
Taxable individual retirement arrangement distribution: $7,050 (reported on 7.9% of returns)
74038:
$7,050
Oklahoma:
$15,242
Total itemized deductions: $24,800 (25% of AGI, reported on 21.1% of returns)
Here:
$24,800
State:
$24,882
Here:
24.7% of AGI
State:
18.8% of AGI
(% of AGI for various income ranges: 10.9% for AGIs $25k-50k, 8.8% for AGIs $50k-75k, 12.6% for AGIs $75k-100k, 14.9% for AGIs $100k-200k)
Charity contributions: $4,892 (reported on 15.8% of returns)
Here:
$4,892
State:
$6,591
(% of AGI for various income ranges: 2.6% for AGIs below $25k, 1.1% for AGIs $50k-75k, 2.4% for AGIs $75k-100k, 2.4% for AGIs $100k-200k)
Taxes paid: $5,081 (reported on 21.1% of returns)
74038:
$5,081
State:
$7,196
(% of AGI for various income ranges: 1.0% for AGIs $25k-50k, 1.4% for AGIs $50k-75k, 2.8% for AGIs $75k-100k, 4.0% for AGIs $100k-200k)
Earned income credit: $2,406 (reported on 23.7% of returns)
Here:
$2,406
State:
$2,354
(% of AGI for various income ranges: 8.5% for AGIs below $25k, 1.7% for AGIs $25k-50k)
Percentage of individuals using paid preparers for their 2012 taxes: 65.8%
Here:
66%
State:
56%
(% for various income ranges: 62.1% for AGIs below $25k, 66.7% for AGIs $25k-50k, 75.0% for AGIs $50k-75k, 57.1% for AGIs $75k-100k, 71.4% for AGIs $100k-200k)
Averages for the 2004 tax year for zip code 74038, filed in 2005:
Average Adjusted Gross Income (AGI) in 2004: $29,031 (Individual Income Tax Returns)
Here:
$29,031
State:
$41,245
Salary/wage: $30,101 (reported on 82.0% of returns)
Here:
$30,101
State:
$35,318
(% of AGI for various income ranges: 128.7% for AGIs below $10k, 80.6% for AGIs $10k-25k, 86.6% for AGIs $25k-50k, 88.2% for AGIs $50k-75k, 82.1% for AGIs $75k-100k, 68.7% for AGIs over 100k)
Taxable interest for individuals: $1,083 (reported on 31.2% of returns)
This zip code:
$1,083
Oklahoma:
$1,745
(% of AGI for various income ranges: 5.9% for AGIs below $10k, 2.4% for AGIs $10k-25k, 1.4% for AGIs $25k-50k, 0.3% for AGIs $50k-75k, 0.2% for AGIs $75k-100k, 0.3% for AGIs over 100k)
Taxable dividends: $737 (reported on 7.4% of returns)
Here:
$737
State:
$2,920
Net capital gain/loss: +$721 (reported on 8.8% of returns)
Here:
+$721
State:
+$10,653
(% of AGI for various income ranges: 0.6% for AGIs below $10k, -0.0% for AGIs $10k-25k, 0.6% for AGIs $25k-50k, -0.0% for AGIs $50k-75k)
Profit/loss from business: +$3,875 (reported on 19.7% of returns)
Here:
+$3,875
State:
+$8,532
(% of AGI for various income ranges: 4.9% for AGIs below $10k, 4.4% for AGIs $10k-25k, 2.0% for AGIs $25k-50k, 3.8% for AGIs $50k-75k)
Total itemized deductions: $15,368 (28% of AGI, reported on 21.1% of returns)
Here:
$15,368
State:
$17,093
Here:
28.4% of AGI
State:
20.5% of AGI
(% of AGI for various income ranges: 28.3% for AGIs below $10k, 8.7% for AGIs $10k-25k, 9.4% for AGIs $25k-50k, 11.0% for AGIs $50k-75k, 13.4% for AGIs $75k-100k, 16.8% for AGIs over 100k)
Charity contributions deductions: $4,095 (7% of AGI, reported on 13.6% of returns)
Here:
$4,095
State:
$4,240
Here:
6.7% of AGI
State:
4.8% of AGI
(% of AGI for various income ranges: 1.3% for AGIs $10k-25k, 1.6% for AGIs $25k-50k, 1.9% for AGIs $50k-75k, 1.2% for AGIs $75k-100k, 5.8% for AGIs over 100k)
Total tax: $3,120 (reported on 66.1% of returns)
74038:
$3,120
State:
$6,542
(% of AGI for various income ranges: 4.3% for AGIs below $10k, 3.5% for AGIs $10k-25k, 5.5% for AGIs $25k-50k, 8.1% for AGIs $50k-75k, 10.2% for AGIs $75k-100k, 15.0% for AGIs over 100k)
Earned income credit: $2,006 (reported on 23.1% of returns)
Here:
$2,006
State:
$1,830
Percentage of individuals using paid preparers for their 2004 taxes: 68.7%
Here:
69%
State:
63%
(% for various income ranges: 61.6% for AGIs below $10k, 70.2% for AGIs $10k-25k, 73.3% for AGIs $25k-50k, 68.6% for AGIs $50k-75k, 65.4% for AGIs $75k-100k, 71.4% for AGIs over 100k)
Likely homosexual households (counted as self-reported same-sex unmarried-partner households)
Lesbian couples: 0.0% of all households
Gay men: 0.5% of all households
Household received Food Stamps/SNAP in the past 12 months: 96 Household did not receive Food Stamps/SNAP in the past 12 months: 748
Women who had a birth in the past 12 months: 23 (12 now married, 10 unmarried) Women who did not have a birth in the past 12 months: 351 (201 now married, 149 unmarried)
Housing units in zip code 74038 with a mortgage: 233 (4 second mortgage, 4 both second mortgage and home equity loan) Median monthly owner costs for units with a mortgage: $1,198 Median monthly owner costs for units without a mortgage: $400
Residents with income below the poverty level in 2022:
This zip code:
17.2%
Whole state:
15.7%
Residents with income below 50% of the poverty level in 2022:
This zip code:
12.3%
Whole state:
8.3%
Median number of rooms in houses and condos:
Here:
6.0
State:
6.1
Median number of rooms in apartments:
Here:
5.1
State:
4.5
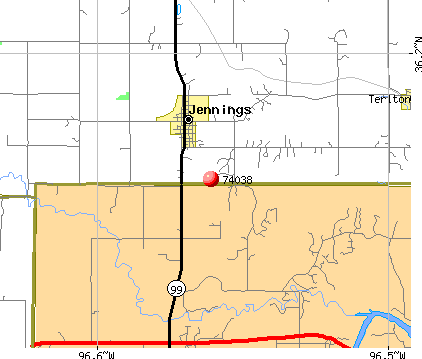
Notable locations in this zip code not listed on our city pages
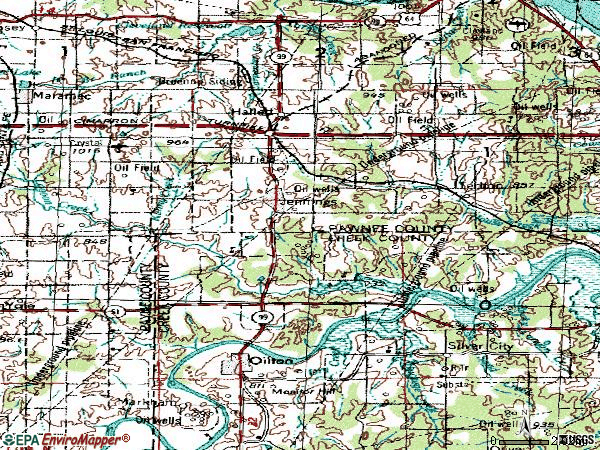
Notable locations in zip code 74038: Greenup Siding (A), Hallett Siding (B), Silver City Volunteer Fire Department (C), Jennings Fire Department (D). Display/hide their locations on the map
Size of family households: 262 2-persons, 136 3-persons, 60 4-persons, 58 5-persons, 46 6-persons, 7 7-or-more-persons
Size of nonfamily households: 242 1-person, 28 2-persons, 5 7-or-more-persons
338 married couples with children.
70 single-parent households (20 men, 50 women).
99.4% of residents of 74038 zip code speak English at home.
0.5% of residents speak Spanish at home (60% very well, 40% well).
0.1% of residents speak other language at home (100% very well).
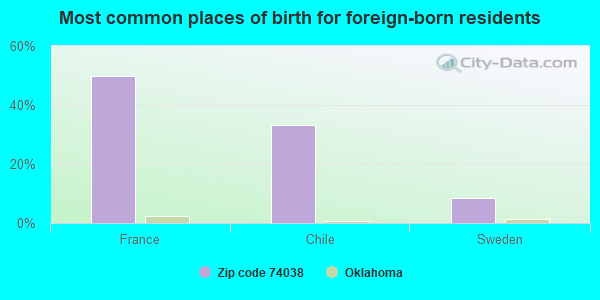
Foreign born population: 12 (0.6%) (38.6% of them are naturalized citizens)
This zip code:
0.6%
Whole state:
6.0%
50%France
33%Chile
8%Sweden
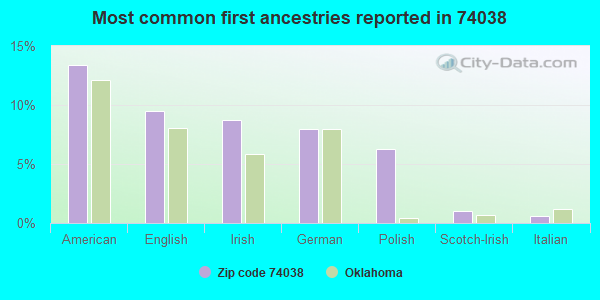
13%American
9%English
9%Irish
8%German
6%Polish
1%Scotch-Irish
1%Italian
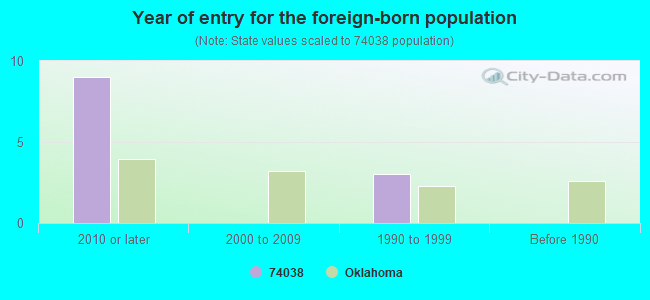
Year of entry for the foreign-born population
92010 or later
02000 to 2009
31990 to 1999
0Before 1990
Facilities with environmental interests located in this zip code:
DAVCO FAB INC (910 N MAIN in JENNINGS, OK)
Conditionally Exempt Small Quantity Generators, less than 100 kg/month of hazardous waste (Resource Conservation and Recovery Act (tracking hazardous waste)) - notification Organizations: DAVID L FRICK (CONTACT/OWNER)
Housing units lacking complete plumbing facilities: 6.6% Housing units lacking complete kitchen facilities: 3.5%
51.1%Electricity
30.6%Bottled, tank, or LP gas
8.4%Wood
8.1%Utility gas
1.2%Other fuel
0.9%No fuel used
Population in 1990: 766. Population change in the 1990s: +1,264 (+165.0%).
Place of birth for U.S.-born residents:
This state: 1,637
Northeast: 73
Midwest: 186
South: 119
West: 135
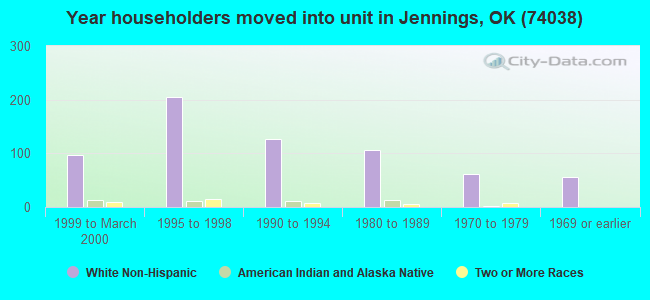
62% of the 74038 zip code residents lived in the same house 5 years ago. Out of people who lived in different houses, 45% lived in this county. Out of people who lived in different counties, 50% lived in Oklahoma.
97% of the 74038 zip code residents lived in the same house 1 year ago. Out of people who lived in different houses, 63% moved from this county. Out of people who lived in different houses, 56% moved from different county within same state.
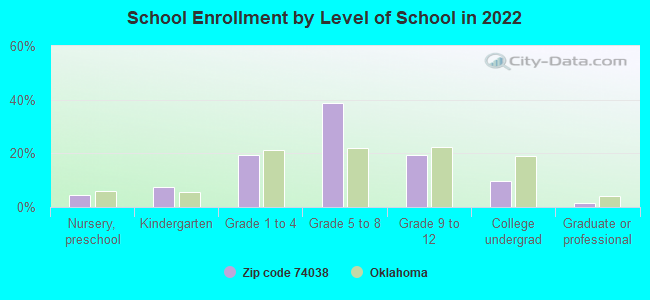
Private vs. public school enrollment:
Students in private schools in grades 1 to 8 (elementary and middle school): 12
Here:
4.7%
Oklahoma:
11.7%
Students in private schools in grades 9 to 12 (high school): 2
Here:
2.8%
Oklahoma:
11.7%
Students in private undergraduate colleges: 7
Here:
17.9%
Oklahoma:
19.3%
Occupation by median earnings in the past 12 months ($)
97,465Architecture and engineering occupations
90,610Computer and mathematical occupations
83,978Management occupations
67,018Construction and extraction occupations
62,725Health diagnosing and treating practitioners and other technical occupations
60,448Installation, maintenance, and repair occupations
Top industries in this zip code by the number of employees in 2005:
Construction: Highway, Street, and Bridge Construction (10-19 employees: 1 establishment)
Construction: Plumbing, Heating, and Air-Conditioning Contractors (5-9: 1, 1-4: 1)
Professional, Scientific, and Technical Services: Environmental Consulting Services (5-9: 1)
Construction: Residential Remodelers (5-9: 1)
Accommodation and Food Services: Limited-Service Restaurants (1-4: 1)
Utilities: Natural Gas Distribution (1-4: 1)
Fatal accident statistics in 2014:
Fatal accident count: 1
Vehicles involved in fatal accidents: 1
Fatal accidents caused by drunken drivers: 0
Fatalities: 1
Persons involved in fatal accidents: 3
Pedestrians involved in fatal accidents: 0
Fatal accident statistics in 2013:
Fatal accident count: 1
Vehicles involved in fatal accidents: 2
Fatal accidents caused by drunken drivers: 0
Fatalities: 1
Persons involved in fatal accidents: 4
Pedestrians involved in fatal accidents: 0
Home Mortgage Disclosure Act Aggregated Statistics For Year 2009 (Based on 4 partial tracts)
A) FHA, FSA/RHS & VA Home Purchase Loans
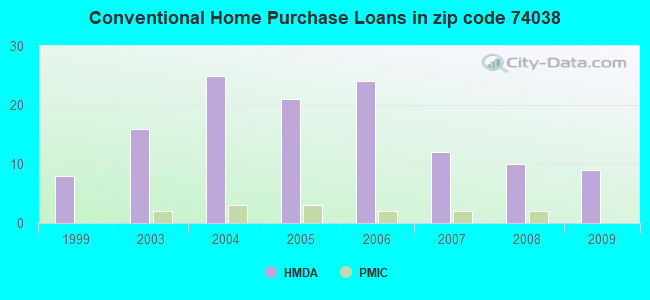
B) Conventional Home Purchase Loans
C) Refinancings
D) Home Improvement Loans
F) Non-occupant Loans on < 5 Family Dwellings (A B C & D)
G) Loans On Manufactured Home Dwelling (A B C & D)
Number
Average Value
Number
Average Value
Number
Average Value
Number
Average Value
Number
Average Value
Number
Average Value
LOANS ORIGINATED
11
$96,065
9
$46,316
18
$108,113
10
$19,823
3
$26,733
12
$55,832
APPLICATIONS APPROVED, NOT ACCEPTED
0
$0
2
$52,630
2
$92,210
1
$17,310
1
$37,890
2
$64,615
APPLICATIONS DENIED
2
$97,110
10
$59,486
10
$143,417
7
$9,306
0
$0
7
$73,710
APPLICATIONS WITHDRAWN
2
$42,915
1
$62,720
5
$108,846
0
$0
1
$49,260
0
$0
FILES CLOSED FOR INCOMPLETENESS
1
$60,000
0
$0
1
$87,300
0
$0
0
$0
0
$0
Aggregated Statistics For Year 2008 (Based on 4 partial tracts)
A) FHA, FSA/RHS & VA Home Purchase Loans
B) Conventional Home Purchase Loans
C) Refinancings
D) Home Improvement Loans
F) Non-occupant Loans on < 5 Family Dwellings (A B C & D)
G) Loans On Manufactured Home Dwelling (A B C & D)
Number
Average Value
Number
Average Value
Number
Average Value
Number
Average Value
Number
Average Value
Number
Average Value
LOANS ORIGINATED
10
$100,188
10
$73,814
16
$81,716
10
$16,972
5
$33,168
10
$50,423
APPLICATIONS APPROVED, NOT ACCEPTED
1
$36,150
3
$68,700
1
$92,300
0
$0
1
$31,540
3
$59,833
APPLICATIONS DENIED
3
$108,327
8
$51,292
17
$93,453
9
$33,748
1
$2,270
9
$59,471
APPLICATIONS WITHDRAWN
1
$48,500
2
$77,495
8
$153,879
2
$27,300
0
$0
2
$68,075
FILES CLOSED FOR INCOMPLETENESS
0
$0
0
$0
2
$82,410
0
$0
0
$0
0
$0
Aggregated Statistics For Year 2007 (Based on 4 partial tracts)
A) FHA, FSA/RHS & VA Home Purchase Loans
B) Conventional Home Purchase Loans
C) Refinancings
D) Home Improvement Loans
F) Non-occupant Loans on < 5 Family Dwellings (A B C & D)
G) Loans On Manufactured Home Dwelling (A B C & D)
Number
Average Value
Number
Average Value
Number
Average Value
Number
Average Value
Number
Average Value
Number
Average Value
LOANS ORIGINATED
3
$81,523
12
$57,728
13
$78,870
11
$31,774
3
$62,357
11
$50,582
APPLICATIONS APPROVED, NOT ACCEPTED
0
$0
3
$63,763
2
$64,805
1
$46,540
0
$0
3
$56,457
APPLICATIONS DENIED
2
$66,520
10
$59,435
20
$82,494
4
$34,035
2
$32,515
10
$65,869
APPLICATIONS WITHDRAWN
0
$0
2
$43,445
7
$90,747
1
$19,770
1
$27,280
2
$89,420
FILES CLOSED FOR INCOMPLETENESS
0
$0
0
$0
2
$131,075
0
$0
0
$0
0
$0
Aggregated Statistics For Year 2006 (Based on 4 partial tracts)
A) FHA, FSA/RHS & VA Home Purchase Loans
B) Conventional Home Purchase Loans
C) Refinancings
D) Home Improvement Loans
F) Non-occupant Loans on < 5 Family Dwellings (A B C & D)
G) Loans On Manufactured Home Dwelling (A B C & D)
Number
Average Value
Number
Average Value
Number
Average Value
Number
Average Value
Number
Average Value
Number
Average Value
LOANS ORIGINATED
3
$103,247
24
$64,413
16
$87,404
20
$20,327
3
$57,333
18
$50,400
APPLICATIONS APPROVED, NOT ACCEPTED
0
$0
4
$49,612
2
$94,225
2
$7,955
0
$0
4
$49,612
APPLICATIONS DENIED
2
$72,640
17
$52,531
29
$91,488
6
$39,403
0
$0
16
$56,199
APPLICATIONS WITHDRAWN
0
$0
5
$57,306
18
$98,617
6
$40,182
1
$26,540
4
$75,862
FILES CLOSED FOR INCOMPLETENESS
0
$0
1
$59,230
1
$57,120
0
$0
0
$0
0
$0
Aggregated Statistics For Year 2005 (Based on 4 partial tracts)
A) FHA, FSA/RHS & VA Home Purchase Loans
B) Conventional Home Purchase Loans
C) Refinancings
D) Home Improvement Loans
F) Non-occupant Loans on < 5 Family Dwellings (A B C & D)
G) Loans On Manufactured Home Dwelling (A B C & D)
Number
Average Value
Number
Average Value
Number
Average Value
Number
Average Value
Number
Average Value
Number
Average Value
LOANS ORIGINATED
2
$99,555
21
$73,745
29
$66,901
22
$20,482
7
$44,730
17
$35,868
APPLICATIONS APPROVED, NOT ACCEPTED
0
$0
6
$67,240
4
$100,478
2
$52,115
0
$0
5
$59,112
APPLICATIONS DENIED
1
$125,660
27
$56,464
25
$92,923
13
$22,663
3
$58,627
18
$54,673
APPLICATIONS WITHDRAWN
0
$0
3
$81,060
21
$84,950
3
$31,770
0
$0
4
$60,042
FILES CLOSED FOR INCOMPLETENESS
0
$0
0
$0
1
$84,230
0
$0
0
$0
0
$0
Aggregated Statistics For Year 2004 (Based on 4 partial tracts)
A) FHA, FSA/RHS & VA Home Purchase Loans
B) Conventional Home Purchase Loans
C) Refinancings
D) Home Improvement Loans
F) Non-occupant Loans on < 5 Family Dwellings (A B C & D)
G) Loans On Manufactured Home Dwelling (A B C & D)
Number
Average Value
Number
Average Value
Number
Average Value
Number
Average Value
Number
Average Value
Number
Average Value
LOANS ORIGINATED
2
$65,380
25
$73,736
24
$55,420
14
$30,402
2
$40,615
11
$47,650
APPLICATIONS APPROVED, NOT ACCEPTED
0
$0
3
$55,270
11
$70,191
1
$41,310
0
$0
3
$68,167
APPLICATIONS DENIED
1
$111,150
17
$61,908
41
$88,483
13
$29,713
2
$75,045
21
$56,364
APPLICATIONS WITHDRAWN
1
$51,150
2
$66,490
18
$86,604
2
$25,705
0
$0
3
$59,410
FILES CLOSED FOR INCOMPLETENESS
0
$0
0
$0
3
$118,700
0
$0
0
$0
0
$0
Aggregated Statistics For Year 2003 (Based on 4 partial tracts)
A) FHA, FSA/RHS & VA Home Purchase Loans
B) Conventional Home Purchase Loans
C) Refinancings
D) Home Improvement Loans
F) Non-occupant Loans on < 5 Family Dwellings (A B C & D)
Number
Average Value
Number
Average Value
Number
Average Value
Number
Average Value
Number
Average Value
LOANS ORIGINATED
4
$96,298
16
$52,616
28
$75,735
10
$23,465
4
$23,950
APPLICATIONS APPROVED, NOT ACCEPTED
0
$0
4
$35,718
5
$79,090
0
$0
0
$0
APPLICATIONS DENIED
0
$0
17
$55,220
28
$71,845
4
$12,818
1
$38,840
APPLICATIONS WITHDRAWN
1
$75,770
0
$0
13
$74,156
0
$0
0
$0
FILES CLOSED FOR INCOMPLETENESS
0
$0
1
$57,690
1
$46,920
0
$0
0
$0
Aggregated Statistics For Year 1999 (Based on 2 partial tracts)
A) FHA, FSA/RHS & VA Home Purchase Loans
B) Conventional Home Purchase Loans
C) Refinancings
D) Home Improvement Loans
F) Non-occupant Loans on < 5 Family Dwellings (A B C & D)
Detailed PMIC statistics for the following Tracts:0207.04
, 0207.05
2004 - 2018 National Fire Incident Reporting System (NFIRS) incidents
According to the data from the years 2004 - 2018 the average number of fires per year is 30. The highest number of fires - 121 took place in 2005, and the least - 0 in 2011. The data has a dropping trend.
When looking into fire subcategories, the most incidents belonged to: Outside Fires (77.8%), and Structure Fires (16.0%).
Fire incident types reported to NFIRS in Zip Code 74038


 Nearest zip codes: 74034, 74052, 74081, 74045, 74020, 74085.


 According to the data from the years 2004 - 2018 the average number of fires per year is 30. The highest number of fires - 121 took place in 2005, and the least - 0 in 2011. The data has a dropping trend.
 When looking into fire subcategories, the most incidents belonged to: Outside Fires (77.8%), and Structure Fires (16.0%).