Estimated zip code population in 2022: 4,191 Zip code population in 2010: 4,565 Zip code population in 2000: 4,860
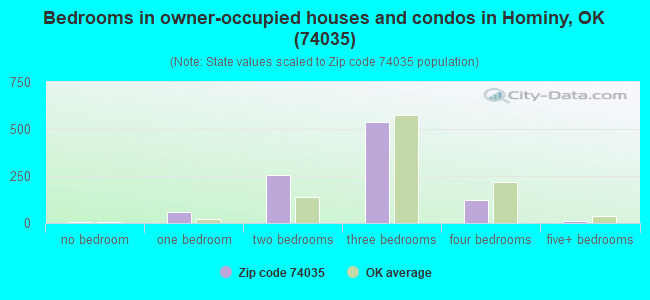
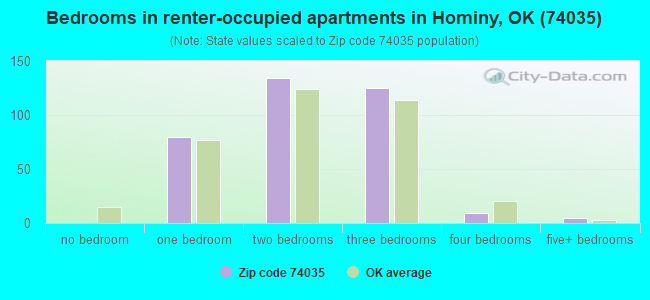
Houses and condos: 1,652 Renter-occupied apartments: 355
% of renters here:
26%
State:
35%
March 2022 cost of living index in zip code 74035: 84.1 (less than average, U.S. average is 100)
Land area: 241.0 sq. mi. Water area: 7.6 sq. mi.
Population density: 17 people per square mile
(very low).
OSM Map
General Map
Google Map
MSN Map
OSM Map
General Map
Google Map
MSN Map
OSM Map
General Map
Google Map
MSN Map
OSM Map
General Map
Google Map
MSN Map
Please wait while loading the map...
Real estate property taxes paid for housing units in 2022:
This zip code:
0.8% ($724)
Oklahoma:
0.8% ($1,501)
Median real estate property taxes paid for housing units with mortgages in 2022: $865 (0.7%) Median real estate property taxes paid for housing units with no mortgage in 2022: $647 (0.9%)
Business Search- 14 Million verified businesses
Males: 2,701
(64.5%)
Females: 1,488
(35.5%)
For population 25 years and over in 74035:
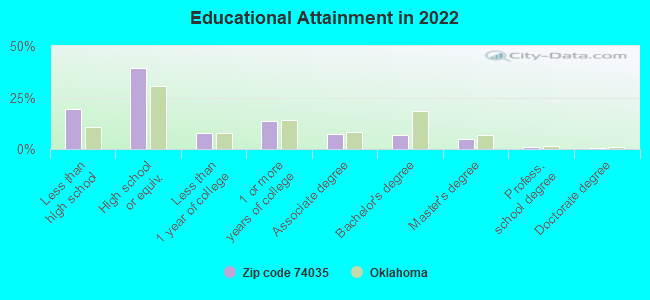
High school or higher: 78.7%
Bachelor's degree or higher: 12.3%
Graduate or professional degree: 5.7%
Unemployed: 3.7%
Mean travel time to work (commute): 30.2 minutes
For population 15 years and over in 74035:
Never married: 35.4%
Now married: 36.7%
Separated: 3.8%
Widowed: 7.7%
Divorced: 16.4%
Zip code 74035 compared to state average:
Median house value below state average.
Hispanic race population percentage below state average.
Median age above state average.
Foreign-born population percentage significantly below state average.
Length of stay since moving in significantly above state average.
House age above state average.
Percentage of population with a bachelor's degree or higher below state average.
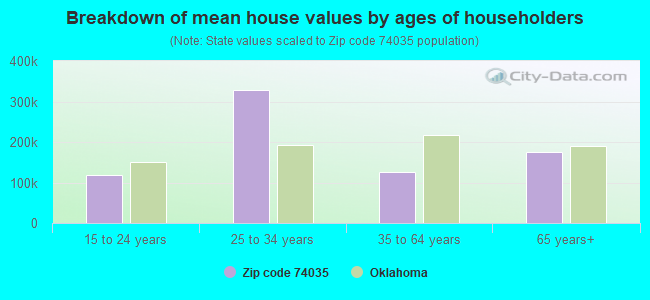
Estimated median house/condo value in 2022: $94,220
74035:
$94,220
Oklahoma:
$191,700
According to our research of Oklahoma and other state lists, there were 8 registered sex offenders living in 74035 zip code as of May 24, 2024. The ratio of all residents to sex offenders in zip code 74035 is 539 to 1. The ratio of registered sex offenders to all residents in this zip code is near the state average.
Median resident age:
This zip code:
44.1 years
Oklahoma median age:
37.1 years
Average household size:
This zip code:
2.2 people
Oklahoma:
2.5 people
Averages for the 2020 tax year for zip code 74035, filed in 2021:
Average Adjusted Gross Income (AGI) in 2020: $39,517 (Individual Income Tax Returns)
Here:
$39,517
State:
$63,060
Salary/wage: $36,219 (reported on 79.7% of returns)
Here:
$36,219
State:
$52,427
(% of AGI for various income ranges: 1128.7% for AGIs below $25k, 3258.3% for AGIs $25k-50k, 6336.4% for AGIs $50k-75k, 9535.7% for AGIs $75k-100k, 16751.7% for AGIs $100k-200k)
Taxable interest for individuals: $588 (reported on 23.8% of returns)
This zip code:
$588
Oklahoma:
$1,603
(% of AGI for various income ranges: 14.5% for AGIs below $25k, 12.0% for AGIs $25k-50k, 43.6% for AGIs $50k-75k, 24.3% for AGIs $75k-100k, 41.7% for AGIs $100k-200k)
Ordinary dividends: $2,460 (reported on 7.0% of returns)
Here:
$2,460
State:
$7,001
(% of AGI for various income ranges: 4.5% for AGIs below $25k, 18.0% for AGIs $25k-50k, 27.1% for AGIs $50k-75k, 213.3% for AGIs $100k-200k)
Net capital gain/loss in AGI: +$8,730 (reported on 7.0% of returns)
Here:
+$8,730
State:
+$19,855
(% of AGI for various income ranges: 52.0% for AGIs $25k-50k, 155.0% for AGIs $50k-75k, 791.7% for AGIs $100k-200k)
Profit/loss from business: +$5,858 (reported on 13.3% of returns)
Here:
+$5,858
State:
+$9,904
(% of AGI for various income ranges: 81.1% for AGIs below $25k, 133.1% for AGIs $25k-50k, 77.1% for AGIs $50k-75k, 385.0% for AGIs $100k-200k)
Taxable individual retirement arrangement distribution: $17,514 (reported on 4.9% of returns)
74035:
$17,514
Oklahoma:
$20,476
(% of AGI for various income ranges: 37.9% for AGIs below $25k, 102.0% for AGIs $25k-50k, 1035.7% for AGIs $75k-100k)
Total itemized deductions: $34,250 (reported on 2.8% of returns)
Here:
$34,250
State:
$39,736
(% of AGI for various income ranges: 161.6% for AGIs below $25k, 1260.0% for AGIs $100k-200k)
Charity contributions: $12,533 (reported on 2.1% of returns)
Here:
$12,533
State:
$17,288
(% of AGI for various income ranges: 268.6% for AGIs $50k-75k)
Taxes paid: $4,325 (reported on 2.8% of returns)
74035:
$4,325
State:
$7,046
(% of AGI for various income ranges: 288.3% for AGIs $100k-200k)
Earned income credit: $2,326 (reported on 23.8% of returns)
Here:
$2,326
State:
$2,435
(% of AGI for various income ranges: 111.3% for AGIs below $25k, 105.1% for AGIs $25k-50k)
Percentage of individuals using paid preparers for their 2020 taxes: 88.1%
Here:
88%
State:
94%
(% for various income ranges: 79.0% for AGIs below $25k, 95.1% for AGIs $25k-50k, 94.7% for AGIs $50k-75k, 100.0% for AGIs $75k-100k, 90.9% for AGIs $100k-200k)
Averages for the 2012 tax year for zip code 74035, filed in 2013:
Average Adjusted Gross Income (AGI) in 2012: $42,160 (Individual Income Tax Returns)
Here:
$42,160
State:
$58,581
Salary/wage: $35,001 (reported on 84.7% of returns)
Here:
$35,001
State:
$45,973
(% of AGI for various income ranges: 76.8% for AGIs below $25k, 80.0% for AGIs $25k-50k, 76.0% for AGIs $50k-75k, 78.6% for AGIs $75k-100k, 49.5% for AGIs $100k-200k)
Taxable interest for individuals: $1,059 (reported on 28.5% of returns)
This zip code:
$1,059
Oklahoma:
$1,625
(% of AGI for various income ranges: 2.3% for AGIs below $25k, 0.8% for AGIs $25k-50k, 0.3% for AGIs $50k-75k, 0.4% for AGIs $75k-100k, 0.5% for AGIs $100k-200k)
Ordinary dividends: $1,700 (reported on 8.0% of returns)
Here:
$1,700
State:
$6,374
(% of AGI for various income ranges: 0.4% for AGIs below $25k, 0.5% for AGIs $25k-50k, 0.4% for AGIs $75k-100k, 0.3% for AGIs $100k-200k)
Net capital gain/loss in AGI: +$3,636 (reported on 8.0% of returns)
Here:
+$3,636
State:
+$24,023
(% of AGI for various income ranges: 0.3% for AGIs $25k-50k, 1.3% for AGIs $50k-75k, 1.3% for AGIs $100k-200k)
Profit/loss from business: +$14,091 (reported on 16.8% of returns)
Here:
+$14,091
State:
+$11,913
(% of AGI for various income ranges: 8.9% for AGIs below $25k, 4.1% for AGIs $25k-50k, 3.1% for AGIs $50k-75k, 4.9% for AGIs $75k-100k, 7.9% for AGIs $100k-200k)
Taxable individual retirement arrangement distribution: $8,425 (reported on 5.8% of returns)
74035:
$8,425
Oklahoma:
$15,242
Total itemized deductions: $22,000 (23% of AGI, reported on 17.5% of returns)
Here:
$22,000
State:
$24,882
Here:
22.9% of AGI
State:
18.8% of AGI
(% of AGI for various income ranges: 7.3% for AGIs $25k-50k, 9.1% for AGIs $50k-75k, 11.0% for AGIs $75k-100k, 13.3% for AGIs $100k-200k)
Charity contributions: $6,407 (reported on 10.9% of returns)
Here:
$6,407
State:
$6,591
(% of AGI for various income ranges: 1.5% for AGIs $25k-50k, 1.5% for AGIs $50k-75k, 1.4% for AGIs $75k-100k, 2.8% for AGIs $100k-200k)
Taxes paid: $4,762 (reported on 17.5% of returns)
74035:
$4,762
State:
$7,196
(% of AGI for various income ranges: 1.0% for AGIs $25k-50k, 1.5% for AGIs $50k-75k, 2.5% for AGIs $75k-100k, 3.7% for AGIs $100k-200k)
Earned income credit: $2,203 (reported on 27.0% of returns)
Here:
$2,203
State:
$2,354
(% of AGI for various income ranges: 8.8% for AGIs below $25k, 1.7% for AGIs $25k-50k)
Percentage of individuals using paid preparers for their 2012 taxes: 70.8%
Here:
71%
State:
56%
(% for various income ranges: 64.4% for AGIs below $25k, 71.8% for AGIs $25k-50k, 72.2% for AGIs $50k-75k, 83.3% for AGIs $75k-100k, 88.9% for AGIs $100k-200k)
Averages for the 2004 tax year for zip code 74035, filed in 2005:
Average Adjusted Gross Income (AGI) in 2004: $28,978 (Individual Income Tax Returns)
Here:
$28,978
State:
$41,245
Salary/wage: $26,764 (reported on 84.2% of returns)
Here:
$26,764
State:
$35,318
(% of AGI for various income ranges: 148.1% for AGIs below $10k, 77.4% for AGIs $10k-25k, 83.3% for AGIs $25k-50k, 84.7% for AGIs $50k-75k, 76.4% for AGIs $75k-100k, 35.5% for AGIs over 100k)
Taxable interest for individuals: $1,464 (reported on 35.6% of returns)
This zip code:
$1,464
Oklahoma:
$1,745
(% of AGI for various income ranges: 9.4% for AGIs below $10k, 2.8% for AGIs $10k-25k, 0.7% for AGIs $25k-50k, 0.6% for AGIs $50k-75k, 0.7% for AGIs $75k-100k, 4.9% for AGIs over 100k)
Taxable dividends: $923 (reported on 11.1% of returns)
Here:
$923
State:
$2,920
(% of AGI for various income ranges: 2.7% for AGIs below $10k, 0.3% for AGIs $10k-25k, 0.5% for AGIs $25k-50k, 0.1% for AGIs $50k-75k, 0.2% for AGIs over 100k)
Net capital gain/loss: +$3,045 (reported on 9.5% of returns)
Here:
+$3,045
State:
+$10,653
(% of AGI for various income ranges: 0.0% for AGIs below $10k, 0.3% for AGIs $10k-25k, 0.4% for AGIs $25k-50k, 0.9% for AGIs $50k-75k, 4.8% for AGIs over 100k)
Profit/loss from business: +$8,741 (reported on 18.5% of returns)
Here:
+$8,741
State:
+$8,532
(% of AGI for various income ranges: 6.4% for AGIs below $10k, 6.3% for AGIs $10k-25k, 4.4% for AGIs $25k-50k, 1.9% for AGIs $50k-75k, 4.6% for AGIs $75k-100k, 15.6% for AGIs over 100k)
IRA payment deduction: $3,050 (reported on 1.4% of returns)
74035:
$3,050
Oklahoma:
$3,127
Total itemized deductions: $16,323 (27% of AGI, reported on 18.1% of returns)
Here:
$16,323
State:
$17,093
Here:
27.1% of AGI
State:
20.5% of AGI
(% of AGI for various income ranges: 11.0% for AGIs below $10k, 5.1% for AGIs $10k-25k, 9.3% for AGIs $25k-50k, 8.9% for AGIs $50k-75k, 10.1% for AGIs $75k-100k, 22.1% for AGIs over 100k)
Charity contributions deductions: $3,276 (5% of AGI, reported on 14.0% of returns)
Here:
$3,276
State:
$4,240
Here:
5.3% of AGI
State:
4.8% of AGI
(% of AGI for various income ranges: 1.2% for AGIs $10k-25k, 1.5% for AGIs $25k-50k, 1.5% for AGIs $50k-75k, 1.4% for AGIs $75k-100k, 2.9% for AGIs over 100k)
Total tax: $3,544 (reported on 63.8% of returns)
74035:
$3,544
State:
$6,542
(% of AGI for various income ranges: 3.6% for AGIs below $10k, 3.6% for AGIs $10k-25k, 5.6% for AGIs $25k-50k, 8.4% for AGIs $50k-75k, 11.0% for AGIs $75k-100k, 16.9% for AGIs over 100k)
Earned income credit: $1,730 (reported on 27.0% of returns)
Here:
$1,730
State:
$1,830
Percentage of individuals using paid preparers for their 2004 taxes: 77.0%
Here:
77%
State:
63%
(% for various income ranges: 73.5% for AGIs below $10k, 77.5% for AGIs $10k-25k, 77.0% for AGIs $25k-50k, 77.5% for AGIs $50k-75k, 84.8% for AGIs $75k-100k, 100.0% for AGIs over 100k)
Household received Food Stamps/SNAP in the past 12 months: 210 Household did not receive Food Stamps/SNAP in the past 12 months: 1,143
Women who had a birth in the past 12 months: 46 (34 now married, 11 unmarried) Women who did not have a birth in the past 12 months: 486 (196 now married, 290 unmarried)
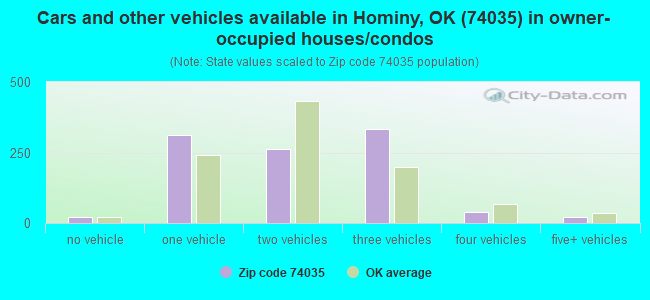
Housing units in zip code 74035 with a mortgage: 335 (24 second mortgage, 24 both second mortgage and home equity loan) Median monthly owner costs for units with a mortgage: $957 Median monthly owner costs for units without a mortgage: $434
Residents with income below the poverty level in 2022:
This zip code:
22.7%
Whole state:
15.7%
Residents with income below 50% of the poverty level in 2022:
This zip code:
9.3%
Whole state:
8.3%
Median number of rooms in houses and condos:
Here:
5.9
State:
6.1
Median number of rooms in apartments:
Here:
4.7
State:
4.5
Notable locations in this zip code not listed on our city pages
Notable locations in zip code 74035: Dick Conner Correctional Center (A), Hominy Community Medical Trust Authority EMS (B), Hominy Ranchers Rural Fire Department (C), Hominy Fire Department (D). Display/hide their locations on the map
Churches in zip code 74035 include: Saint Josephs Catholic Church (A), New Life Church (B), First United Methodist Church (C), First Presbyterian Church (D), First Baptist Church (E), Faith Christian Fellowship Church (F), Church of Nazarene (G). Display/hide their locations on the map
Cemeteries: Boston Pool Cemetery (1), Hominy Cemetery (2), Ridge Family Cemetery (3), Hominy Indian Village Cemetery (4). Display/hide their locations on the map
Reservoirs: Southern Great Plains Field Station Lake (A), Hominy Municipal Lake (B), Oknoname 113060 Reservoir (C), Oknoname 113066 Reservoir (D), Oknoname 113061 Reservoir (E), Lower Lake Hominy (F), Oknoname 113062 Reservoir (G), Municipal Lake (H). Display/hide their locations on the map
Streams, rivers, and creeks: Wildhorse Creek (A), Daniels Run (B), Buck Creek (C), Boar Creek (D), Blackbird Creek (E), Black Dog Creek (F), Hellroaring Creek (G), Twomile Creek (H), Turkey Run (I). Display/hide their locations on the map
In group quarters: 1,261 (-1 institutionalized population)
Size of family households: 435 2-persons, 201 3-persons, 116 4-persons, 48 5-persons, 5 6-persons, 27 7-or-more-persons
Size of nonfamily households: 473 1-person, 44 2-persons
241 married couples with children.
263 single-parent households (71 men, 192 women).
95.8% of residents of 74035 zip code speak English at home.
3.0% of residents speak Spanish at home (75% very well, 4% well, 16% not well, 5% not at all).
1.0% of residents speak other language at home (100% very well).
Foreign born population: 51 (1.2%) (48.2% of them are naturalized citizens)
This zip code:
1.2%
Whole state:
6.0%
53%Honduras
22%Haiti
2%Argentina
9%American
5%Irish
5%German
4%English
1%British
1%Italian
1%Jamaican
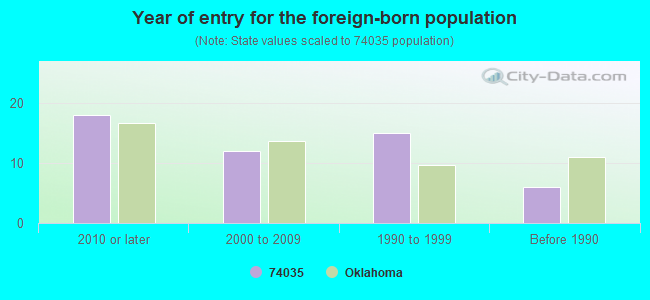
Year of entry for the foreign-born population
182010 or later
122000 to 2009
151990 to 1999
6Before 1990
Facilities with environmental interests located in this zip code:
CLARA JO HORN (RT 1 BOX 900 in HOMINY, OK)
(Integrated Compliance Information System) - ICIS-06-1993-0088, FORMAL ENFORCEMENT ACTION Business SIC classification: CRUDE PETROLEUM AND NATURAL GAS
CLEMISHIRE OIL CO (PO BOX 558 in HOMINY, OK) . Tribal Land
(Integrated Compliance Information System) - ICIS-06-1994-0114, FORMAL ENFORCEMENT ACTION, ICIS-06-1995-0293, Business SIC classification: CRUDE PETROLEUM AND NATURAL GAS
DON CLEMISHIRE OIL CO (RUR RTE 1, PO BOX 1090 in HOMINY, OK) . Tribal Land
(Integrated Compliance Information System) - ICIS-06-1995-0237, FORMAL ENFORCEMENT ACTION Business SIC classification: CRUDE PETROLEUM AND NATURAL GAS
MARK CLEMISHIRE OIL CO (NW/4 OF SEC. 21, T22 N, R10 E in HOMINY, OK)
(Integrated Compliance Information System) - ICIS-06-2001-0158, FORMAL ENFORCEMENT ACTION Business SIC classification: CRUDE PETROLEUM AND NATURAL GAS
ARCO PIPELINE CO OSAGE STATION (10 MI E ON HWY #20 in HOMINY, OK)
(Resource Conservation and Recovery Act (tracking hazardous waste)) Organizations: ARCO PIPE LINE CO (CONTACT/OWNER)
CITY OF HOMINY (PO BOX 219 in HOMINY, OK)
National Pollutant Discharge Elimination System NON-MAJOR (Tracking pollutant discharge elimination systems) - permit Business SIC classification: SEWERAGE SYSTEMS Alternative names: HOMINY, CITY OF
CITY OF HOMINY - WATER PLANT (PO BOX 219 in HOMINY, OK)
National Pollutant Discharge Elimination System NON-MAJOR (Tracking pollutant discharge elimination systems) - permit Business SIC classification: WATER SUPPLY Alternative names: HOMINY, CITY OF- WATER PLANT
DOWELL SCHLUMBERGER - HOMINY (HIGHWAY 99 NORTH in HOMINY, OK) . Tribal Land
Conditionally Exempt Small Quantity Generators, less than 100 kg/month of hazardous waste (Resource Conservation and Recovery Act (tracking hazardous waste)) Business NAICS classification: SUPPORT ACTIVITIES FOR OIL AND GAS OPERATIONS.
FARMLAND IND PIPELI/OSAGE STA (10 MI E in HOMINY, OK)
AIR MINOR (AIRS/AFS) Business SIC classification: REFINED PETROLEUM PIPELINES Alternative names: FARMLAND IND INC /OSAGE STA
C & G OILFIELD EQUIPMENT (1011 N EASTERN in HOMINY, OK)
Conditionally Exempt Small Quantity Generators, less than 100 kg/month of hazardous waste (Resource Conservation and Recovery Act (tracking hazardous waste)) - notification Organizations: E W CARTER (CONTACT/OWNER)
Housing units lacking complete plumbing facilities: 10.9% Housing units lacking complete kitchen facilities: 10.0%
62.7%Utility gas
21.1%Electricity
14.2%Bottled, tank, or LP gas
2.1%Wood
Population in 1990: 3,410. Population change in the 1990s: +1,450 (+42.5%).
Place of birth for U.S.-born residents:
This state: 2,881
Northeast: 34
Midwest: 443
South: 335
West: 447
56% of the 74035 zip code residents lived in the same house 5 years ago. Out of people who lived in different houses, 40% lived in this county. Out of people who lived in different counties, 50% lived in Oklahoma.
84% of the 74035 zip code residents lived in the same house 1 year ago. Out of people who lived in different houses, 7% moved from this county. Out of people who lived in different houses, 94% moved from different county within same state. Out of people who lived in different houses, 1% moved from different state.
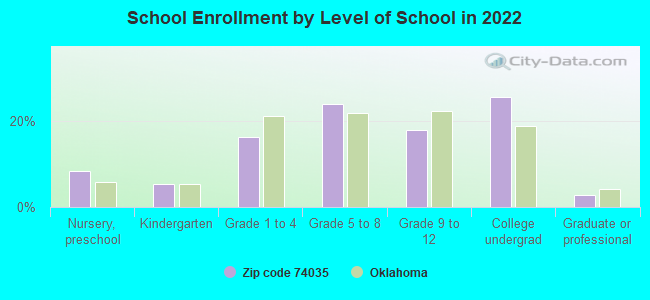
Private vs. public school enrollment:
Students in private schools in grades 1 to 8 (elementary and middle school):
Here:
0.0%
Oklahoma:
11.7%
Students in private schools in grades 9 to 12 (high school):
Here:
0.0%
Oklahoma:
11.7%
Students in private undergraduate colleges: 20
Here:
13.1%
Oklahoma:
19.3%
Occupation by median earnings in the past 12 months ($)
83,190Health diagnosing and treating practitioners and other technical occupations
65,223Construction and extraction occupations
56,952Business and financial operations occupations
55,152Management occupations
53,900Installation, maintenance, and repair occupations
50,143Education, training, and library occupations
Top industries in this zip code by the number of employees in 2005:
Construction: Oil and Gas Pipeline and Related Structures Construction (50-99 employees: 1 establishment)
Other Services (except Public Administration): Commercial and Industrial Machinery and Equipment (except Automotive and Electronic) Repair and Maintenance (10-19: 1, 1-4: 1)
Real Estate and Rental and Leasing: Construction, Mining, and Forestry Machinery and Equipment Rental and Leasing (10-19: 1, 1-4: 1)
Health Care and Social Assistance: Child Day Care Services (5-9: 2, 1-4: 1)
Finance and Insurance: Commercial Banking (10-19: 1)
People in group quarters in 2010:
1,182 people in state prisons
9 people in group homes intended for adults
People in group quarters in 2000:
1,211 people in state prisons
35 people in nursing homes
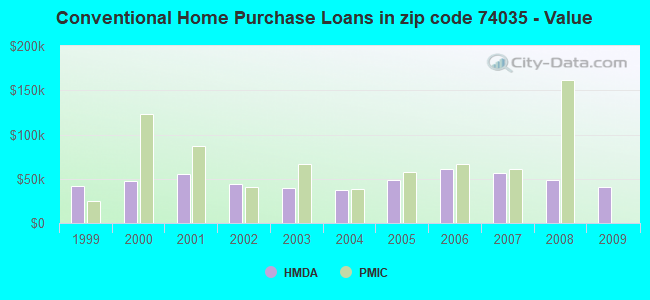
Home Mortgage Disclosure Act Aggregated Statistics For Year 2009 (Based on 2 partial tracts)
A) FHA, FSA/RHS & VA Home Purchase Loans
B) Conventional Home Purchase Loans
C) Refinancings
D) Home Improvement Loans
F) Non-occupant Loans on < 5 Family Dwellings (A B C & D)
G) Loans On Manufactured Home Dwelling (A B C & D)
Number
Average Value
Number
Average Value
Number
Average Value
Number
Average Value
Number
Average Value
Number
Average Value
LOANS ORIGINATED
19
$74,690
21
$40,467
48
$86,938
25
$24,375
12
$34,891
12
$34,084
APPLICATIONS APPROVED, NOT ACCEPTED
3
$52,510
3
$58,957
4
$141,635
0
$0
0
$0
0
$0
APPLICATIONS DENIED
3
$94,423
11
$105,645
36
$74,349
11
$30,651
1
$48,360
12
$62,296
APPLICATIONS WITHDRAWN
0
$0
7
$38,493
15
$89,725
4
$53,545
1
$22,110
1
$78,760
FILES CLOSED FOR INCOMPLETENESS
1
$33,160
1
$74,620
4
$168,235
0
$0
0
$0
0
$0
Aggregated Statistics For Year 2008 (Based on 2 partial tracts)
A) FHA, FSA/RHS & VA Home Purchase Loans
B) Conventional Home Purchase Loans
C) Refinancings
D) Home Improvement Loans
F) Non-occupant Loans on < 5 Family Dwellings (A B C & D)
G) Loans On Manufactured Home Dwelling (A B C & D)
Number
Average Value
Number
Average Value
Number
Average Value
Number
Average Value
Number
Average Value
Number
Average Value
LOANS ORIGINATED
12
$81,066
30
$48,317
58
$75,046
26
$32,366
23
$23,971
25
$38,801
APPLICATIONS APPROVED, NOT ACCEPTED
3
$48,823
4
$87,400
3
$39,610
1
$11,050
0
$0
4
$87,400
APPLICATIONS DENIED
4
$93,272
36
$45,714
28
$70,176
18
$30,937
3
$14,740
11
$67,331
APPLICATIONS WITHDRAWN
0
$0
3
$56,653
23
$77,861
3
$8,750
0
$0
0
$0
FILES CLOSED FOR INCOMPLETENESS
0
$0
0
$0
1
$131,270
0
$0
0
$0
0
$0
Aggregated Statistics For Year 2007 (Based on 2 partial tracts)
A) FHA, FSA/RHS & VA Home Purchase Loans
B) Conventional Home Purchase Loans
C) Refinancings
D) Home Improvement Loans
F) Non-occupant Loans on < 5 Family Dwellings (A B C & D)
G) Loans On Manufactured Home Dwelling (A B C & D)
Number
Average Value
Number
Average Value
Number
Average Value
Number
Average Value
Number
Average Value
Number
Average Value
LOANS ORIGINATED
19
$70,326
46
$56,383
55
$49,569
14
$39,381
21
$30,334
14
$52,311
APPLICATIONS APPROVED, NOT ACCEPTED
3
$40,533
15
$71,853
6
$60,108
3
$32,243
0
$0
12
$65,290
APPLICATIONS DENIED
4
$156,835
25
$57,649
47
$82,702
18
$26,561
0
$0
19
$50,617
APPLICATIONS WITHDRAWN
0
$0
6
$58,957
18
$68,092
4
$83,945
4
$44,908
0
$0
FILES CLOSED FOR INCOMPLETENESS
1
$204,510
1
$62,180
7
$88,040
0
$0
1
$62,180
1
$204,510
Aggregated Statistics For Year 2006 (Based on 2 partial tracts)
A) FHA, FSA/RHS & VA Home Purchase Loans
B) Conventional Home Purchase Loans
C) Refinancings
D) Home Improvement Loans
F) Non-occupant Loans on < 5 Family Dwellings (A B C & D)
G) Loans On Manufactured Home Dwelling (A B C & D)
Number
Average Value
Number
Average Value
Number
Average Value
Number
Average Value
Number
Average Value
Number
Average Value
LOANS ORIGINATED
10
$58,588
75
$60,597
59
$55,928
30
$22,846
25
$40,570
30
$52,739
APPLICATIONS APPROVED, NOT ACCEPTED
3
$129,430
15
$54,627
12
$68,399
1
$69,090
0
$0
12
$78,878
APPLICATIONS DENIED
1
$127,130
51
$57,223
73
$61,272
36
$30,054
4
$69,435
47
$45,982
APPLICATIONS WITHDRAWN
8
$85,499
8
$69,435
33
$65,656
4
$81,180
3
$15,200
6
$50,667
FILES CLOSED FOR INCOMPLETENESS
0
$0
3
$51,587
7
$118,637
0
$0
0
$0
0
$0
Aggregated Statistics For Year 2005 (Based on 2 partial tracts)
A) FHA, FSA/RHS & VA Home Purchase Loans
B) Conventional Home Purchase Loans
C) Refinancings
D) Home Improvement Loans
F) Non-occupant Loans on < 5 Family Dwellings (A B C & D)
G) Loans On Manufactured Home Dwelling (A B C & D)
Number
Average Value
Number
Average Value
Number
Average Value
Number
Average Value
Number
Average Value
Number
Average Value
LOANS ORIGINATED
7
$63,563
32
$48,708
54
$62,258
23
$36,347
6
$45,368
18
$32,242
APPLICATIONS APPROVED, NOT ACCEPTED
0
$0
19
$65,381
7
$56,259
1
$34,550
0
$0
14
$51,719
APPLICATIONS DENIED
0
$0
28
$50,979
57
$64,823
21
$33,558
3
$22,110
23
$50,406
APPLICATIONS WITHDRAWN
0
$0
7
$85,474
41
$80,785
8
$69,609
0
$0
4
$63,218
FILES CLOSED FOR INCOMPLETENESS
0
$0
0
$0
4
$105,362
0
$0
0
$0
0
$0
Aggregated Statistics For Year 2004 (Based on 2 partial tracts)
A) FHA, FSA/RHS & VA Home Purchase Loans
B) Conventional Home Purchase Loans
C) Refinancings
D) Home Improvement Loans
F) Non-occupant Loans on < 5 Family Dwellings (A B C & D)
G) Loans On Manufactured Home Dwelling (A B C & D)
Number
Average Value
Number
Average Value
Number
Average Value
Number
Average Value
Number
Average Value
Number
Average Value
LOANS ORIGINATED
11
$74,492
68
$36,902
54
$72,544
8
$28,672
22
$31,719
23
$48,123
APPLICATIONS APPROVED, NOT ACCEPTED
1
$53,890
11
$62,935
11
$75,371
0
$0
0
$0
8
$50,090
APPLICATIONS DENIED
0
$0
33
$38,816
82
$64,422
28
$29,265
7
$43,429
33
$35,382
APPLICATIONS WITHDRAWN
3
$67,707
6
$64,023
39
$78,160
1
$96,730
1
$52,510
1
$89,820
FILES CLOSED FOR INCOMPLETENESS
0
$0
0
$0
4
$63,908
0
$0
0
$0
0
$0
Aggregated Statistics For Year 2003 (Based on 2 partial tracts)
A) FHA, FSA/RHS & VA Home Purchase Loans
B) Conventional Home Purchase Loans
C) Refinancings
D) Home Improvement Loans
F) Non-occupant Loans on < 5 Family Dwellings (A B C & D)
Number
Average Value
Number
Average Value
Number
Average Value
Number
Average Value
Number
Average Value
LOANS ORIGINATED
6
$53,890
36
$40,034
90
$58,542
19
$20,363
17
$32,675
APPLICATIONS APPROVED, NOT ACCEPTED
0
$0
4
$60,108
21
$61,984
3
$12,897
7
$48,956
APPLICATIONS DENIED
1
$67,710
43
$45,246
95
$59,519
14
$21,911
7
$34,150
APPLICATIONS WITHDRAWN
0
$0
17
$47,144
37
$67,596
1
$15,200
1
$23,490
FILES CLOSED FOR INCOMPLETENESS
3
$71,853
3
$25,333
7
$84,881
0
$0
0
$0
Aggregated Statistics For Year 2002 (Based on 2 partial tracts)
A) FHA, FSA/RHS & VA Home Purchase Loans
B) Conventional Home Purchase Loans
C) Refinancings
D) Home Improvement Loans
F) Non-occupant Loans on < 5 Family Dwellings (A B C & D)
Number
Average Value
Number
Average Value
Number
Average Value
Number
Average Value
Number
Average Value
LOANS ORIGINATED
6
$45,368
22
$43,904
54
$79,505
7
$11,844
4
$16,928
APPLICATIONS APPROVED, NOT ACCEPTED
0
$0
12
$49,860
11
$85,295
0
$0
1
$58,040
APPLICATIONS DENIED
0
$0
15
$32,519
72
$43,220
14
$9,475
6
$18,655
APPLICATIONS WITHDRAWN
0
$0
3
$52,510
50
$49,386
1
$5,530
3
$61,720
FILES CLOSED FOR INCOMPLETENESS
0
$0
4
$19,345
10
$57,759
0
$0
0
$0
Aggregated Statistics For Year 2001 (Based on 2 partial tracts)
A) FHA, FSA/RHS & VA Home Purchase Loans
B) Conventional Home Purchase Loans
C) Refinancings
D) Home Improvement Loans
F) Non-occupant Loans on < 5 Family Dwellings (A B C & D)
Number
Average Value
Number
Average Value
Number
Average Value
Number
Average Value
Number
Average Value
LOANS ORIGINATED
1
$35,930
53
$55,350
65
$63,648
7
$21,517
6
$18,193
APPLICATIONS APPROVED, NOT ACCEPTED
0
$0
23
$45,840
19
$49,091
4
$11,745
0
$0
APPLICATIONS DENIED
4
$60,800
50
$44,162
69
$53,049
8
$14,336
4
$16,235
APPLICATIONS WITHDRAWN
1
$23,490
11
$53,765
58
$49,149
7
$13,423
1
$20,730
FILES CLOSED FOR INCOMPLETENESS
0
$0
4
$23,145
6
$75,768
0
$0
0
$0
Aggregated Statistics For Year 2000 (Based on 2 partial tracts)
A) FHA, FSA/RHS & VA Home Purchase Loans
B) Conventional Home Purchase Loans
C) Refinancings
D) Home Improvement Loans
F) Non-occupant Loans on < 5 Family Dwellings (A B C & D)
Number
Average Value
Number
Average Value
Number
Average Value
Number
Average Value
Number
Average Value
LOANS ORIGINATED
6
$64,253
43
$47,624
35
$51,363
10
$17,963
7
$17,371
APPLICATIONS APPROVED, NOT ACCEPTED
3
$40,073
14
$35,434
10
$32,610
4
$16,582
1
$17,960
APPLICATIONS DENIED
7
$35,730
33
$37,937
35
$49,231
8
$13,472
3
$15,660
APPLICATIONS WITHDRAWN
0
$0
3
$30,400
18
$40,533
1
$67,710
3
$32,703
FILES CLOSED FOR INCOMPLETENESS
1
$82,910
1
$60,800
3
$20,727
0
$0
0
$0
Aggregated Statistics For Year 1999 (Based on 1 partial tract)
A) FHA, FSA/RHS & VA Home Purchase Loans
B) Conventional Home Purchase Loans
C) Refinancings
D) Home Improvement Loans
F) Non-occupant Loans on < 5 Family Dwellings (A B C & D)
Detailed PMIC statistics for the following Tracts:0104.00
2003 - 2018 National Fire Incident Reporting System (NFIRS) incidents
According to the data from the years 2003 - 2018 the average number of fires per year is 58. The highest number of fires - 96 took place in 2011, and the least - 1 in 2005. The data has a growing trend.
When looking into fire subcategories, the most incidents belonged to: Outside Fires (74.6%), and Structure Fires (13.6%).
Fire incident types reported to NFIRS in Zip Code 74035

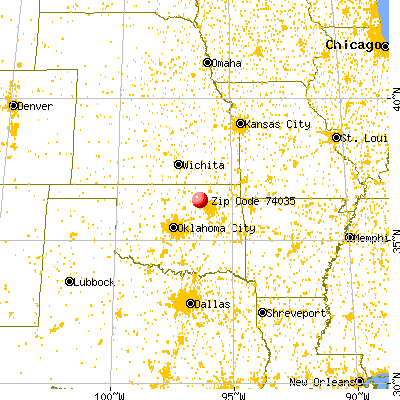


 Nearest zip codes: 74084, 74054, 74020, 74060, 74081, 74034.


 According to the data from the years 2003 - 2018 the average number of fires per year is 58. The highest number of fires - 96 took place in 2011, and the least - 1 in 2005. The data has a growing trend.
 When looking into fire subcategories, the most incidents belonged to: Outside Fires (74.6%), and Structure Fires (13.6%).