Estimated zip code population in 2022: 817 Zip code population in 2010: 860 Zip code population in 2000: 887
Houses and condos: 365 Renter-occupied apartments: 81
% of renters here:
25%
State:
35%
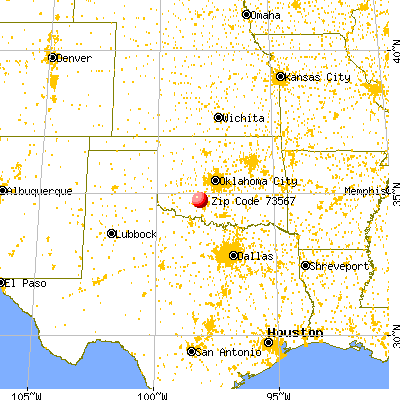
March 2022 cost of living index in zip code 73567: 78.0 (low, U.S. average is 100)
Land area: 4.6 sq. mi. Water area: 0.0 sq. mi.
Population density: 177 people per square mile
(very low).
OSM Map
General Map
Google Map
MSN Map
OSM Map
General Map
Google Map
MSN Map
OSM Map
General Map
Google Map
MSN Map
OSM Map
General Map
Google Map
MSN Map
Please wait while loading the map...
Real estate property taxes paid for housing units in 2022:
This zip code:
0.6% ($748)
Oklahoma:
0.8% ($1,501)
Median real estate property taxes paid for housing units with mortgages in 2022: $1,174 (0.7%) Median real estate property taxes paid for housing units with no mortgage in 2022: $659 (0.5%)
Business Search- 14 Million verified businesses
Males: 373
(45.7%)
Females: 443
(54.3%)
For population 25 years and over in 73567:
High school or higher: 91.7%
Bachelor's degree or higher: 7.5%
Graduate or professional degree: 3.2%
Unemployed: 1.7%
Mean travel time to work (commute): 29.3 minutes
For population 15 years and over in 73567:
Never married: 18.2%
Now married: 57.7%
Separated: 3.5%
Widowed: 4.3%
Divorced: 16.3%
Zip code 73567 compared to state average:
Unemployed percentage below state average.
Black race population percentage significantly below state average.
Hispanic race population percentage below state average.
Median age significantly above state average.
Foreign-born population percentage significantly below state average.
Length of stay since moving in significantly above state average.
Number of college students significantly below state average.
Percentage of population with a bachelor's degree or higher significantly below state average.
Estimated median house/condo value in 2022: $129,974
73567:
$129,974
Oklahoma:
$191,700
Median resident age:
This zip code:
46.0 years
Oklahoma median age:
37.1 years
Average household size:
This zip code:
2.4 people
Oklahoma:
2.5 people
Averages for the 2004 tax year for zip code 73567, filed in 2005:
Average Adjusted Gross Income (AGI) in 2004: $31,617 (Individual Income Tax Returns)
Here:
$31,617
State:
$41,245
Salary/wage: $30,459 (reported on 82.3% of returns)
Here:
$30,459
State:
$35,318
(% of AGI for various income ranges: 80.1% for AGIs below $10k, 73.3% for AGIs $10k-25k, 79.0% for AGIs $25k-50k, 87.5% for AGIs $50k-75k, 69.4% for AGIs $75k-100k)
Taxable interest for individuals: $800 (reported on 40.8% of returns)
This zip code:
$800
Oklahoma:
$1,745
(% of AGI for various income ranges: 2.5% for AGIs below $10k, 3.9% for AGIs $10k-25k, 0.7% for AGIs $25k-50k, 0.2% for AGIs $50k-75k, 0.1% for AGIs $75k-100k)
Taxable dividends: $212 (reported on 9.0% of returns)
Here:
$212
State:
$2,920
Net capital gain/loss: +$409 (reported on 6.0% of returns)
Here:
+$409
State:
+$10,653
Profit/loss from business: +$2,500 (reported on 14.1% of returns)
Here:
+$2,500
State:
+$8,532
(% of AGI for various income ranges: 11.7% for AGIs below $10k, 3.5% for AGIs $10k-25k, 0.2% for AGIs $25k-50k, 0.3% for AGIs $50k-75k)
Total itemized deductions: $14,023 (27% of AGI, reported on 23.6% of returns)
Here:
$14,023
State:
$17,093
Here:
26.7% of AGI
State:
20.5% of AGI
(% of AGI for various income ranges: 12.5% for AGIs $10k-25k, 8.4% for AGIs $25k-50k, 10.7% for AGIs $50k-75k, 14.2% for AGIs $75k-100k)
Charity contributions deductions: $2,485 (5% of AGI, reported on 18.5% of returns)
Here:
$2,485
State:
$4,240
Here:
4.8% of AGI
State:
4.8% of AGI
(% of AGI for various income ranges: 2.0% for AGIs $10k-25k, 1.3% for AGIs $25k-50k, 1.7% for AGIs $50k-75k, 1.1% for AGIs $75k-100k)
Total tax: $3,047 (reported on 69.6% of returns)
73567:
$3,047
State:
$6,542
(% of AGI for various income ranges: 2.2% for AGIs below $10k, 3.5% for AGIs $10k-25k, 5.6% for AGIs $25k-50k, 8.2% for AGIs $50k-75k, 10.0% for AGIs $75k-100k)
Earned income credit: $1,862 (reported on 23.6% of returns)
Here:
$1,862
State:
$1,830
Percentage of individuals using paid preparers for their 2004 taxes: 62.5%
Here:
62%
State:
63%
(% for various income ranges: 54.7% for AGIs below $10k, 65.5% for AGIs $10k-25k, 59.4% for AGIs $25k-50k, 68.3% for AGIs $50k-75k, 73.7% for AGIs $75k-100k)
Household received Food Stamps/SNAP in the past 12 months: 71 Household did not receive Food Stamps/SNAP in the past 12 months: 266
Women who did not have a birth in the past 12 months: 186 (76 now married, 110 unmarried)
Housing units in zip code 73567 with a mortgage: 96 (4 second mortgage, 4 both second mortgage and home equity loan) Median monthly owner costs for units with a mortgage: $1,006 Median monthly owner costs for units without a mortgage: $386
Residents with income below the poverty level in 2022:
This zip code:
13.7%
Whole state:
15.7%
Residents with income below 50% of the poverty level in 2022:
This zip code:
5.0%
Whole state:
8.3%
Median number of rooms in houses and condos:
Here:
5.4
State:
6.1
Median number of rooms in apartments:
Here:
4.0
State:
4.5
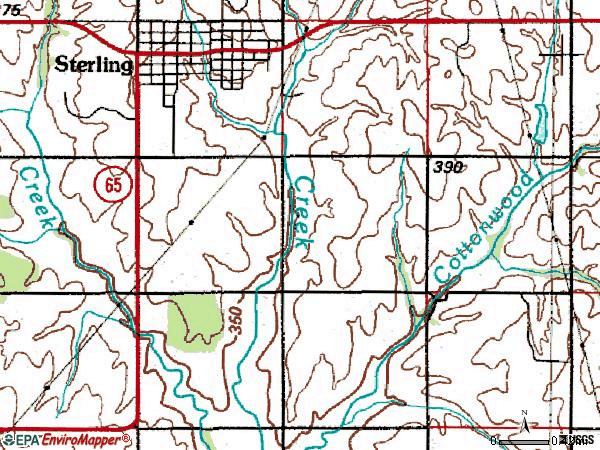
Notable locations in this zip code not listed on our city pages
Size of family households: 151 2-persons, 76 3-persons, 50 4-persons
Size of nonfamily households: 52 1-person, 5 2-persons
82 married couples with children.
92 single-parent households (16 men, 76 women).
98.1% of residents of 73567 zip code speak English at home.
1.9% of residents speak Spanish at home (100% very well).
Foreign born population: 9 (1.2%) (100.0% of them are naturalized citizens)
This zip code:
1.2%
Whole state:
6.0%
111%Honduras
27%Irish
26%American
8%English
8%French
8%German
1%Norwegian
Year of entry for the foreign-born population
02010 or later
02000 to 2009
91990 to 1999
12Before 1990
Housing units lacking complete plumbing facilities: 2.1% Housing units lacking complete kitchen facilities: 3.1%
59.9%Utility gas
34.7%Electricity
5.9%No fuel used
Place of birth for U.S.-born residents:
This state: 536
Northeast: 2
Midwest: 20
South: 183
West: 49
57% of the 73567 zip code residents lived in the same house 5 years ago. Out of people who lived in different houses, 59% lived in this county. Out of people who lived in different counties, 50% lived in Oklahoma.
88% of the 73567 zip code residents lived in the same house 1 year ago. Out of people who lived in different houses, 55% moved from this county. Out of people who lived in different houses, 22% moved from different county within same state. Out of people who lived in different houses, 19% moved from different state.
Private vs. public school enrollment:
Students in private schools in grades 1 to 8 (elementary and middle school):
Here:
0.0%
Oklahoma:
11.7%
Students in private schools in grades 9 to 12 (high school): 47
Here:
65.4%
Oklahoma:
11.7%
Occupation by median earnings in the past 12 months ($)
79,688Construction and extraction occupations
65,198Transportation occupations
45,283Office and administrative support occupations
43,316Management occupations
27,969Production occupations
24,271Sales and related occupations
Companies with federal contracts located in this zip code:
CHARLES HALE (320 WESTCAMPBELL in STERLING, OK; small business) : $474,489 in 4 contractsfrom 2001 to 2002
$408,935 with Army for Maintenance, Repair and Rebuilding of Equipment -- Alarm, Signal, and Security Detection Systems. Signed on 2001-09-24. Completion date: 2002-03-21.
$51,772 with Army for Maintenance, Repair or Alteration of Real Property -- Dining Facilities. Signed on 2002-06-04. Completion date: 2002-08-29.
$15,516, same as above.Signed on 2002-06-19. Completion date: 2002-08-29.
-$1,734 with Army for Maintenance, Repair and Rebuilding of Equipment -- Alarm, Signal, and Security Detection Systems. Signed on 2002-02-07. Completion date: 2002-03-21.
Top industries in this zip code by the number of employees in 2005:
Other Services (except Public Administration): Religious Organizations (5-9 employees: 2 establishments)
Accommodation and Food Services: Full-Service Restaurants (1-4: 1)
Other Services (except Public Administration): Other Similar Organizations (except Business, Professional, Labor, and Political Organizations) (1-4: 1)
Professional, Scientific, and Technical Services: Marketing Consulting Services (1-4: 1)
Information: Cable and Other Subscription Programming (1-4: 1)
Construction: Electrical Contractors (1-4: 1)
Home Mortgage Disclosure Act Aggregated Statistics For Year 2009 (Based on 2 partial tracts)
A) FHA, FSA/RHS & VA Home Purchase Loans
B) Conventional Home Purchase Loans
C) Refinancings
D) Home Improvement Loans
F) Non-occupant Loans on < 5 Family Dwellings (A B C & D)
G) Loans On Manufactured Home Dwelling (A B C & D)
Number
Average Value
Number
Average Value
Number
Average Value
Number
Average Value
Number
Average Value
Number
Average Value
LOANS ORIGINATED
14
$167,675
4
$122,715
15
$136,966
2
$42,015
2
$71,785
2
$32,930
APPLICATIONS APPROVED, NOT ACCEPTED
0
$0
1
$69,380
1
$72,290
0
$0
0
$0
0
$0
APPLICATIONS DENIED
1
$151,500
1
$56,020
4
$151,830
0
$0
0
$0
1
$42,270
APPLICATIONS WITHDRAWN
1
$172,190
0
$0
2
$163,955
0
$0
0
$0
0
$0
FILES CLOSED FOR INCOMPLETENESS
0
$0
0
$0
1
$126,400
0
$0
0
$0
0
$0
Aggregated Statistics For Year 2008 (Based on 2 partial tracts)
A) FHA, FSA/RHS & VA Home Purchase Loans
B) Conventional Home Purchase Loans
C) Refinancings
D) Home Improvement Loans
F) Non-occupant Loans on < 5 Family Dwellings (A B C & D)
G) Loans On Manufactured Home Dwelling (A B C & D)
Number
Average Value
Number
Average Value
Number
Average Value
Number
Average Value
Number
Average Value
Number
Average Value
LOANS ORIGINATED
9
$154,359
5
$105,520
11
$90,907
3
$36,713
4
$78,188
2
$45,280
APPLICATIONS APPROVED, NOT ACCEPTED
0
$0
1
$46,590
1
$62,250
0
$0
0
$0
0
$0
APPLICATIONS DENIED
1
$82,330
2
$128,410
5
$121,524
2
$79,970
0
$0
1
$75,000
APPLICATIONS WITHDRAWN
0
$0
0
$0
2
$120,230
0
$0
0
$0
0
$0
FILES CLOSED FOR INCOMPLETENESS
0
$0
0
$0
0
$0
0
$0
0
$0
0
$0
Aggregated Statistics For Year 2007 (Based on 2 partial tracts)
A) FHA, FSA/RHS & VA Home Purchase Loans
B) Conventional Home Purchase Loans
C) Refinancings
D) Home Improvement Loans
F) Non-occupant Loans on < 5 Family Dwellings (A B C & D)
G) Loans On Manufactured Home Dwelling (A B C & D)
Number
Average Value
Number
Average Value
Number
Average Value
Number
Average Value
Number
Average Value
Number
Average Value
LOANS ORIGINATED
7
$132,241
8
$123,329
8
$92,644
2
$53,965
2
$57,230
1
$96,080
APPLICATIONS APPROVED, NOT ACCEPTED
0
$0
1
$64,860
1
$116,660
0
$0
0
$0
0
$0
APPLICATIONS DENIED
0
$0
2
$57,630
5
$109,718
2
$44,375
0
$0
1
$69,280
APPLICATIONS WITHDRAWN
1
$115,260
1
$125,700
3
$132,997
1
$55,420
1
$54,520
0
$0
FILES CLOSED FOR INCOMPLETENESS
0
$0
0
$0
0
$0
0
$0
0
$0
0
$0
Aggregated Statistics For Year 2006 (Based on 2 partial tracts)
A) FHA, FSA/RHS & VA Home Purchase Loans
B) Conventional Home Purchase Loans
C) Refinancings
D) Home Improvement Loans
F) Non-occupant Loans on < 5 Family Dwellings (A B C & D)
G) Loans On Manufactured Home Dwelling (A B C & D)
Number
Average Value
Number
Average Value
Number
Average Value
Number
Average Value
Number
Average Value
Number
Average Value
LOANS ORIGINATED
5
$135,982
10
$79,908
9
$68,461
2
$23,845
1
$79,420
2
$62,300
APPLICATIONS APPROVED, NOT ACCEPTED
0
$0
1
$53,910
2
$59,840
1
$18,770
0
$0
1
$30,120
APPLICATIONS DENIED
0
$0
3
$68,873
8
$92,205
3
$41,667
0
$0
2
$54,565
APPLICATIONS WITHDRAWN
0
$0
1
$150,400
4
$80,848
0
$0
0
$0
0
$0
FILES CLOSED FOR INCOMPLETENESS
0
$0
0
$0
1
$91,670
0
$0
0
$0
0
$0
Aggregated Statistics For Year 2005 (Based on 2 partial tracts)
A) FHA, FSA/RHS & VA Home Purchase Loans
B) Conventional Home Purchase Loans
C) Refinancings
D) Home Improvement Loans
F) Non-occupant Loans on < 5 Family Dwellings (A B C & D)
G) Loans On Manufactured Home Dwelling (A B C & D)
Number
Average Value
Number
Average Value
Number
Average Value
Number
Average Value
Number
Average Value
Number
Average Value
LOANS ORIGINATED
4
$120,128
7
$87,233
9
$73,102
2
$31,725
1
$55,120
1
$95,680
APPLICATIONS APPROVED, NOT ACCEPTED
0
$0
1
$31,630
1
$112,650
0
$0
0
$0
0
$0
APPLICATIONS DENIED
1
$54,720
2
$82,630
7
$67,497
3
$32,630
1
$42,170
2
$49,545
APPLICATIONS WITHDRAWN
0
$0
1
$79,010
5
$94,416
1
$59,640
0
$0
0
$0
FILES CLOSED FOR INCOMPLETENESS
0
$0
1
$47,690
2
$83,430
0
$0
0
$0
0
$0
Aggregated Statistics For Year 2004 (Based on 2 partial tracts)
A) FHA, FSA/RHS & VA Home Purchase Loans
B) Conventional Home Purchase Loans
C) Refinancings
D) Home Improvement Loans
F) Non-occupant Loans on < 5 Family Dwellings (A B C & D)
G) Loans On Manufactured Home Dwelling (A B C & D)
Number
Average Value
Number
Average Value
Number
Average Value
Number
Average Value
Number
Average Value
Number
Average Value
LOANS ORIGINATED
3
$99,797
5
$73,614
9
$79,930
2
$28,265
2
$43,875
2
$58,535
APPLICATIONS APPROVED, NOT ACCEPTED
0
$0
1
$54,720
1
$109,440
1
$16,470
0
$0
0
$0
APPLICATIONS DENIED
0
$0
4
$73,592
6
$57,847
2
$10,895
1
$16,670
1
$63,150
APPLICATIONS WITHDRAWN
0
$0
0
$0
4
$69,378
0
$0
0
$0
0
$0
FILES CLOSED FOR INCOMPLETENESS
0
$0
0
$0
1
$87,450
0
$0
0
$0
0
$0
Aggregated Statistics For Year 2003 (Based on 2 partial tracts)
A) FHA, FSA/RHS & VA Home Purchase Loans
B) Conventional Home Purchase Loans
C) Refinancings
D) Home Improvement Loans
F) Non-occupant Loans on < 5 Family Dwellings (A B C & D)
Number
Average Value
Number
Average Value
Number
Average Value
Number
Average Value
Number
Average Value
LOANS ORIGINATED
3
$103,780
6
$53,295
15
$83,305
1
$21,590
3
$37,350
APPLICATIONS APPROVED, NOT ACCEPTED
0
$0
1
$30,920
1
$114,260
0
$0
0
$0
APPLICATIONS DENIED
0
$0
2
$55,925
5
$67,530
1
$7,530
0
$0
APPLICATIONS WITHDRAWN
0
$0
1
$92,770
4
$80,648
0
$0
1
$56,120
FILES CLOSED FOR INCOMPLETENESS
0
$0
1
$56,630
1
$71,080
0
$0
0
$0
Aggregated Statistics For Year 2002 (Based on 2 partial tracts)
A) FHA, FSA/RHS & VA Home Purchase Loans
B) Conventional Home Purchase Loans
C) Refinancings
D) Home Improvement Loans
F) Non-occupant Loans on < 5 Family Dwellings (A B C & D)
Number
Average Value
Number
Average Value
Number
Average Value
Number
Average Value
Number
Average Value
LOANS ORIGINATED
2
$75,050
6
$57,713
10
$64,617
2
$19,580
3
$38,720
APPLICATIONS APPROVED, NOT ACCEPTED
0
$0
1
$37,050
2
$58,330
0
$0
0
$0
APPLICATIONS DENIED
1
$35,040
3
$39,927
6
$56,040
1
$10,440
1
$19,380
APPLICATIONS WITHDRAWN
0
$0
1
$21,690
3
$69,577
0
$0
0
$0
FILES CLOSED FOR INCOMPLETENESS
0
$0
0
$0
0
$0
0
$0
0
$0
Aggregated Statistics For Year 2001 (Based on 2 partial tracts)
A) FHA, FSA/RHS & VA Home Purchase Loans
B) Conventional Home Purchase Loans
C) Refinancings
D) Home Improvement Loans
F) Non-occupant Loans on < 5 Family Dwellings (A B C & D)
Number
Average Value
Number
Average Value
Number
Average Value
Number
Average Value
Number
Average Value
LOANS ORIGINATED
2
$81,875
5
$61,946
8
$69,590
1
$16,670
1
$61,950
APPLICATIONS APPROVED, NOT ACCEPTED
0
$0
1
$29,320
1
$37,750
1
$14,460
0
$0
APPLICATIONS DENIED
0
$0
4
$35,892
4
$72,138
1
$18,070
0
$0
APPLICATIONS WITHDRAWN
0
$0
1
$32,630
4
$66,138
0
$0
0
$0
FILES CLOSED FOR INCOMPLETENESS
0
$0
0
$0
1
$27,610
0
$0
0
$0
Aggregated Statistics For Year 2000 (Based on 2 partial tracts)
A) FHA, FSA/RHS & VA Home Purchase Loans
B) Conventional Home Purchase Loans
C) Refinancings
D) Home Improvement Loans
F) Non-occupant Loans on < 5 Family Dwellings (A B C & D)
Number
Average Value
Number
Average Value
Number
Average Value
Number
Average Value
Number
Average Value
LOANS ORIGINATED
2
$86,895
7
$53,327
4
$51,605
3
$14,357
1
$28,410
APPLICATIONS APPROVED, NOT ACCEPTED
0
$0
2
$46,285
1
$47,690
0
$0
0
$0
APPLICATIONS DENIED
0
$0
5
$47,810
2
$42,820
1
$19,980
0
$0
APPLICATIONS WITHDRAWN
0
$0
1
$36,340
1
$87,650
0
$0
0
$0
FILES CLOSED FOR INCOMPLETENESS
0
$0
0
$0
0
$0
0
$0
0
$0
Aggregated Statistics For Year 1999 (Based on 1 partial tract)
A) FHA, FSA/RHS & VA Home Purchase Loans
B) Conventional Home Purchase Loans
C) Refinancings
D) Home Improvement Loans
F) Non-occupant Loans on < 5 Family Dwellings (A B C & D)


 Nearest zip codes: 73541, 73538, 73029, 73017, 73501, 73082.


 : $474,489 in 4 contracts from 2001 to 2002


