Estimated zip code population in 2022: 20,514 Zip code population in 2010: 18,595 Zip code population in 2000: 17,822
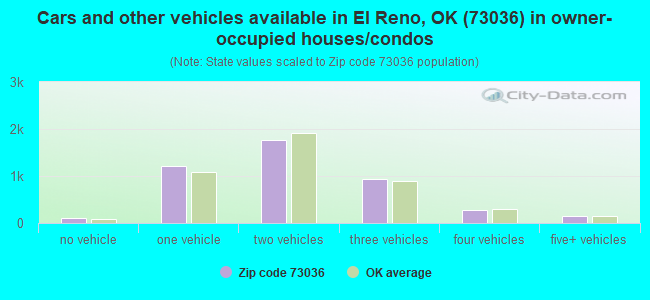
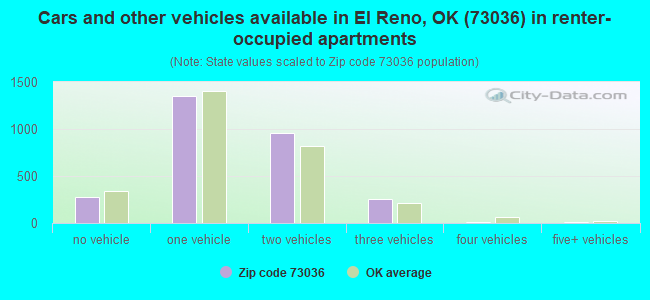
Houses and condos: 8,000 Renter-occupied apartments: 2,866
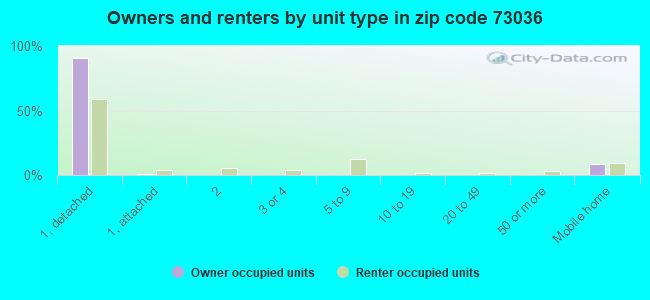
% of renters here:
39%
State:
35%
March 2022 cost of living index in zip code 73036: 84.7 (less than average, U.S. average is 100)
Land area: 183.3 sq. mi. Water area: 1.2 sq. mi.
Population density: 112 people per square mile
(very low).
OSM Map
General Map
Google Map
MSN Map
OSM Map
General Map
Google Map
MSN Map
OSM Map
General Map
Google Map
MSN Map
OSM Map
General Map
Google Map
MSN Map
Please wait while loading the map...
Real estate property taxes paid for housing units in 2022:
This zip code:
0.8% ($1,371)
Oklahoma:
0.8% ($1,501)
Median real estate property taxes paid for housing units with mortgages in 2022: $1,604 (0.9%) Median real estate property taxes paid for housing units with no mortgage in 2022: $958 (0.7%)
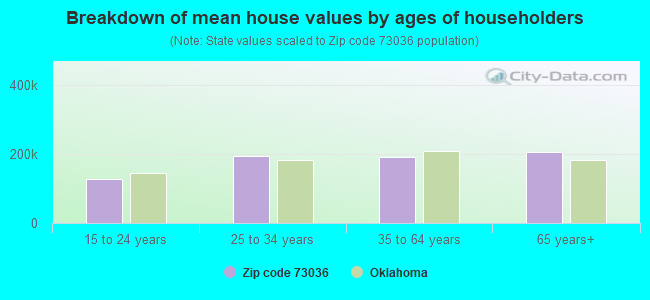
Estimated median house/condo value in 2022: $169,326
73036:
$169,326
Oklahoma:
$191,700
According to our research of Oklahoma and other state lists, there were 49 registered sex offenders living in 73036 zip code as of May 17, 2024. The ratio of all residents to sex offenders in zip code 73036 is 420 to 1. The ratio of registered sex offenders to all residents in this zip code is near the state average.
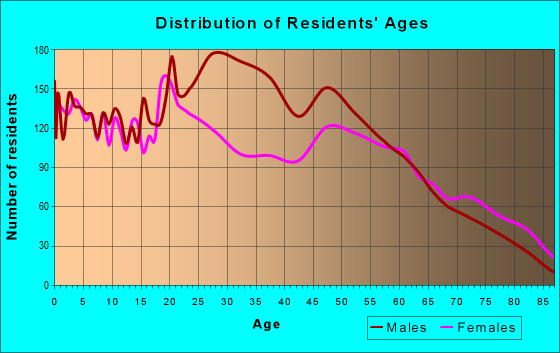
Median resident age:
This zip code:
36.3 years
Oklahoma median age:
37.1 years
Average household size:
This zip code:
2.6 people
Oklahoma:
2.5 people
Averages for the 2020 tax year for zip code 73036, filed in 2021:
Average Adjusted Gross Income (AGI) in 2020: $54,795 (Individual Income Tax Returns)
Here:
$54,795
State:
$63,060
Salary/wage: $43,805 (reported on 83.1% of returns)
Here:
$43,805
State:
$52,427
(% of AGI for various income ranges: 1123.4% for AGIs below $25k, 3514.5% for AGIs $25k-50k, 6532.6% for AGIs $50k-75k, 9666.9% for AGIs $75k-100k, 17443.7% for AGIs $100k-200k, 52330.0% for AGIs over 200k)
Taxable interest for individuals: $1,293 (reported on 24.6% of returns)
This zip code:
$1,293
Oklahoma:
$1,603
(% of AGI for various income ranges: 12.4% for AGIs below $25k, 14.6% for AGIs $25k-50k, 26.6% for AGIs $50k-75k, 49.3% for AGIs $75k-100k, 172.1% for AGIs $100k-200k, 1586.0% for AGIs over 200k)
Ordinary dividends: $3,412 (reported on 10.3% of returns)
Here:
$3,412
State:
$7,001
(% of AGI for various income ranges: 10.1% for AGIs below $25k, 16.4% for AGIs $25k-50k, 53.6% for AGIs $50k-75k, 38.3% for AGIs $75k-100k, 157.2% for AGIs $100k-200k, 1894.0% for AGIs over 200k)
Net capital gain/loss in AGI: +$15,704 (reported on 10.2% of returns)
Here:
+$15,704
State:
+$19,855
(% of AGI for various income ranges: 12.2% for AGIs below $25k, 15.1% for AGIs $25k-50k, 90.6% for AGIs $50k-75k, 86.2% for AGIs $75k-100k, 520.9% for AGIs $100k-200k, 17288.0% for AGIs over 200k)
Profit/loss from business: +$8,934 (reported on 14.7% of returns)
Here:
+$8,934
State:
+$9,904
(% of AGI for various income ranges: 88.6% for AGIs below $25k, 85.5% for AGIs $25k-50k, 151.4% for AGIs $50k-75k, 174.8% for AGIs $75k-100k, 575.6% for AGIs $100k-200k, 4692.0% for AGIs over 200k)
Taxable individual retirement arrangement distribution: $15,843 (reported on 6.0% of returns)
73036:
$15,843
Oklahoma:
$20,476
(% of AGI for various income ranges: 27.5% for AGIs below $25k, 56.8% for AGIs $25k-50k, 131.2% for AGIs $50k-75k, 255.5% for AGIs $75k-100k, 614.7% for AGIs $100k-200k, 1922.0% for AGIs over 200k)
Total itemized deductions: $43,235 (reported on 4.7% of returns)
Here:
$43,235
State:
$39,736
(% of AGI for various income ranges: 89.8% for AGIs $25k-50k, 242.7% for AGIs $50k-75k, 300.2% for AGIs $75k-100k, 1020.9% for AGIs $100k-200k, 13242.0% for AGIs over 200k)
Charity contributions: $12,214 (reported on 3.7% of returns)
Here:
$12,214
State:
$17,288
(% of AGI for various income ranges: 13.5% for AGIs $25k-50k, 43.9% for AGIs $50k-75k, 63.6% for AGIs $75k-100k, 200.9% for AGIs $100k-200k, 3578.0% for AGIs over 200k)
Taxes paid: $6,235 (reported on 4.7% of returns)
73036:
$6,235
State:
$7,046
(% of AGI for various income ranges: 6.5% for AGIs $25k-50k, 31.6% for AGIs $50k-75k, 41.7% for AGIs $75k-100k, 215.6% for AGIs $100k-200k, 1630.0% for AGIs over 200k)
Earned income credit: $2,492 (reported on 21.8% of returns)
Here:
$2,492
State:
$2,435
(% of AGI for various income ranges: 116.1% for AGIs below $25k, 93.5% for AGIs $25k-50k, 1.8% for AGIs $50k-75k)
Percentage of individuals using paid preparers for their 2020 taxes: 94.2%
Here:
94%
State:
94%
(% for various income ranges: 93.5% for AGIs below $25k, 94.7% for AGIs $25k-50k, 94.2% for AGIs $50k-75k, 93.8% for AGIs $75k-100k, 95.1% for AGIs $100k-200k, 95.0% for AGIs over 200k)
Averages for the 2012 tax year for zip code 73036, filed in 2013:
Average Adjusted Gross Income (AGI) in 2012: $50,416 (Individual Income Tax Returns)
Here:
$50,416
State:
$58,581
Salary/wage: $39,924 (reported on 84.1% of returns)
Here:
$39,924
State:
$45,973
(% of AGI for various income ranges: 76.2% for AGIs below $25k, 81.8% for AGIs $25k-50k, 78.5% for AGIs $50k-75k, 76.2% for AGIs $75k-100k, 67.1% for AGIs $100k-200k, 26.5% for AGIs over 200k)
Taxable interest for individuals: $1,436 (reported on 27.9% of returns)
This zip code:
$1,436
Oklahoma:
$1,625
(% of AGI for various income ranges: 1.0% for AGIs below $25k, 0.6% for AGIs $25k-50k, 0.6% for AGIs $50k-75k, 0.8% for AGIs $75k-100k, 0.8% for AGIs $100k-200k, 1.2% for AGIs over 200k)
Ordinary dividends: $3,540 (reported on 11.9% of returns)
Here:
$3,540
State:
$6,374
(% of AGI for various income ranges: 0.9% for AGIs below $25k, 0.7% for AGIs $25k-50k, 0.4% for AGIs $50k-75k, 0.3% for AGIs $75k-100k, 0.7% for AGIs $100k-200k, 1.9% for AGIs over 200k)
Net capital gain/loss in AGI: +$21,509 (reported on 9.3% of returns)
Here:
+$21,509
State:
+$24,023
(% of AGI for various income ranges: 0.2% for AGIs $25k-50k, 0.5% for AGIs $50k-75k, 1.1% for AGIs $75k-100k, 3.3% for AGIs $100k-200k, 16.3% for AGIs over 200k)
Profit/loss from business: +$12,016 (reported on 14.6% of returns)
Here:
+$12,016
State:
+$11,913
(% of AGI for various income ranges: 6.8% for AGIs below $25k, 1.8% for AGIs $25k-50k, 2.2% for AGIs $50k-75k, 3.9% for AGIs $75k-100k, 3.1% for AGIs $100k-200k, 4.8% for AGIs over 200k)
Taxable individual retirement arrangement distribution: $11,683 (reported on 7.5% of returns)
73036:
$11,683
Oklahoma:
$15,242
(% of AGI for various income ranges: 2.2% for AGIs below $25k, 1.3% for AGIs $25k-50k, 1.6% for AGIs $50k-75k, 1.7% for AGIs $75k-100k, 2.6% for AGIs $100k-200k, 1.3% for AGIs over 200k)
Total itemized deductions: $24,477 (22% of AGI, reported on 20.9% of returns)
Here:
$24,477
State:
$24,882
Here:
22.2% of AGI
State:
18.8% of AGI
(% of AGI for various income ranges: 5.7% for AGIs below $25k, 5.9% for AGIs $25k-50k, 8.0% for AGIs $50k-75k, 9.5% for AGIs $75k-100k, 12.3% for AGIs $100k-200k, 17.3% for AGIs over 200k)
Charity contributions: $5,175 (reported on 15.6% of returns)
Here:
$5,175
State:
$6,591
(% of AGI for various income ranges: 0.7% for AGIs below $25k, 0.9% for AGIs $25k-50k, 1.2% for AGIs $50k-75k, 1.6% for AGIs $75k-100k, 2.6% for AGIs $100k-200k, 2.2% for AGIs over 200k)
Taxes paid: $5,361 (reported on 20.8% of returns)
73036:
$5,361
State:
$7,196
(% of AGI for various income ranges: 0.6% for AGIs below $25k, 0.9% for AGIs $25k-50k, 1.6% for AGIs $50k-75k, 2.4% for AGIs $75k-100k, 3.7% for AGIs $100k-200k, 3.3% for AGIs over 200k)
Earned income credit: $2,233 (reported on 23.2% of returns)
Here:
$2,233
State:
$2,354
(% of AGI for various income ranges: 7.6% for AGIs below $25k, 1.3% for AGIs $25k-50k)
Percentage of individuals using paid preparers for their 2012 taxes: 59.6%
Here:
60%
State:
56%
(% for various income ranges: 55.5% for AGIs below $25k, 57.0% for AGIs $25k-50k, 62.1% for AGIs $50k-75k, 63.3% for AGIs $75k-100k, 73.2% for AGIs $100k-200k, 86.7% for AGIs over 200k)
Averages for the 2004 tax year for zip code 73036, filed in 2005:
Average Adjusted Gross Income (AGI) in 2004: $34,637 (Individual Income Tax Returns)
Here:
$34,637
State:
$41,245
Salary/wage: $30,501 (reported on 82.4% of returns)
Here:
$30,501
State:
$35,318
(% of AGI for various income ranges: 127.4% for AGIs below $10k, 77.5% for AGIs $10k-25k, 78.9% for AGIs $25k-50k, 78.6% for AGIs $50k-75k, 74.0% for AGIs $75k-100k, 47.4% for AGIs over 100k)
Taxable interest for individuals: $1,598 (reported on 36.5% of returns)
This zip code:
$1,598
Oklahoma:
$1,745
(% of AGI for various income ranges: 4.5% for AGIs below $10k, 2.2% for AGIs $10k-25k, 1.4% for AGIs $25k-50k, 1.0% for AGIs $50k-75k, 1.0% for AGIs $75k-100k, 2.6% for AGIs over 100k)
Taxable dividends: $1,513 (reported on 15.8% of returns)
Here:
$1,513
State:
$2,920
(% of AGI for various income ranges: 2.6% for AGIs below $10k, 0.6% for AGIs $10k-25k, 0.5% for AGIs $25k-50k, 0.4% for AGIs $50k-75k, 0.8% for AGIs $75k-100k, 1.1% for AGIs over 100k)
Net capital gain/loss: +$7,290 (reported on 14.1% of returns)
Here:
+$7,290
State:
+$10,653
(% of AGI for various income ranges: 0.7% for AGIs below $10k, 0.3% for AGIs $10k-25k, 0.6% for AGIs $25k-50k, 1.1% for AGIs $50k-75k, 1.9% for AGIs $75k-100k, 11.2% for AGIs over 100k)
Profit/loss from business: +$6,492 (reported on 15.1% of returns)
Here:
+$6,492
State:
+$8,532
(% of AGI for various income ranges: -1.5% for AGIs below $10k, 3.6% for AGIs $10k-25k, 2.0% for AGIs $25k-50k, 2.6% for AGIs $50k-75k, 3.3% for AGIs $75k-100k, 3.9% for AGIs over 100k)
IRA payment deduction: $3,296 (reported on 2.3% of returns)
73036:
$3,296
Oklahoma:
$3,127
(% of AGI for various income ranges: 0.2% for AGIs $10k-25k, 0.2% for AGIs $25k-50k, 0.2% for AGIs $50k-75k, 0.3% for AGIs $75k-100k, 0.2% for AGIs over 100k)
Total itemized deductions: $14,497 (22% of AGI, reported on 26.2% of returns)
Here:
$14,497
State:
$17,093
Here:
21.7% of AGI
State:
20.5% of AGI
(% of AGI for various income ranges: 15.1% for AGIs below $10k, 5.8% for AGIs $10k-25k, 10.0% for AGIs $25k-50k, 11.8% for AGIs $50k-75k, 14.5% for AGIs $75k-100k, 12.2% for AGIs over 100k)
Charity contributions deductions: $3,570 (5% of AGI, reported on 21.5% of returns)
Here:
$3,570
State:
$4,240
Here:
5.1% of AGI
State:
4.8% of AGI
(% of AGI for various income ranges: 1.3% for AGIs below $10k, 1.0% for AGIs $10k-25k, 1.6% for AGIs $25k-50k, 2.3% for AGIs $50k-75k, 3.0% for AGIs $75k-100k, 3.4% for AGIs over 100k)
Total tax: $4,608 (reported on 69.9% of returns)
73036:
$4,608
State:
$6,542
(% of AGI for various income ranges: 4.7% for AGIs below $10k, 3.6% for AGIs $10k-25k, 6.1% for AGIs $25k-50k, 8.6% for AGIs $50k-75k, 10.8% for AGIs $75k-100k, 17.9% for AGIs over 100k)
Earned income credit: $1,818 (reported on 23.4% of returns)
Here:
$1,818
State:
$1,830
Percentage of individuals using paid preparers for their 2004 taxes: 67.7%
Here:
68%
State:
63%
(% for various income ranges: 60.5% for AGIs below $10k, 67.6% for AGIs $10k-25k, 69.7% for AGIs $25k-50k, 68.9% for AGIs $50k-75k, 72.8% for AGIs $75k-100k, 84.3% for AGIs over 100k)
Likely homosexual households (counted as self-reported same-sex unmarried-partner households)
Lesbian couples: 0.2% of all households
Gay men: 0.1% of all households
Household received Food Stamps/SNAP in the past 12 months: 1,118 Household did not receive Food Stamps/SNAP in the past 12 months: 6,178
Women who had a birth in the past 12 months: 199 (124 now married, 74 unmarried) Women who did not have a birth in the past 12 months: 4,791 (1,854 now married, 2,937 unmarried)
Housing units in zip code 73036 with a mortgage: 2,261 (73 second mortgage, 45 both second mortgage and home equity loan) Houses without a mortgage: 5
Median monthly owner costs for units with a mortgage: $1,364 Median monthly owner costs for units without a mortgage: $493
Residents with income below the poverty level in 2022:
This zip code:
17.7%
Whole state:
15.7%
Residents with income below 50% of the poverty level in 2022:
This zip code:
9.0%
Whole state:
8.3%
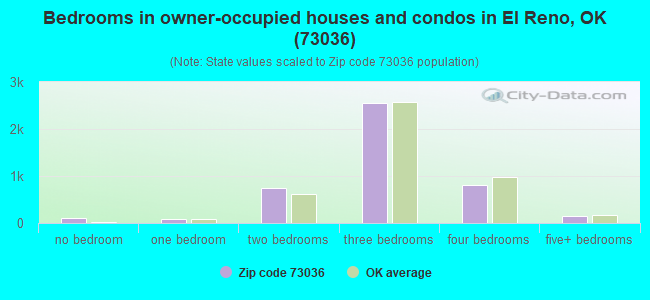
Median number of rooms in houses and condos:
Here:
5.9
State:
6.1
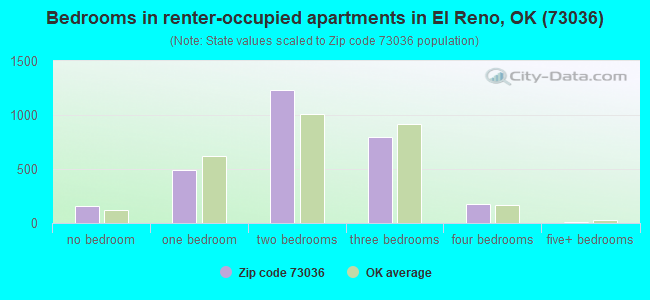
Median number of rooms in apartments:
Here:
4.5
State:
4.5
Notable locations in this zip code not listed on our city pages
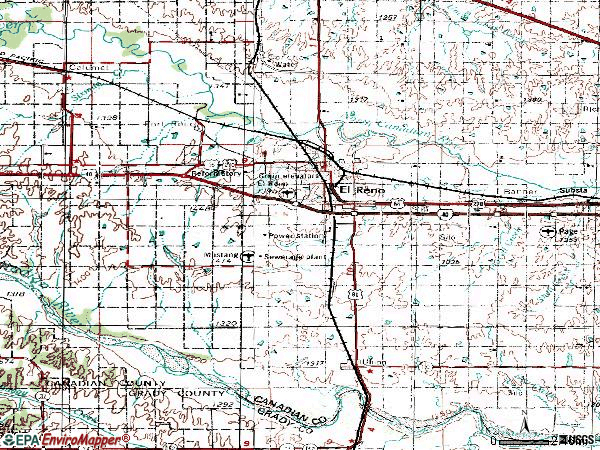
Notable locations in zip code 73036: Alfadale Stock Farms (A), Darlington State Game Bird Hatchery (B), El Reno Federal Reformatory (C), Canadian Square (D), Country Club Square (E), El Reno Fire Department (F). Display/hide their locations on the map
Churches in zip code 73036 include: Amity Church (A), Wesley United Methodist Church (B), Trinity Baptist Church (C), Sunrise Baptist Church (D), Southern Heights Baptist Church (E), Seventh Day Adventist Church (F), Sacred Heart Catholic Church (G), Reorganzied Church of Latter Day Saints (H), Pentecostal Church of God (I). Display/hide their locations on the map
Reservoirs: Lake El Reno (A), Four Mile Creek Site 1 Reservoir (B), Oknoname 017001 Reservoir (C), Wayne Reuter Reservoir (D), Lake Rolla (E), Long Pond (F), Halfway Pond (G). Display/hide their locations on the map
Parks in zip code 73036 include: Adams Park (1), Rinehart Park (2), Gadberry Park (3), Knight Park (4), Hillcrest Park (5), Dunbar Park (6). Display/hide their locations on the map
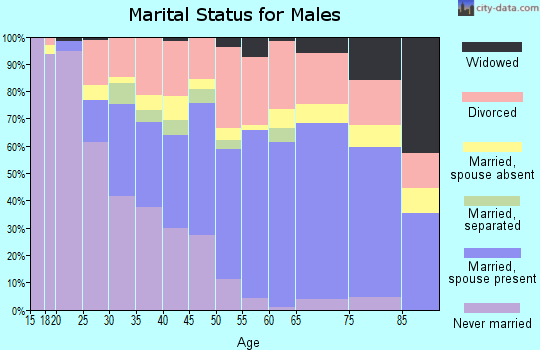
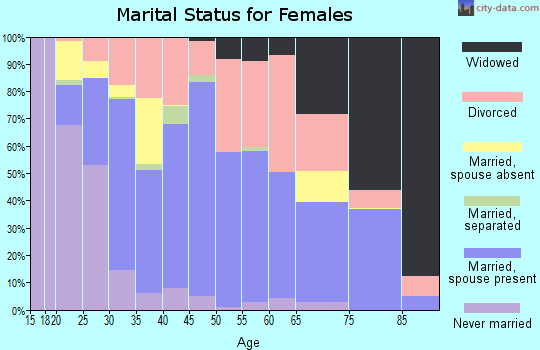
2,885 married couples with children.
1,195 single-parent households (295 men, 900 women).
90.0% of residents of 73036 zip code speak English at home.
9.2% of residents speak Spanish at home (52% very well, 19% well, 21% not well, 8% not at all).
0.2% of residents speak other Indo-European language at home (73% very well, 27% not well).
0.3% of residents speak Asian or Pacific Island language at home (86% well, 14% not well).
0.2% of residents speak other language at home (92% very well, 8% well).
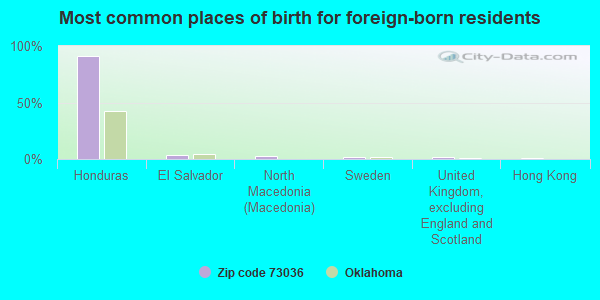
Foreign born population: 1,052 (5.1%) (40.8% of them are naturalized citizens)
This zip code:
5.1%
Whole state:
6.0%
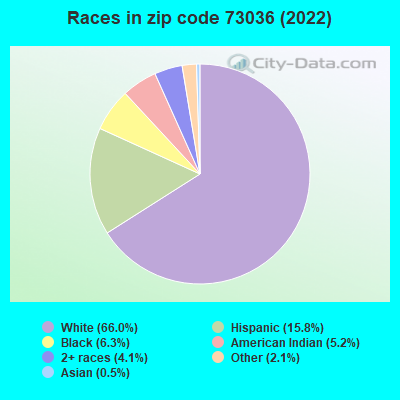
91%Honduras
4%El Salvador
3%North Macedonia (Macedonia)
2%Sweden
1%United Kingdom, excluding England and Scotland
1%Hong Kong
1%China, excluding Hong Kong and Taiwan
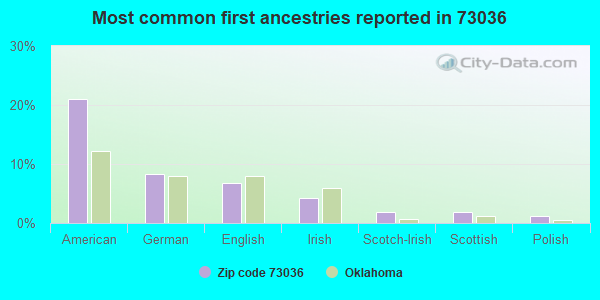
21%American
8%German
7%English
4%Irish
2%Scotch-Irish
2%Scottish
1%Polish
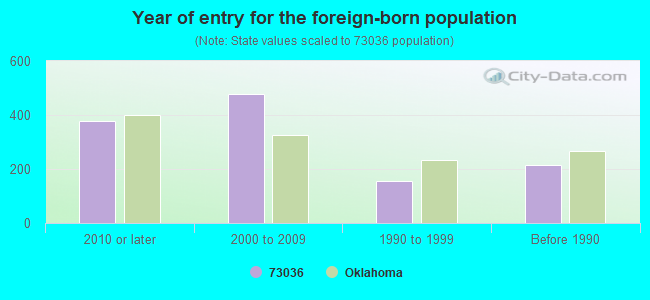
Year of entry for the foreign-born population
3782010 or later
4792000 to 2009
1571990 to 1999
213Before 1990
Major facilities with environmental interests located in this zip code:
CIMARRON AIRCRAFT CORPORATION (AIRPORT INDL. PARK in EL RENO, OK)
AIR MINOR (AIRS/AFS) CRITERIA AND HAZARDOUS AIR POLLUTANT INVENTORY (Inventory of air pollution sources) HAZARDOUS WASTE BIENNIAL REPORTER (Resource Conservation and Recovery Act (tracking hazardous waste)) Large Quantity Generators, more that 1000 kg of hazardous waste/month (Resource Conservation and Recovery Act (tracking hazardous waste)) - notification TRI REPORTER (Tracking of toxic chemicals releasing facilities) Business SIC classification: AIRCRAFT; AIRCRAFT PARTS AND AUXILIARY EQUIPMENT Alternative names: CIMARON AIRCRAFT, CIMARRON AIRCRA/AIRPORT I
GEMINI COATINGS INCORPORATED (2300 HOLLOWAY DR. in EL RENO, OK)
AIR SYNTHETIC MINOR (AIRS/AFS) COMPLIANCE ACTIVITY (Tracking inspections of insecticide, fungicide, and rodenticide, and toxic substances) CRITERIA AND HAZARDOUS AIR POLLUTANT INVENTORY (Inventory of air pollution sources) HAZARDOUS WASTE BIENNIAL REPORTER (Resource Conservation and Recovery Act (tracking hazardous waste)) Large Quantity Generators, more that 1000 kg of hazardous waste/month (Resource Conservation and Recovery Act (tracking hazardous waste)) - notification TRI REPORTER (Tracking of toxic chemicals releasing facilities) Business SIC classification: PAINTS, VARNISHES, LACQUERS, ENAMELS, AND ALLIED PRODUCTS Business NAICS classification: PAINT AND COATING MANUFACTURING. Organizations: GEMINI COATINGS, INC. (CONTACT/OPERATOR)
, GEMINI INDUSTRIES, INC. (CONTACT/OWNER)
Alternative names: GEMINI COATINGS/EL RENO P
EVANS CLEANERS (204 NORTH BICKFORD AVENUE in EL RENO, OK)
AIR MINOR (AIRS/AFS) (Resource Conservation and Recovery Act (tracking hazardous waste)) Business SIC classification: DRYCLEANING PLANTS, EXCEPT RUG CLEANING Organizations: EVANS ROBERT J (CONTACT/OWNER)
ALFADALE STOCK FARM (1200 N ALFADALE RD in EL RENO, OK)
(Integrated Compliance Information System) - ICIS-06-1999-0147, FORMAL ENFORCEMENT ACTION National Pollutant Discharge Elimination System NON-MAJOR (Tracking pollutant discharge elimination systems) - permit Business SIC classification: BEEF CATTLE FEEDLOTS; BEEF CATTLE, EXCEPT FEEDLOTS
LR WILSON ENTERPRISES (1015 S MI AV in EL RENO, OK)
(Integrated Compliance Information System) - ICIS-06-1999-0388, FORMAL ENFORCEMENT ACTION COMPLIANCE ACTIVITY (Tracking inspections of insecticide, fungicide, and rodenticide, and toxic substances) Business SIC classification: CHEMICALS AND CHEMICAL PREPARATIONS Alternative names: L.R. WILSON ENTERPRISES
BANNER ES (2455 N. BANNER ROAD in EL RENO, OK)
(National Center for Education Statistics) - STATE ID-09-C031-105
DARLINGTON ES (4408 NORTH HIGHWAY 81 in EL RENO, OK)
(National Center for Education Statistics) - STATE ID-09-C070-105
ETTA DALE JHS (601 SOUTH CHOCTAW in EL RENO, OK)
(National Center for Education Statistics) - STATE ID-09-I034-610 Organizations: EL RENO (SCHOOL DISTRICT)
EL RENO HS (407 SOUTH CHOCTAW in EL RENO, OK)
(National Center for Education Statistics) - STATE ID-09-I034-705
DEXTER AXLES (500 SOUTHEAST 27TH STREET in EL RENO, OK)
AIR MINOR (AIRS/AFS) CRITERIA AND HAZARDOUS AIR POLLUTANT INVENTORY (Inventory of air pollution sources) Small Quantity Generators, between 100 kg and 1000 kg of hazardous waste/month (Resource Conservation and Recovery Act (tracking hazardous waste)) - notification TRI REPORTER (Tracking of toxic chemicals releasing facilities) Business SIC classification: MOTOR VEHICLE PARTS AND ACCESSORIES Organizations: TOMKINS IND INC (CONTACT/OWNER)
EL RENO CITY OF (101 N CHOCTAW AVE in EL RENO, OK)
(Integrated Compliance Information System) - ICIS-06-1992-0115, FORMAL ENFORCEMENT ACTION Business SIC classification: EXECUTIVE OFFICES
CACTUS RIG & EQUIPMENT COMPANY (2605 EVANS ROAD in EL RENO, OK)
HAZARDOUS WASTE BIENNIAL REPORTER (Resource Conservation and Recovery Act (tracking hazardous waste)) (Resource Conservation and Recovery Act (tracking hazardous waste)) Business NAICS classification: OIL AND GAS FIELD MACHINERY AND EQUIPMENT MANUFACTURING. Organizations: KAISER-FRANCIS OIL COMPANY (CONTACT/OWNER)
EL RENO AIRPARK LAGOONS (6600 S MUSTANG FIELD RD in EL RENO, OK)
STATE MASTER (Oklahoma environmental compliance activities data) (Resource Conservation and Recovery Act (tracking hazardous waste)) Organizations: CITY OF EL RENO (CONTACT/OWNER)
Housing units lacking complete plumbing facilities: 3.7% Housing units lacking complete kitchen facilities: 5.0%
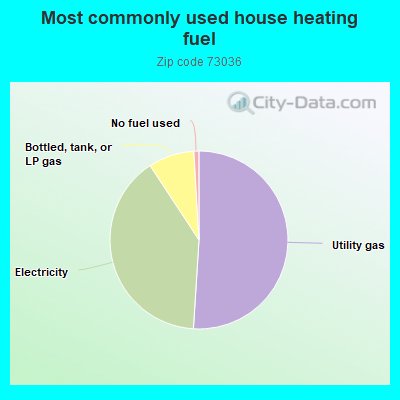
50.7%Utility gas
39.5%Electricity
8.3%Bottled, tank, or LP gas
0.9%No fuel used
Population in 1990: 18,480.
Place of birth for U.S.-born residents:
This state: 13,038
Northeast: 365
Midwest: 1,365
South: 2,970
West: 1,529
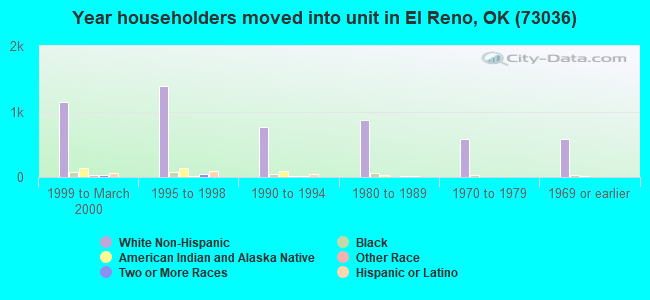
51% of the 73036 zip code residents lived in the same house 5 years ago. Out of people who lived in different houses, 55% lived in this county. Out of people who lived in different counties, 50% lived in Oklahoma.
85% of the 73036 zip code residents lived in the same house 1 year ago. Out of people who lived in different houses, 36% moved from this county. Out of people who lived in different houses, 39% moved from different county within same state. Out of people who lived in different houses, 24% moved from different state. Out of people who lived in different houses, 1% moved from abroad.
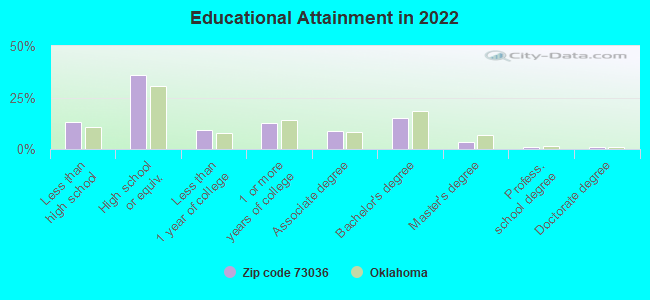
Private vs. public school enrollment:
Students in private schools in grades 1 to 8 (elementary and middle school): 340
Here:
14.6%
Oklahoma:
11.7%
Students in private schools in grades 9 to 12 (high school): 129
Here:
13.3%
Oklahoma:
11.7%
Students in private undergraduate colleges: 156
Here:
17.2%
Oklahoma:
19.3%
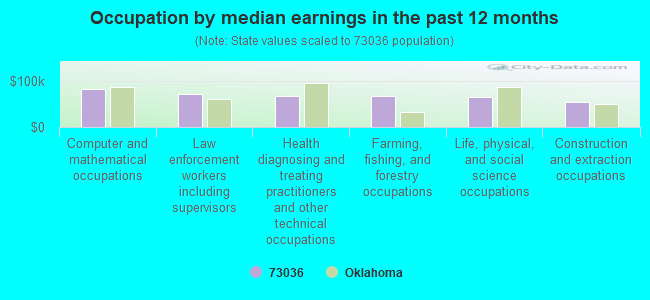
Occupation by median earnings in the past 12 months ($)
84,255Computer and mathematical occupations
72,740Law enforcement workers including supervisors
68,595Health diagnosing and treating practitioners and other technical occupations
68,356Farming, fishing, and forestry occupations
66,700Life, physical, and social science occupations
55,430Construction and extraction occupations
Companies with federal contracts located in this zip code:
CRYSTAL SPRINGS INC AND OKLAHO (10907 NORTH CHILES ROAD in EL RENO, OK; small business) : $337,169 in 6 contractsfrom 2002 to 2005
Contracts for Forage and Feed, Beverages, Nonalcoholic, Water Purification Equipment, Water Services by Army Signed by year:2000: $0; 2001: $0; 2002: $6,955; 2003: $0; 2004: $32,585; 2005: $297,629; 2006: $0.
Biggest contracts:
$140,922 with Army for Forage and Feed. Signed on 2005-09-12. Completion date: 2005-10-04.
$140,922, same as above.Signed on 2005-09-12. Completion date: 2005-10-04.
$17,325 with Army for Beverages, Nonalcoholic. Signed on 2004-08-17. Completion date: 2004-08-20.
$15,785 with Army for Water Purification Equipment. Signed on 2005-04-14. Completion date: 2005-04-29.
PATRICK, DENNIS ENTERPRISES IN (6421 S OLD HIGHWAY 81 in EL RENO, OK; small business)
$4,530 with Air Force for Maintenance, Repair or Alteration of Real Property -- Maintenance Buildings. Signed on 2005-08-26. Completion date: 2005-07-10.
Top industries in this zip code by the number of employees in 2005:
2002 - 2018 National Fire Incident Reporting System (NFIRS) incidents
According to the data from the years 2002 - 2018 the average number of fires per year is 152. The highest number of reported fires - 239 took place in 2011, and the least - 110 in 2009. The data has a decreasing trend.
When looking into fire subcategories, the most incidents belonged to: Outside Fires (62.1%), and Structure Fires (22.0%).
Fire incident types reported to NFIRS in Zip Code 73036


 Nearest zip codes: 73090, 73099, 73014, 73762, 73059, 73064.
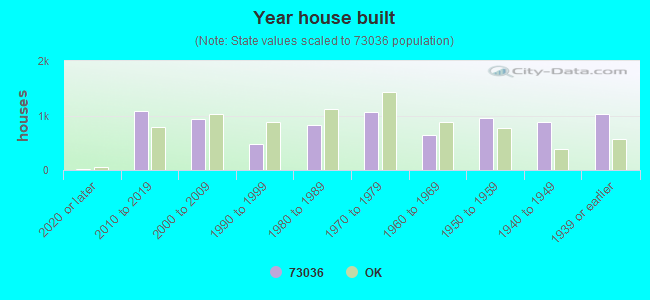


 According to the data from the years 2002 - 2018 the average number of fires per year is 152. The highest number of reported fires - 239 took place in 2011, and the least - 110 in 2009. The data has a decreasing trend.
 When looking into fire subcategories, the most incidents belonged to: Outside Fires (62.1%), and Structure Fires (22.0%).