Estimated zip code population in 2022: 3,627 Zip code population in 2010: 3,913 Zip code population in 2000: 3,903
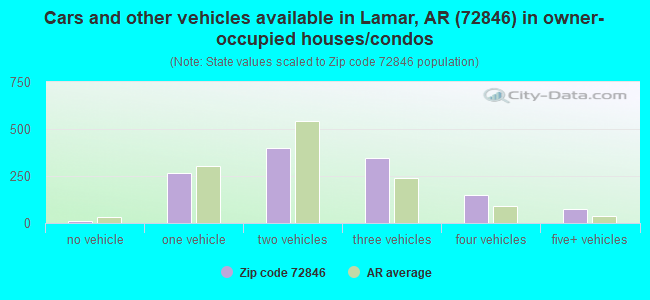
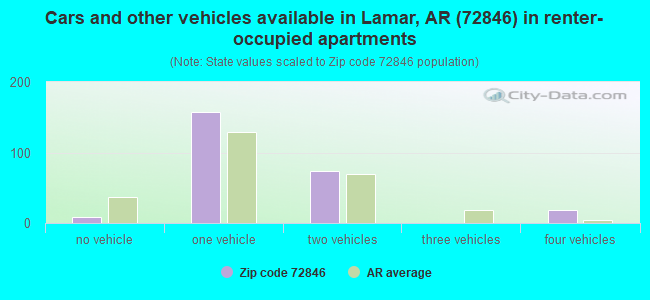
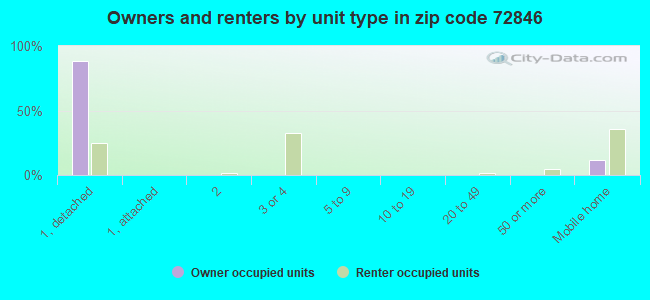
Houses and condos: 1,651 Renter-occupied apartments: 258
% of renters here:
17%
State:
34%
March 2022 cost of living index in zip code 72846: 78.8 (low, U.S. average is 100)
Land area: 96.3 sq. mi. Water area: 3.2 sq. mi.
Population density: 38 people per square mile
(very low).
OSM Map
General Map
Google Map
MSN Map
OSM Map
General Map
Google Map
MSN Map
OSM Map
General Map
Google Map
MSN Map
OSM Map
General Map
Google Map
MSN Map
Please wait while loading the map...
Real estate property taxes paid for housing units in 2022:
This zip code:
0.6% ($824)
Arkansas:
0.5% ($977)
Median real estate property taxes paid for housing units with mortgages in 2022: $907 (0.5%) Median real estate property taxes paid for housing units with no mortgage in 2022: $674 (0.5%)
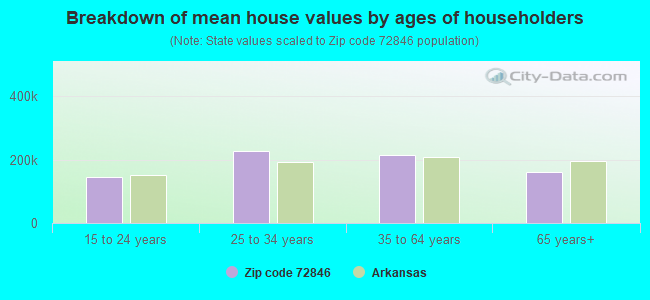
Estimated median house/condo value in 2022: $147,914
72846:
$147,914
Arkansas:
$179,800
According to our research of Arkansas and other state lists, there were 8 registered sex offenders living in 72846 zip code as of May 20, 2024. The ratio of all residents to sex offenders in zip code 72846 is 525 to 1. The ratio of registered sex offenders to all residents in this zip code is near the state average.
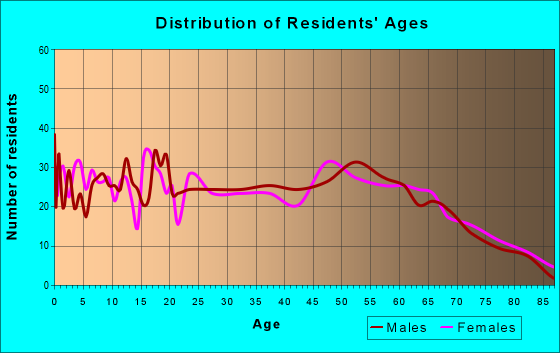
Median resident age:
This zip code:
39.8 years
Arkansas median age:
38.9 years
Average household size:
This zip code:
2.4 people
Arkansas:
2.4 people
Averages for the 2020 tax year for zip code 72846, filed in 2021:
Average Adjusted Gross Income (AGI) in 2020: $51,681 (Individual Income Tax Returns)
Here:
$51,681
State:
$64,872
Salary/wage: $45,979 (reported on 83.4% of returns)
Here:
$45,979
State:
$50,644
(% of AGI for various income ranges: 1236.2% for AGIs below $25k, 3701.5% for AGIs $25k-50k, 6667.6% for AGIs $50k-75k, 9776.7% for AGIs $75k-100k, 14559.1% for AGIs $100k-200k)
Taxable interest for individuals: $629 (reported on 19.7% of returns)
This zip code:
$629
Arkansas:
$1,857
(% of AGI for various income ranges: 7.6% for AGIs below $25k, 7.4% for AGIs $25k-50k, 40.6% for AGIs $50k-75k, 28.9% for AGIs $75k-100k, 26.4% for AGIs $100k-200k)
Ordinary dividends: $1,633 (reported on 11.5% of returns)
Here:
$1,633
State:
$21,681
(% of AGI for various income ranges: 18.7% for AGIs below $25k, 20.0% for AGIs $25k-50k, 28.2% for AGIs $50k-75k, 28.9% for AGIs $75k-100k, 61.8% for AGIs $100k-200k)
Net capital gain/loss in AGI: +$7,047 (reported on 10.8% of returns)
Here:
+$7,047
State:
+$22,815
(% of AGI for various income ranges: 7.3% for AGIs below $25k, 26.5% for AGIs $25k-50k, 201.2% for AGIs $50k-75k, 48.9% for AGIs $75k-100k, 626.4% for AGIs $100k-200k)
Profit/loss from business: +$5,832 (reported on 15.9% of returns)
Here:
+$5,832
State:
+$9,743
(% of AGI for various income ranges: 139.3% for AGIs below $25k, 45.9% for AGIs $25k-50k, 164.7% for AGIs $50k-75k, 293.3% for AGIs $75k-100k, 119.1% for AGIs $100k-200k)
Taxable individual retirement arrangement distribution: $15,358 (reported on 7.6% of returns)
72846:
$15,358
Arkansas:
$18,502
(% of AGI for various income ranges: 87.8% for AGIs below $25k, 448.8% for AGIs $50k-75k, 622.7% for AGIs $100k-200k)
Total itemized deductions: $36,620 (reported on 3.2% of returns)
Here:
$36,620
State:
$52,840
(% of AGI for various income ranges: 151.3% for AGIs below $25k, 1045.5% for AGIs $100k-200k)
Charity contributions: $12,725 (reported on 2.5% of returns)
Here:
$12,725
State:
$35,735
(% of AGI for various income ranges: 462.7% for AGIs $100k-200k)
Taxes paid: $5,760 (reported on 3.2% of returns)
72846:
$5,760
State:
$7,196
(% of AGI for various income ranges: 15.3% for AGIs below $25k, 199.1% for AGIs $100k-200k)
Earned income credit: $2,485 (reported on 24.8% of returns)
Here:
$2,485
State:
$2,546
(% of AGI for various income ranges: 136.9% for AGIs below $25k, 103.8% for AGIs $25k-50k)
Percentage of individuals using paid preparers for their 2020 taxes: 94.9%
Here:
95%
State:
94%
(% for various income ranges: 93.1% for AGIs below $25k, 97.6% for AGIs $25k-50k, 95.8% for AGIs $50k-75k, 92.9% for AGIs $75k-100k, 93.8% for AGIs $100k-200k, 100.0% for AGIs over 200k)
Averages for the 2012 tax year for zip code 72846, filed in 2013:
Average Adjusted Gross Income (AGI) in 2012: $40,918 (Individual Income Tax Returns)
Here:
$40,918
State:
$52,148
Salary/wage: $37,829 (reported on 86.8% of returns)
Here:
$37,829
State:
$41,669
(% of AGI for various income ranges: 79.0% for AGIs below $25k, 82.5% for AGIs $25k-50k, 89.6% for AGIs $50k-75k, 80.0% for AGIs $75k-100k, 71.4% for AGIs $100k-200k)
Taxable interest for individuals: $884 (reported on 21.5% of returns)
This zip code:
$884
Arkansas:
$1,648
(% of AGI for various income ranges: 1.1% for AGIs below $25k, 0.4% for AGIs $25k-50k, 0.3% for AGIs $50k-75k, 0.2% for AGIs $75k-100k, 0.4% for AGIs $100k-200k)
Ordinary dividends: $1,317 (reported on 12.5% of returns)
Here:
$1,317
State:
$20,675
(% of AGI for various income ranges: 0.8% for AGIs below $25k, 0.5% for AGIs $25k-50k, 0.4% for AGIs $50k-75k, 0.1% for AGIs $75k-100k, 0.2% for AGIs $100k-200k)
Net capital gain/loss in AGI: +$3,224 (reported on 11.8% of returns)
Here:
+$3,224
State:
+$15,222
(% of AGI for various income ranges: 0.7% for AGIs below $25k, 0.7% for AGIs $25k-50k, 1.2% for AGIs $50k-75k, 2.2% for AGIs $75k-100k, 0.3% for AGIs $100k-200k)
Profit/loss from business: +$5,359 (reported on 15.3% of returns)
Here:
+$5,359
State:
+$9,665
(% of AGI for various income ranges: 8.3% for AGIs below $25k, 2.6% for AGIs $25k-50k, 0.2% for AGIs $50k-75k, 0.7% for AGIs $75k-100k)
Taxable individual retirement arrangement distribution: $10,111 (reported on 6.2% of returns)
72846:
$10,111
Arkansas:
$13,644
(% of AGI for various income ranges: 2.0% for AGIs below $25k, 2.5% for AGIs $25k-50k, 4.1% for AGIs $75k-100k)
Total itemized deductions: $19,921 (24% of AGI, reported on 16.7% of returns)
Here:
$19,921
State:
$23,276
Here:
23.6% of AGI
State:
19.1% of AGI
(% of AGI for various income ranges: 4.9% for AGIs below $25k, 4.4% for AGIs $25k-50k, 5.9% for AGIs $50k-75k, 11.1% for AGIs $75k-100k, 13.4% for AGIs $100k-200k)
Charity contributions: $4,419 (reported on 11.1% of returns)
Here:
$4,419
State:
$5,996
(% of AGI for various income ranges: 1.0% for AGIs $25k-50k, 0.7% for AGIs $50k-75k, 1.7% for AGIs $75k-100k, 2.2% for AGIs $100k-200k)
Taxes paid: $5,592 (reported on 16.7% of returns)
72846:
$5,592
State:
$7,941
(% of AGI for various income ranges: 0.6% for AGIs below $25k, 0.8% for AGIs $25k-50k, 1.6% for AGIs $50k-75k, 3.0% for AGIs $75k-100k, 4.8% for AGIs $100k-200k)
Earned income credit: $2,483 (reported on 29.2% of returns)
Here:
$2,483
State:
$2,455
(% of AGI for various income ranges: 9.2% for AGIs below $25k, 1.8% for AGIs $25k-50k)
Percentage of individuals using paid preparers for their 2012 taxes: 65.3%
Here:
65%
State:
61%
(% for various income ranges: 60.0% for AGIs below $25k, 70.0% for AGIs $25k-50k, 68.4% for AGIs $50k-75k, 63.6% for AGIs $75k-100k, 77.8% for AGIs $100k-200k)
Averages for the 2004 tax year for zip code 72846, filed in 2005:
Average Adjusted Gross Income (AGI) in 2004: $30,028 (Individual Income Tax Returns)
Here:
$30,028
State:
$39,270
Salary/wage: $28,852 (reported on 87.3% of returns)
Here:
$28,852
State:
$34,079
(% of AGI for various income ranges: 166.3% for AGIs below $10k, 81.8% for AGIs $10k-25k, 86.9% for AGIs $25k-50k, 84.2% for AGIs $50k-75k, 91.7% for AGIs $75k-100k, 61.7% for AGIs over 100k)
Taxable interest for individuals: $1,266 (reported on 27.7% of returns)
This zip code:
$1,266
Arkansas:
$1,904
(% of AGI for various income ranges: 6.0% for AGIs below $10k, 1.7% for AGIs $10k-25k, 1.0% for AGIs $25k-50k, 1.0% for AGIs $50k-75k, 0.4% for AGIs $75k-100k, 1.0% for AGIs over 100k)
Taxable dividends: $753 (reported on 13.9% of returns)
Here:
$753
State:
$5,995
(% of AGI for various income ranges: 2.2% for AGIs below $10k, 0.3% for AGIs $10k-25k, 0.2% for AGIs $25k-50k, 0.6% for AGIs $50k-75k, 0.1% for AGIs $75k-100k, 0.2% for AGIs over 100k)
Net capital gain/loss: +$2,691 (reported on 14.2% of returns)
Here:
+$2,691
State:
+$10,430
(% of AGI for various income ranges: -1.4% for AGIs below $10k, 0.6% for AGIs $10k-25k, 0.8% for AGIs $25k-50k, 3.1% for AGIs $50k-75k, 1.1% for AGIs $75k-100k, 1.0% for AGIs over 100k)
Profit/loss from business: +$2,808 (reported on 15.6% of returns)
Here:
+$2,808
State:
+$7,823
(% of AGI for various income ranges: -34.0% for AGIs below $10k, 7.5% for AGIs $10k-25k, 1.9% for AGIs $25k-50k, -0.2% for AGIs $50k-75k, 0.6% for AGIs $75k-100k)
Total itemized deductions: $15,580 (23% of AGI, reported on 15.0% of returns)
Here:
$15,580
State:
$18,389
Here:
23.4% of AGI
State:
21.0% of AGI
(% of AGI for various income ranges: 15.6% for AGIs below $10k, 3.5% for AGIs $10k-25k, 6.7% for AGIs $25k-50k, 9.2% for AGIs $50k-75k, 10.1% for AGIs $75k-100k, 10.8% for AGIs over 100k)
Charity contributions deductions: $3,601 (5% of AGI, reported on 10.8% of returns)
Here:
$3,601
State:
$4,725
Here:
4.8% of AGI
State:
5.1% of AGI
(% of AGI for various income ranges: 0.8% for AGIs $10k-25k, 1.1% for AGIs $25k-50k, 1.2% for AGIs $50k-75k, 1.9% for AGIs $75k-100k, 2.2% for AGIs over 100k)
Total tax: $3,283 (reported on 66.1% of returns)
72846:
$3,283
State:
$6,047
(% of AGI for various income ranges: 6.4% for AGIs below $10k, 3.7% for AGIs $10k-25k, 5.6% for AGIs $25k-50k, 7.8% for AGIs $50k-75k, 9.9% for AGIs $75k-100k, 12.9% for AGIs over 100k)
Earned income credit: $1,866 (reported on 28.3% of returns)
Here:
$1,866
State:
$1,909
Percentage of individuals using paid preparers for their 2004 taxes: 69.7%
Here:
70%
State:
67%
(% for various income ranges: 64.5% for AGIs below $10k, 69.7% for AGIs $10k-25k, 69.6% for AGIs $25k-50k, 79.9% for AGIs $50k-75k, 70.7% for AGIs $75k-100k, 71.4% for AGIs over 100k)
Household received Food Stamps/SNAP in the past 12 months: 130 Household did not receive Food Stamps/SNAP in the past 12 months: 1,373
Women who had a birth in the past 12 months: 56 (41 now married, 15 unmarried) Women who did not have a birth in the past 12 months: 773 (490 now married, 285 unmarried)
Housing units in zip code 72846 with a mortgage: 729 (15 second mortgage, 14 both second mortgage and home equity loan) Houses without a mortgage: 25
Median monthly owner costs for units with a mortgage: $1,092 Median monthly owner costs for units without a mortgage: $353
Residents with income below the poverty level in 2022:
This zip code:
19.7%
Whole state:
16.8%
Residents with income below 50% of the poverty level in 2022:
This zip code:
12.0%
Whole state:
8.5%
Median number of rooms in houses and condos:
Here:
5.4
State:
6.1
Median number of rooms in apartments:
Here:
4.0
State:
4.3
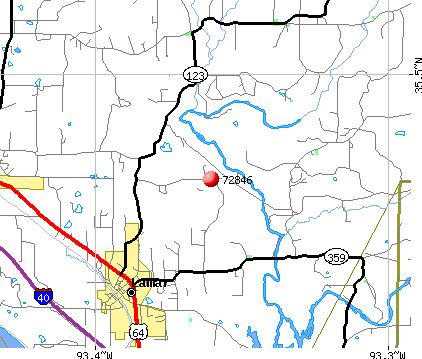
Notable locations in this zip code not listed on our city pages
Notable locations in zip code 72846: Holman-Lutherville Community Center (A), Lamar Police Department (B), Johnson County Rural Fire District 3 (C), Johnson County Rural Fire Department Station 3 Substation (D), Johnson County Rural Fire Department Station 7 Lutherville (E), Johnson County Rural Fire District 3 (F), Lamar Volunteer Fire Station (G). Display/hide their locations on the map
Churches in zip code 72846 include: Lamar Baptist Church (A), Strawberry Assembly of God Church (B), Cabin Creek Baptist Church (C), Faith Full Gospel Church (D), Mountain Home Freewill Baptist Church (E), Lees Chapel Assembly of God Church (F), Pittsburgh Baptist Church (G), Annies Chapel (H), Lees Chapel (I). Display/hide their locations on the map
Cemeteries: Adams Cemetery (1), Blakeley Cemetery (2), Reynolds Cemetery (3), Annis Chapel Cemetery (4), Lewis Johnson Family Cemetery (5), Price Cemetery (6), Cazort Cemetery (7). Display/hide their locations on the map
Streams, rivers, and creeks: Spring Slough (A), Slover Creek (B), Opossum Branch (C), Minnow Creek (D), Little Piney Creek (E), Granny Creek (F). Display/hide their locations on the map
637 married couples with children.
211 single-parent households (20 men, 191 women).
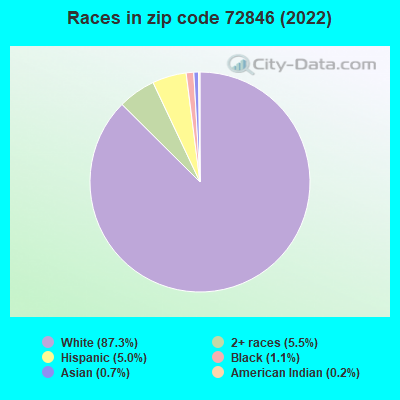
95.3% of residents of 72846 zip code speak English at home.
4.2% of residents speak Spanish at home (77% very well, 7% well, 16% not well).
0.3% of residents speak other Indo-European language at home (100% very well).
Foreign born population: 48 (1.3%) (47.6% of them are naturalized citizens)
This zip code:
1.3%
Whole state:
5.1%
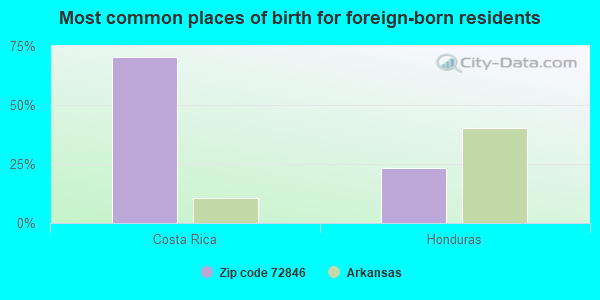
70%Costa Rica
23%Honduras
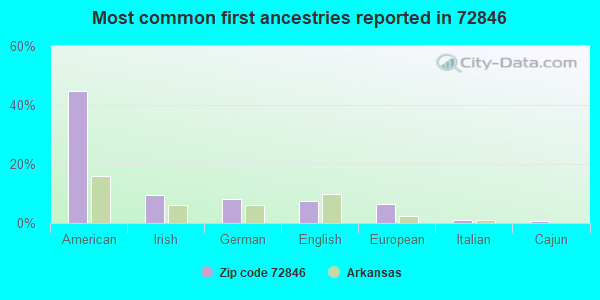
45%American
10%Irish
8%German
8%English
6%European
1%Italian
1%Cajun
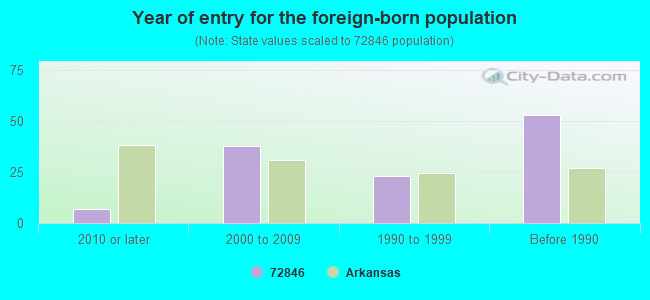
Year of entry for the foreign-born population
72010 or later
382000 to 2009
231990 to 1999
53Before 1990
Facilities with environmental interests located in this zip code:
LAMAR ELEMENTARY SCHOOL (301 ELBERTA ST. in LAMAR,, AR)
(Geographic Names Information System) (National Center for Education Statistics) - STATE ID-3604018
LAMAR HIGH SCHOOL (301 ELBERTA ST. in LAMAR, AR)
(Geographic Names Information System) (National Center for Education Statistics) - STATE ID-3604019
LAMAR QUARRY (ELBERTA STREET in LAMAR, AR)
National Pollutant Discharge Elimination System NON-MAJOR (Tracking pollutant discharge elimination systems) - permit Business SIC classification: CRUSHED AND BROKEN STONE
LAMAR WASTEWATER TREATMENT PLT (437 W MAIN ST in LAMAR, AR)
National Pollutant Discharge Elimination System NON-MAJOR (Tracking pollutant discharge elimination systems) - permit Business SIC classification: SEWERAGE SYSTEMS Alternative names: LAMAR, CITY OF
HARMON BODY SHOP (HWY 359 E .5M E HWY 64 in LAMAR, AR)
Conditionally Exempt Small Quantity Generators, less than 100 kg/month of hazardous waste (Resource Conservation and Recovery Act (tracking hazardous waste)) - notification Organizations: HARMON KENNETH (CONTACT/OWNER)
Housing units lacking complete plumbing facilities: 3.6% Housing units lacking complete kitchen facilities: 2.9%
73.2%Electricity
16.0%Utility gas
5.1%Bottled, tank, or LP gas
4.1%Wood
1.0%Solar energy
0.6%Other fuel
Population in 1990: 2,905. Population change in the 1990s: +998 (+34.4%).
Place of birth for U.S.-born residents:
This state: 2,324
Northeast: 59
Midwest: 320
South: 349
West: 451
55% of the 72846 zip code residents lived in the same house 5 years ago. Out of people who lived in different houses, 56% lived in this county. Out of people who lived in different counties, 50% lived in Arkansas.
90% of the 72846 zip code residents lived in the same house 1 year ago. Out of people who lived in different houses, 40% moved from this county. Out of people who lived in different houses, 41% moved from different county within same state. Out of people who lived in different houses, 19% moved from different state.
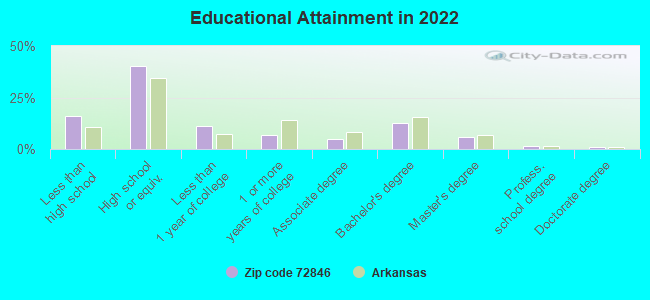
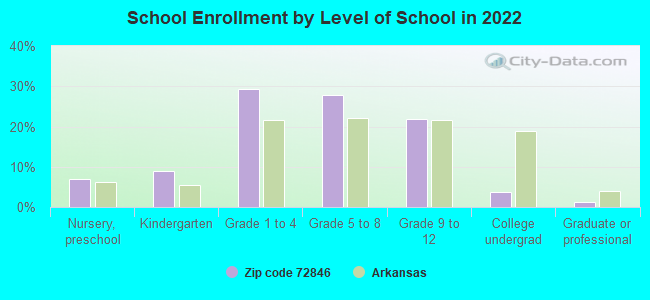
Private vs. public school enrollment:
Students in private schools in grades 1 to 8 (elementary and middle school): 36
Here:
8.2%
Arkansas:
10.5%
Students in private schools in grades 9 to 12 (high school): 20
Here:
12.2%
Arkansas:
8.7%
Students in private undergraduate colleges: 2
Here:
7.4%
Arkansas:
19.4%
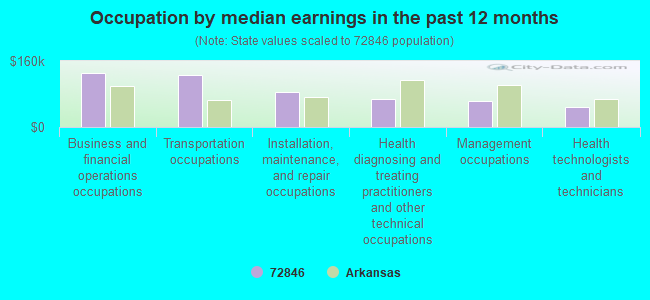
Occupation by median earnings in the past 12 months ($)
130,544Business and financial operations occupations
125,710Transportation occupations
84,285Installation, maintenance, and repair occupations
68,448Health diagnosing and treating practitioners and other technical occupations
62,638Management occupations
49,694Health technologists and technicians
Top industries in this zip code by the number of employees in 2005:
Health Care and Social Assistance: Nursing Care Facilities (50-99 employees: 1 establishment)
Professional, Scientific, and Technical Services: Surveying and Mapping (except Geophysical) Services (5-9: 1)
Utilities: Water Supply and Irrigation Systems (5-9: 1)
Construction: Highway, Street, and Bridge Construction (5-9: 1)
Administrative and Support and Waste Management and Remediation Services: Solid Waste Collection (1-4: 1)
Administrative and Support and Waste Management and Remediation Services: Security Systems Services (except Locksmiths) (1-4: 1)
People in group quarters in 2010:
59 people in nursing facilities/skilled-nursing facilities
People in group quarters in 2000:
69 people in nursing homes
Fatal accident statistics in 2014:
Fatal accident count: 1
Vehicles involved in fatal accidents: 2
Fatal accidents caused by drunken drivers: 0
Fatalities: 1
Persons involved in fatal accidents: 5
Pedestrians involved in fatal accidents: 0
Fatal accident statistics in 2013:
Fatal accident count: 1
Vehicles involved in fatal accidents: 1
Fatal accidents caused by drunken drivers: 0
Fatalities: 1
Persons involved in fatal accidents: 1
Pedestrians involved in fatal accidents: 0
2002 - 2018 National Fire Incident Reporting System (NFIRS) incidents
Based on the data from the years 2002 - 2018 the average number of fires per year is 26. The highest number of fire incidents - 42 took place in 2007, and the least - 1 in 2003. The data has an increasing trend.
When looking into fire subcategories, the most incidents belonged to: Outside Fires (51.3%), and Structure Fires (26.8%).
Fire incident types reported to NFIRS in Zip Code 72846
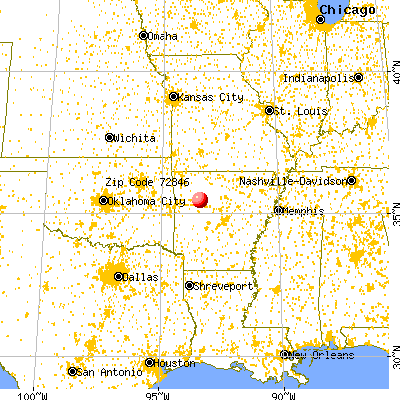


 Nearest zip codes: 72847, 72845, 72839, 72830, 72835, 72863.


 Based on the data from the years 2002 - 2018 the average number of fires per year is 26. The highest number of fire incidents - 42 took place in 2007, and the least - 1 in 2003. The data has an increasing trend.
 When looking into fire subcategories, the most incidents belonged to: Outside Fires (51.3%), and Structure Fires (26.8%).