Estimated zip code population in 2022: 1,655 Zip code population in 2010: 1,685 Zip code population in 2000: 1,491
Houses and condos: 912 Renter-occupied apartments: 137
% of renters here:
20%
State:
34%
March 2022 cost of living index in zip code 72658: 79.6 (low, U.S. average is 100)
Land area: 74.6 sq. mi. Water area: 1.3 sq. mi.
Population density: 22 people per square mile
(very low).
OSM Map
General Map
Google Map
MSN Map
OSM Map
General Map
Google Map
MSN Map
OSM Map
General Map
Google Map
MSN Map
OSM Map
General Map
Google Map
MSN Map
Please wait while loading the map...
Real estate property taxes paid for housing units in 2022:
This zip code:
0.5% ($804)
Arkansas:
0.5% ($977)
Median real estate property taxes paid for housing units with mortgages in 2022: $1,213 (0.5%) Median real estate property taxes paid for housing units with no mortgage in 2022: $453 (0.3%)
Business Search- 14 Million verified businesses
Males: 823
(49.7%)
Females: 832
(50.3%)
For population 25 years and over in 72658:
High school or higher: 86.1%
Bachelor's degree or higher: 8.5%
Graduate or professional degree: 4.3%
Unemployed: 4.8%
Mean travel time to work (commute): 21.4 minutes
For population 15 years and over in 72658:
Never married: 19.0%
Now married: 53.6%
Separated: 2.2%
Widowed: 10.8%
Divorced: 14.4%
Zip code 72658 compared to state average:
Black race population percentage significantly below state average.
Median age above state average.
Foreign-born population percentage below state average.
Renting percentage below state average.
Length of stay since moving in significantly above state average.
Percentage of population with a bachelor's degree or higher significantly below state average.
Estimated median house/condo value in 2022: $169,393
72658:
$169,393
Arkansas:
$179,800
According to our research of Arkansas and other state lists, there were 3 registered sex offenders living in 72658 zip code as of May 29, 2024. The ratio of all residents to sex offenders in zip code 72658 is 751 to 1. The ratio of registered sex offenders to all residents in this zip code is lower than the state average.
Median resident age:
This zip code:
43.3 years
Arkansas median age:
38.9 years
Average household size:
This zip code:
2.5 people
Arkansas:
2.4 people
Averages for the 2020 tax year for zip code 72658, filed in 2021:
Average Adjusted Gross Income (AGI) in 2020: $48,689 (Individual Income Tax Returns)
Here:
$48,689
State:
$64,872
Salary/wage: $37,775 (reported on 68.9% of returns)
Here:
$37,775
State:
$50,644
(% of AGI for various income ranges: 1186.5% for AGIs below $25k, 2971.5% for AGIs $25k-50k, 4855.0% for AGIs $50k-75k, 7070.0% for AGIs $75k-100k, 17330.0% for AGIs $100k-200k)
Taxable interest for individuals: $954 (reported on 32.4% of returns)
This zip code:
$954
Arkansas:
$1,857
(% of AGI for various income ranges: 31.3% for AGIs below $25k, 61.5% for AGIs $25k-50k, 26.7% for AGIs $50k-75k, 60.0% for AGIs $75k-100k, 92.5% for AGIs $100k-200k)
Ordinary dividends: $2,538 (reported on 17.6% of returns)
Here:
$2,538
State:
$21,681
(% of AGI for various income ranges: 36.1% for AGIs below $25k, 73.8% for AGIs $25k-50k, 120.0% for AGIs $50k-75k, 197.5% for AGIs $100k-200k)
Net capital gain/loss in AGI: +$7,782 (reported on 14.9% of returns)
Here:
+$7,782
State:
+$22,815
(% of AGI for various income ranges: 24.3% for AGIs below $25k, 56.2% for AGIs $25k-50k, 306.7% for AGIs $50k-75k, 1357.5% for AGIs $100k-200k)
Profit/loss from business: +$7,092 (reported on 16.2% of returns)
Here:
+$7,092
State:
+$9,743
(% of AGI for various income ranges: 113.9% for AGIs below $25k, 394.6% for AGIs $25k-50k, 190.0% for AGIs $75k-100k)
Taxable individual retirement arrangement distribution: $13,500 (reported on 14.9% of returns)
72658:
$13,500
Arkansas:
$18,502
(% of AGI for various income ranges: 57.8% for AGIs below $25k, 455.4% for AGIs $25k-50k, 1900.0% for AGIs $75k-100k)
Total itemized deductions: $30,900 (reported on 4.1% of returns)
Here:
$30,900
State:
$52,840
(% of AGI for various income ranges: 2317.5% for AGIs $75k-100k)
Charity contributions: $5,900 (reported on 4.1% of returns)
Here:
$5,900
State:
$35,735
(% of AGI for various income ranges: 295.0% for AGIs $50k-75k)
Taxes paid: $7,533 (reported on 4.1% of returns)
72658:
$7,533
State:
$7,196
(% of AGI for various income ranges: 376.7% for AGIs $50k-75k)
Earned income credit: $2,569 (reported on 21.6% of returns)
Here:
$2,569
State:
$2,546
(% of AGI for various income ranges: 116.5% for AGIs below $25k, 110.0% for AGIs $25k-50k)
Percentage of individuals using paid preparers for their 2020 taxes: 95.9%
Here:
96%
State:
94%
(% for various income ranges: 93.9% for AGIs below $25k, 94.4% for AGIs $25k-50k, 100.0% for AGIs $50k-75k, 100.0% for AGIs $75k-100k, 100.0% for AGIs $100k-200k)
Averages for the 2012 tax year for zip code 72658, filed in 2013:
Average Adjusted Gross Income (AGI) in 2012: $38,519 (Individual Income Tax Returns)
Here:
$38,519
State:
$52,148
Salary/wage: $30,228 (reported on 69.4% of returns)
Here:
$30,228
State:
$41,669
(% of AGI for various income ranges: 60.1% for AGIs below $25k, 64.5% for AGIs $25k-50k, 52.9% for AGIs $50k-75k, 55.2% for AGIs $75k-100k, 41.9% for AGIs $100k-200k)
Taxable interest for individuals: $1,070 (reported on 32.3% of returns)
This zip code:
$1,070
Arkansas:
$1,648
(% of AGI for various income ranges: 1.4% for AGIs below $25k, 1.1% for AGIs $25k-50k, 1.0% for AGIs $50k-75k, 0.6% for AGIs $100k-200k)
Ordinary dividends: $2,740 (reported on 16.1% of returns)
Here:
$2,740
State:
$20,675
(% of AGI for various income ranges: 1.9% for AGIs below $25k, 1.7% for AGIs $25k-50k, 1.0% for AGIs $50k-75k, 1.7% for AGIs $75k-100k)
Net capital gain/loss in AGI: +$1,891 (reported on 17.7% of returns)
Here:
+$1,891
State:
+$15,222
(% of AGI for various income ranges: 0.4% for AGIs $25k-50k, 6.5% for AGIs $75k-100k)
Profit/loss from business: +$5,585 (reported on 21.0% of returns)
Here:
+$5,585
State:
+$9,665
(% of AGI for various income ranges: 9.0% for AGIs below $25k, 1.7% for AGIs $25k-50k, 4.6% for AGIs $50k-75k)
Taxable individual retirement arrangement distribution: $16,533 (reported on 14.5% of returns)
72658:
$16,533
Arkansas:
$13,644
(% of AGI for various income ranges: 3.8% for AGIs below $25k, 5.9% for AGIs $25k-50k, 6.2% for AGIs $50k-75k, 22.1% for AGIs $75k-100k)
Total itemized deductions: $18,436 (29% of AGI, reported on 22.6% of returns)
Here:
$18,436
State:
$23,276
Here:
28.7% of AGI
State:
19.1% of AGI
(% of AGI for various income ranges: 9.5% for AGIs below $25k, 9.3% for AGIs $25k-50k, 15.9% for AGIs $50k-75k, 14.0% for AGIs $100k-200k)
Charity contributions: $5,175 (reported on 12.9% of returns)
Here:
$5,175
State:
$5,996
(% of AGI for various income ranges: 1.9% for AGIs below $25k, 2.7% for AGIs $50k-75k, 3.2% for AGIs $100k-200k)
Taxes paid: $4,257 (reported on 22.6% of returns)
72658:
$4,257
State:
$7,941
(% of AGI for various income ranges: 1.0% for AGIs below $25k, 1.4% for AGIs $25k-50k, 3.5% for AGIs $50k-75k, 5.0% for AGIs $100k-200k)
Earned income credit: $2,175 (reported on 25.8% of returns)
Here:
$2,175
State:
$2,455
(% of AGI for various income ranges: 6.6% for AGIs below $25k, 1.3% for AGIs $25k-50k)
Percentage of individuals using paid preparers for their 2012 taxes: 64.5%
Here:
65%
State:
61%
(% for various income ranges: 60.0% for AGIs below $25k, 60.0% for AGIs $25k-50k, 77.8% for AGIs $50k-75k, 75.0% for AGIs $75k-100k, 75.0% for AGIs $100k-200k)
Averages for the 2004 tax year for zip code 72658, filed in 2005:
Average Adjusted Gross Income (AGI) in 2004: $32,993 (Individual Income Tax Returns)
Here:
$32,993
State:
$39,270
Salary/wage: $23,961 (reported on 74.7% of returns)
Here:
$23,961
State:
$34,079
(% of AGI for various income ranges: 85.2% for AGIs below $10k, 65.4% for AGIs $10k-25k, 77.3% for AGIs $25k-50k, 56.8% for AGIs $50k-75k, 57.8% for AGIs $75k-100k, 16.7% for AGIs over 100k)
Taxable interest for individuals: $1,535 (reported on 44.7% of returns)
This zip code:
$1,535
Arkansas:
$1,904
(% of AGI for various income ranges: 5.9% for AGIs below $10k, 3.6% for AGIs $10k-25k, 1.8% for AGIs $25k-50k, 3.0% for AGIs $50k-75k, 0.2% for AGIs $75k-100k, 1.0% for AGIs over 100k)
Taxable dividends: $1,336 (reported on 21.5% of returns)
Here:
$1,336
State:
$5,995
(% of AGI for various income ranges: 1.8% for AGIs below $10k, 0.9% for AGIs $10k-25k, 1.2% for AGIs $25k-50k, 1.1% for AGIs $50k-75k, 0.7% for AGIs over 100k)
Net capital gain/loss: +$12,396 (reported on 19.3% of returns)
Here:
+$12,396
State:
+$10,430
(% of AGI for various income ranges: 1.8% for AGIs $10k-25k, 4.7% for AGIs $25k-50k, 0.4% for AGIs $50k-75k, 4.2% for AGIs $75k-100k, 21.3% for AGIs over 100k)
Profit/loss from business: +$3,750 (reported on 21.4% of returns)
Here:
+$3,750
State:
+$7,823
(% of AGI for various income ranges: 9.8% for AGIs below $10k, 8.4% for AGIs $10k-25k, -1.7% for AGIs $25k-50k, 1.9% for AGIs $50k-75k, 6.5% for AGIs $75k-100k)
IRA payment deduction: $3,067 (reported on 2.2% of returns)
72658:
$3,067
Arkansas:
$3,204
Total itemized deductions: $18,460 (28% of AGI, reported on 23.5% of returns)
Here:
$18,460
State:
$18,389
Here:
27.6% of AGI
State:
21.0% of AGI
(% of AGI for various income ranges: 13.8% for AGIs $10k-25k, 13.6% for AGIs $25k-50k, 11.5% for AGIs $50k-75k, 17.8% for AGIs $75k-100k, 13.1% for AGIs over 100k)
Charity contributions deductions: $2,727 (4% of AGI, reported on 18.5% of returns)
Here:
$2,727
State:
$4,725
Here:
3.6% of AGI
State:
5.1% of AGI
(% of AGI for various income ranges: 0.9% for AGIs $10k-25k, 1.3% for AGIs $25k-50k, 1.8% for AGIs $50k-75k, 2.0% for AGIs $75k-100k, 2.0% for AGIs over 100k)
Total tax: $3,868 (reported on 69.1% of returns)
72658:
$3,868
State:
$6,047
(% of AGI for various income ranges: 3.5% for AGIs below $10k, 4.2% for AGIs $10k-25k, 5.4% for AGIs $25k-50k, 8.9% for AGIs $50k-75k, 11.0% for AGIs $75k-100k, 12.2% for AGIs over 100k)
Earned income credit: $1,748 (reported on 22.4% of returns)
Here:
$1,748
State:
$1,909
Percentage of individuals using paid preparers for their 2004 taxes: 70.9%
Here:
71%
State:
67%
(% for various income ranges: 63.1% for AGIs below $10k, 72.2% for AGIs $10k-25k, 70.4% for AGIs $25k-50k, 78.4% for AGIs $50k-75k, 83.3% for AGIs $75k-100k, 79.2% for AGIs over 100k)
Household received Food Stamps/SNAP in the past 12 months: 57 Household did not receive Food Stamps/SNAP in the past 12 months: 614
Women who had a birth in the past 12 months: 7 (4 now married, 3 unmarried) Women who did not have a birth in the past 12 months: 252 (167 now married, 85 unmarried)
Housing units in zip code 72658 with a mortgage: 235 Median monthly owner costs for units with a mortgage: $1,329 Median monthly owner costs for units without a mortgage: $335
Residents with income below the poverty level in 2022:
This zip code:
23.7%
Whole state:
16.8%
Residents with income below 50% of the poverty level in 2022:
This zip code:
7.4%
Whole state:
8.5%
Median number of rooms in houses and condos:
Here:
5.9
State:
6.1
Median number of rooms in apartments:
Here:
4.5
State:
4.3
Notable locations in this zip code not listed on our city pages
Notable locations in zip code 72658: Norfork Landing (A), Nelson Ferry (B), Matney Campground (C), Shipps Ferry (D), Shipps Landing (E), Martins Ferry (F), Norfork Volunteer Fire Station 1 (G), Norfork Volunteer Fire Station 2 (H), Lone Rock Volunteer Fire Department (I), Rodney Volunteer Fire Department Station 2 (J). Display/hide their locations on the map
Churches in zip code 72658 include: Glacia Church (A), Galatia Church (B), Community Church (C), Lone Rock Baptist Church (D). Display/hide their locations on the map
Cemeteries: Lone Rock Cemetery (1), Martin Springs Cemetery (2), Norfork Cemetery (3), Burnt School House Cemetery (4), Galatia Cemetery (5). Display/hide their locations on the map
Streams, rivers, and creeks: Cockran Creek (A), Canes Fork (B), Perry Creek (C), Otter Creek (D), North Fork River (E), Morton Creek (F), Herrons Creek (G), Goose Creek (H), West Fork Moccasin Creek (I). Display/hide their locations on the map
In group quarters: 4 (-1 institutionalized population)
Size of family households: 192 2-persons, 70 3-persons, 40 4-persons, 73 5-persons, 18 6-persons, 18 7-or-more-persons
Size of nonfamily households: 229 1-person, 10 2-persons, 18 3-persons
267 married couples with children.
163 single-parent households (14 men, 149 women).
95.3% of residents of 72658 zip code speak English at home.
4.6% of residents speak Spanish at home (47% very well, 53% well).
0.1% of residents speak other Indo-European language at home (100% well).
0.2% of residents speak Asian or Pacific Island language at home (100% very well).
Foreign born population: 40 (2.5%) (100.0% of them are naturalized citizens)
This zip code:
2.5%
Whole state:
5.1%
87%Honduras
8%North Macedonia (Macedonia)
62%English
11%American
6%German
5%European
3%British
2%French
2%Norwegian
Year of entry for the foreign-born population
22010 or later
142000 to 2009
01990 to 1999
40Before 1990
Housing units lacking complete plumbing facilities: 2.0% Housing units lacking complete kitchen facilities: 0.9%
69.5%Electricity
15.8%Bottled, tank, or LP gas
9.0%Wood
5.7%Utility gas
Population in 1990: 1,824.
Place of birth for U.S.-born residents:
This state: 770
Northeast: 11
Midwest: 449
South: 185
West: 189
63% of the 72658 zip code residents lived in the same house 5 years ago. Out of people who lived in different houses, 39% lived in this county. Out of people who lived in different counties, 50% lived in Arkansas.
90% of the 72658 zip code residents lived in the same house 1 year ago. Out of people who lived in different houses, 56% moved from this county. Out of people who lived in different houses, 2% moved from different county within same state. Out of people who lived in different houses, 40% moved from different state.
Private vs. public school enrollment:
Students in private schools in grades 1 to 8 (elementary and middle school): 5
Here:
2.2%
Arkansas:
10.5%
Students in private schools in grades 9 to 12 (high school):
Here:
0.9%
Arkansas:
8.7%
Students in private undergraduate colleges: 47
Here:
89.6%
Arkansas:
19.4%
Occupation by median earnings in the past 12 months ($)
186,298Management occupations
45,361Production occupations
39,667Sales and related occupations
36,591Office and administrative support occupations
25,872Construction and extraction occupations
14,338Food preparation and serving related occupations
Companies with federal contracts located in this zip code:
RAY S CONTRACTING (4412 PUSH MTN RD in NORFORK, AR; small business) : $158,160 in 14 contractsfrom 2001 to 2004
Contracts for Construction of Structures and Facilities -- Recreation Facilities (Non-Building), Maintenance, Repair or Alteration of Real Property -- Recreation Facilities (Non-Building), Construction of Structures and Facilities -- Other Non-Building Facilities, Maintenance, Repair or Alteration of Real Property -- Other Non-Building Facilities, and moreby U.S. Army Corps of Engineers - civil program financing only, Army Signed by year:2000: $0; 2001: $26,120; 2002: $37,520; 2003: $7,800; 2004: $86,720; 2005: $0; 2006: $0.
Biggest contracts:
$21,000 with U.S. Army Corps of Engineers - civil program financing only for Construction of Structures and Facilities -- Recreation Facilities (Non-Building). Signed on 2004-05-17. Completion date: 2004-06-16.
$21,000 with Army for Construction of Structures and Facilities -- Recreation Facilities (Non-Building). Signed on 2004-05-17. Completion date: 2004-06-16.
$16,490 with U.S. Army Corps of Engineers - civil program financing only for Maintenance, Repair or Alteration of Real Property -- Recreation Facilities (Non-Building). Signed on 2002-04-08. Completion date: 2002-05-31.
$15,960 with Army for Construction of Structures and Facilities -- Recreation Facilities (Non-Building). Signed on 2004-04-15. Completion date: 2004-05-15.
Top industries in this zip code by the number of employees in 2005:
Construction: Oil and Gas Pipeline and Related Structures Construction (10-19 employees: 1 establishment)
Accommodation and Food Services: Limited-Service Restaurants (5-9: 1)
Real Estate and Rental and Leasing: Recreational Goods Rental (1-4: 2)
Administrative and Support and Waste Management and Remediation Services: Landscaping Services (1-4: 2)
Other Services (except Public Administration): Religious Organizations (1-4: 2)
Health Care and Social Assistance: Community Food Services (1-4: 1)
Accommodation and Food Services: Recreational and Vacation Camps (except Campgrounds) (1-4: 1)
People in group quarters in 2010:
2 people in group homes intended for adults
Fatal accident statistics in 2014:
Fatal accident count: 1
Vehicles involved in fatal accidents: 1
Fatal accidents caused by drunken drivers: 0
Fatalities: 1
Persons involved in fatal accidents: 1
Pedestrians involved in fatal accidents: 0
Fatal accident statistics in 2012:
Fatal accident count: 1
Vehicles involved in fatal accidents: 1
Fatal accidents caused by drunken drivers: 0
Fatalities: 1
Persons involved in fatal accidents: 1
Pedestrians involved in fatal accidents: 0
2002 - 2018 National Fire Incident Reporting System (NFIRS) incidents
Based on the data from the years 2002 - 2018 the average number of fires per year is 24. The highest number of reported fire incidents - 57 took place in 2007, and the least - 3 in 2003. The data has a rising trend.
When looking into fire subcategories, the most reports belonged to: Outside Fires (59.9%), and Structure Fires (31.1%).
Fire incident types reported to NFIRS in Zip Code 72658

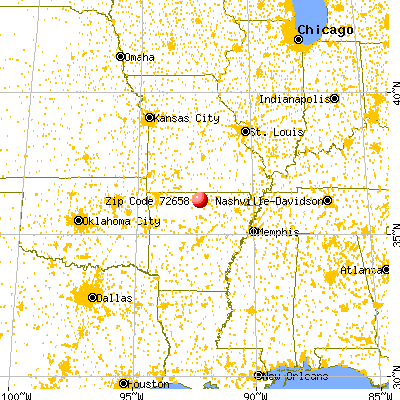


 Nearest zip codes: 72519, 72617, 72634, 72653, 72533, 72528.


 : $158,160 in 14 contracts from 2001 to 2004


 Based on the data from the years 2002 - 2018 the average number of fires per year is 24. The highest number of reported fire incidents - 57 took place in 2007, and the least - 3 in 2003. The data has a rising trend.
 When looking into fire subcategories, the most reports belonged to: Outside Fires (59.9%), and Structure Fires (31.1%).