Estimated zip code population in 2022: 713 Zip code population in 2010: 953 Zip code population in 2000: 1,345
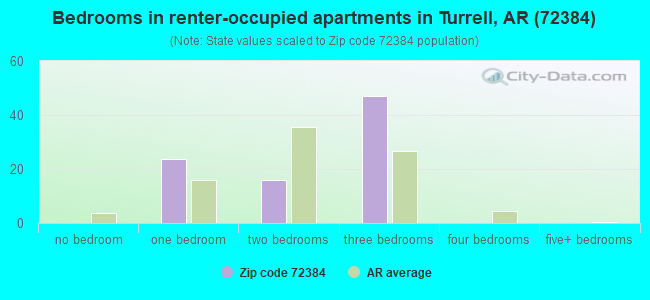
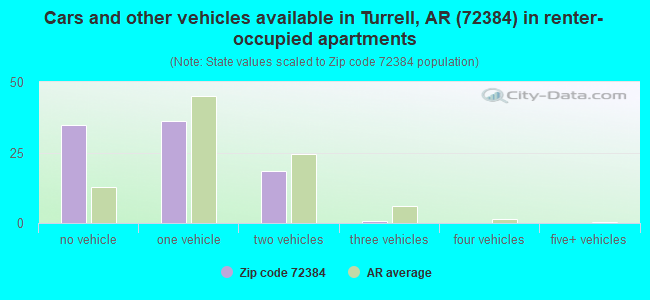
Houses and condos: 345 Renter-occupied apartments: 87
% of renters here:
34%
State:
34%
March 2022 cost of living index in zip code 72384: 78.0 (low, U.S. average is 100)
Land area: 92.5 sq. mi. Water area: 3.3 sq. mi.
Population density: 8 people per square mile
(very low).
OSM Map
General Map
Google Map
MSN Map
OSM Map
General Map
Google Map
MSN Map
OSM Map
General Map
Google Map
MSN Map
OSM Map
General Map
Google Map
MSN Map
Please wait while loading the map...
Real estate property taxes paid for housing units in 2022:
This zip code:
0.7% ($615)
Arkansas:
0.5% ($977)
Median real estate property taxes paid for housing units with mortgages in 2022: $730 (0.6%) Median real estate property taxes paid for housing units with no mortgage in 2022: $385 (0.8%)
Business Search- 14 Million verified businesses
Males: 387
(54.3%)
Females: 325
(45.7%)
For population 25 years and over in 72384:
High school or higher: 79.2%
Bachelor's degree or higher: 9.8%
Graduate or professional degree: 4.5%
Unemployed: 19.3%
Mean travel time to work (commute): 24.0 minutes
For population 15 years and over in 72384:
Never married: 46.6%
Now married: 34.5%
Separated: 3.6%
Widowed: 7.4%
Divorced: 7.9%
Zip code 72384 compared to state average:
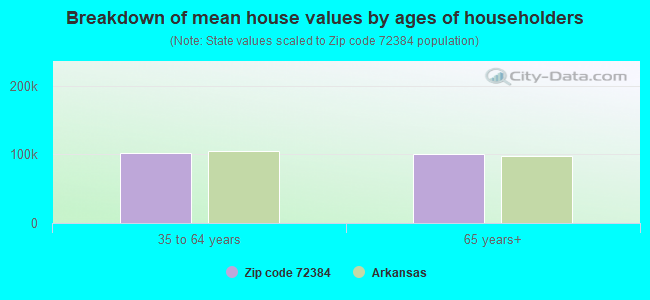
Median house value below state average.
Unemployed percentage significantly above state average.
Black race population percentage significantly above state average.
Hispanic race population percentage significantly below state average.
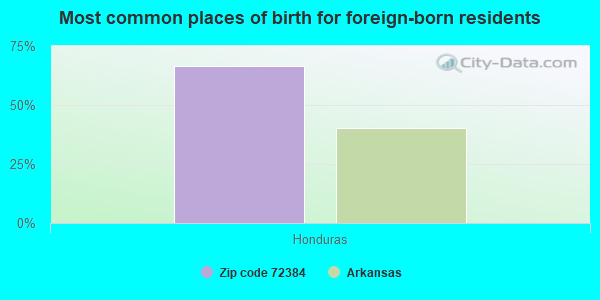
Foreign-born population percentage significantly below state average.
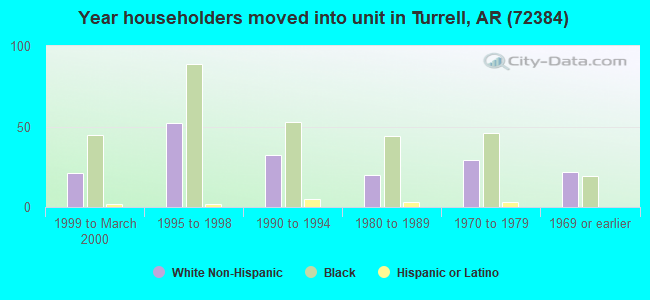
Length of stay since moving in significantly above state average.
Number of college students significantly below state average.
Percentage of population with a bachelor's degree or higher significantly below state average.
Averages for the 2020 tax year for zip code 72384, filed in 2021:
Average Adjusted Gross Income (AGI) in 2020: $37,722 (Individual Income Tax Returns)
Here:
$37,722
State:
$64,872
Salary/wage: $28,021 (reported on 87.5% of returns)
Here:
$28,021
State:
$50,644
(% of AGI for various income ranges: 1316.0% for AGIs below $25k, 4604.0% for AGIs $25k-50k, 3475.0% for AGIs $50k-75k)
Taxable interest for individuals: $33 (reported on 9.4% of returns)
This zip code:
$33
Arkansas:
$1,857
(% of AGI for various income ranges: 0.7% for AGIs below $25k)
Profit/loss from business: +$4,660 (reported on 15.6% of returns)
Here:
+$4,660
State:
+$9,743
(% of AGI for various income ranges: 88.7% for AGIs below $25k, 200.0% for AGIs $25k-50k)
Earned income credit: $2,815 (reported on 40.6% of returns)
Here:
$2,815
State:
$2,546
(% of AGI for various income ranges: 196.0% for AGIs below $25k, 144.0% for AGIs $25k-50k)
Percentage of individuals using paid preparers for their 2020 taxes: 87.5%
Here:
88%
State:
94%
(% for various income ranges: 84.2% for AGIs below $25k, 85.7% for AGIs $25k-50k, 100.0% for AGIs $50k-75k, 100.0% for AGIs $75k-100k)
Averages for the 2012 tax year for zip code 72384, filed in 2013:
Average Adjusted Gross Income (AGI) in 2012: $30,197 (Individual Income Tax Returns)
Here:
$30,197
State:
$52,148
Salary/wage: $24,463 (reported on 90.9% of returns)
Here:
$24,463
State:
$41,669
(% of AGI for various income ranges: 80.2% for AGIs below $25k, 118.2% for AGIs $25k-50k, 54.6% for AGIs $75k-100k)
Taxable interest for individuals: $100 (reported on 6.1% of returns)
This zip code:
$100
Arkansas:
$1,648
Profit/loss from business: +$4,471 (reported on 21.2% of returns)
Here:
+$4,471
State:
+$9,665
Total itemized deductions: $16,075 (20% of AGI, reported on 12.1% of returns)
Here:
$16,075
State:
$23,276
Here:
20.4% of AGI
State:
19.1% of AGI
Charity contributions: $4,233 (reported on 9.1% of returns)
Here:
$4,233
State:
$5,996
Taxes paid: $4,300 (reported on 12.1% of returns)
72384:
$4,300
State:
$7,941
Earned income credit: $2,761 (reported on 54.5% of returns)
Here:
$2,761
State:
$2,455
(% of AGI for various income ranges: 16.6% for AGIs below $25k, 3.1% for AGIs $25k-50k)
Percentage of individuals using paid preparers for their 2012 taxes: 51.5%
Here:
52%
State:
61%
(% for various income ranges: 45.0% for AGIs below $25k, 55.6% for AGIs $25k-50k, 150.0% for AGIs $50k-75k)
Averages for the 2004 tax year for zip code 72384, filed in 2005:
Average Adjusted Gross Income (AGI) in 2004: $22,511 (Individual Income Tax Returns)
Here:
$22,511
State:
$39,270
Salary/wage: $21,556 (reported on 90.4% of returns)
Here:
$21,556
State:
$34,079
(% of AGI for various income ranges: 105.2% for AGIs below $10k, 88.5% for AGIs $10k-25k, 91.8% for AGIs $25k-50k, 81.0% for AGIs $50k-75k, 71.5% for AGIs $75k-100k)
Taxable interest for individuals: $452 (reported on 9.4% of returns)
This zip code:
$452
Arkansas:
$1,904
Profit/loss from business: +$667 (reported on 5.4% of returns)
Here:
+$667
State:
+$7,823
Total itemized deductions: $14,574 (28% of AGI, reported on 10.5% of returns)
Here:
$14,574
State:
$18,389
Here:
28.2% of AGI
State:
21.0% of AGI
Charity contributions deductions: $3,976 (8% of AGI, reported on 9.2% of returns)
Here:
$3,976
State:
$4,725
Here:
8.0% of AGI
State:
5.1% of AGI
Total tax: $3,122 (reported on 40.6% of returns)
72384:
$3,122
State:
$6,047
(% of AGI for various income ranges: 1.8% for AGIs below $10k, 2.0% for AGIs $10k-25k, 4.8% for AGIs $25k-50k, 7.9% for AGIs $50k-75k, 12.3% for AGIs $75k-100k)
Earned income credit: $2,215 (reported on 51.1% of returns)
Here:
$2,215
State:
$1,909
Percentage of individuals using paid preparers for their 2004 taxes: 65.7%
Here:
66%
State:
67%
(% for various income ranges: 52.7% for AGIs below $10k, 73.1% for AGIs $10k-25k, 71.6% for AGIs $25k-50k, 68.0% for AGIs $50k-75k, 72.2% for AGIs $75k-100k)
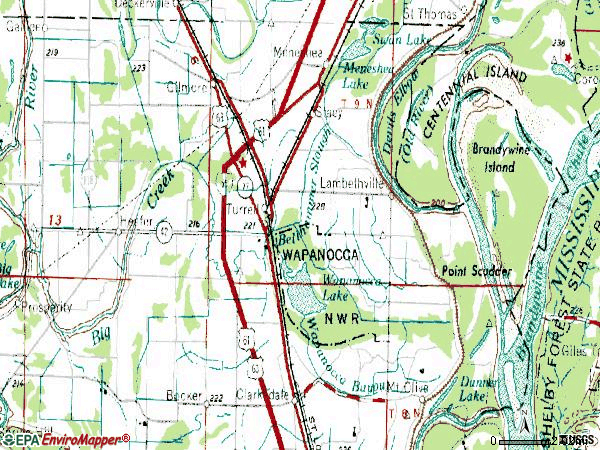
Notable locations in zip code 72384: Island Number 39 Landing (A), East Black Oak (B), Rasts Landing (C), Poker Point Landing (D), Paradise Landing (E), Cigarette Landing (F), Brandywine Landing (G), Turrell Volunteer Fire Department (H), United States Fish And Wildlife - Wapanocca National Wildlife Refuge (Park Security) (I), Turrell Police Department (J). Display/hide their locations on the map
Churches in zip code 72384 include: Union Grove Church (A), Lake Grove Church (B), Macedonia Church (C), Mount Olive Church (D), Pilgrims Rest Church (E). Display/hide their locations on the map
Cemeteries: Sunrise Cemetery (1), Mount Olive Cemetery (2), Bledsoe Cemetery (3), Saint Marks Cemetery (4), Saint Pauls Cemetery (5). Display/hide their locations on the map
Lakes and reservoirs: Lake David (A), North Lake (B), Danner Lake (C), South Lake (D), Meneshea Lake (E), Wapanocca Lake (F), Dead Timber Lake (G). Display/hide their locations on the map
Streams, rivers, and creeks: Lamb Bayou (A), Dry Bayou (B), Deer Bayou (C), Cypress Bayou (D), Chute 38 (E), Sam Bayou (F), Bellhammer Slough (G), Barney Chute (H). Display/hide their locations on the map
Size of family households: 73 2-persons, 39 3-persons, 4 4-persons, 52 5-persons, 3 6-persons
Size of nonfamily households: 69 1-person, 9 3-persons
5 married couples with children.
25 single-parent households (6 men, 19 women).
97.3% of residents of 72384 zip code speak English at home.
1.0% of residents speak Spanish at home (71% very well, 29% well).
1.2% of residents speak other Indo-European language at home (100% not well).
Foreign born population: 3 (0.4%) (0.0% of them are naturalized citizens)
:
0.4%
Whole state:
5.1%
67%Honduras
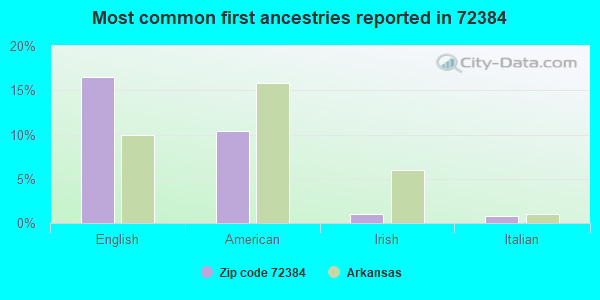
17%English
10%American
1%Irish
1%Italian
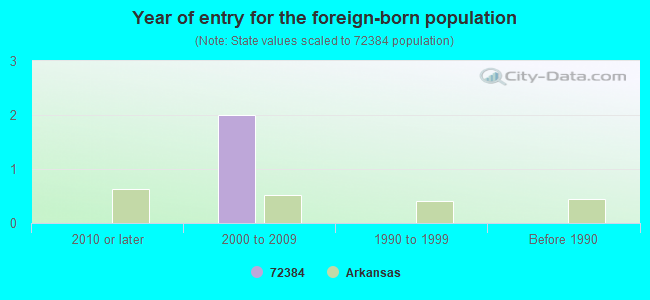
Year of entry for the foreign-born population
02010 or later
22000 to 2009
01990 to 1999
0Before 1990
Facilities with environmental interests located in this zip code:
FUEL MART #798 (I55 & RT 1 in TURRELL, AR)
(Integrated Compliance Information System) - ICIS-06-1998-0878, FORMAL ENFORCEMENT ACTION Business SIC classification: GASOLINE SERVICE STATIONS
EXXON CO USA 57127 (I-55 & US HWY 63 in TURRELL, AR)
(Resource Conservation and Recovery Act (tracking hazardous waste))
Housing units lacking complete plumbing facilities: 12.2% Housing units lacking complete kitchen facilities: 2.5%
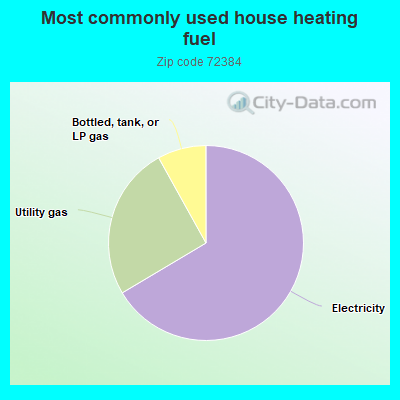
66.8%Electricity
25.6%Utility gas
8.1%Bottled, tank, or LP gas
Population in 1990: 1,308. Population change in the 1990s: +37 (+2.8%).
Place of birth for U.S.-born residents:
This state: 497
Midwest: 54
South: 138
West: 16
67% of the 72384 zip code residents lived in the same house 5 years ago. Out of people who lived in different houses, 59% lived in this county. Out of people who lived in different counties, 50% lived in Arkansas.
92% of the 72384 zip code residents lived in the same house 1 year ago. Out of people who lived in different houses, 71% moved from this county. Out of people who lived in different houses, 21% moved from different state.
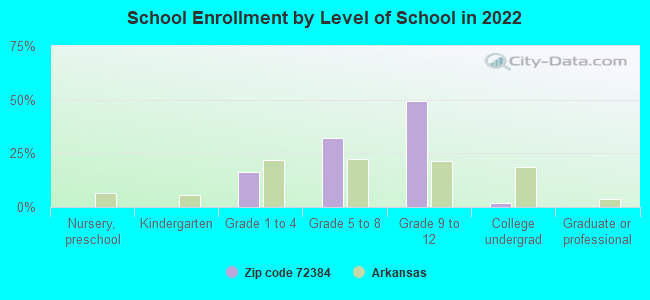
Private vs. public school enrollment:
Students in private schools in grades 1 to 8 (elementary and middle school): 11
Here:
11.5%
Arkansas:
10.5%
Students in private schools in grades 9 to 12 (high school):
Here:
0.0%
Arkansas:
8.7%
Students in private undergraduate colleges:
Here:
0.0%
Arkansas:
19.4%
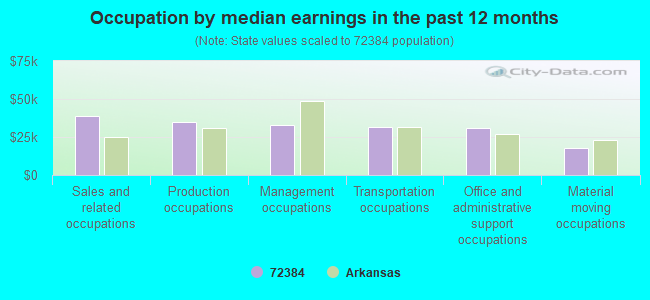
Occupation by median earnings in the past 12 months ($)
39,057Sales and related occupations
34,694Production occupations
32,743Management occupations
31,465Transportation occupations
31,121Office and administrative support occupations
17,831Material moving occupations
Top industries in this zip code by the number of employees in 2005:
Health Care and Social Assistance: Child Day Care Services (1-4 employees: 1 establishment)
Accommodation and Food Services: Limited-Service Restaurants (1-4: 1)
Other Services (except Public Administration): Religious Organizations (1-4: 1)
Utilities: Water Supply and Irrigation Systems (1-4: 1)
Fatal accident statistics in 2014:
Fatal accident count: 1
Vehicles involved in fatal accidents: 2
Fatal accidents caused by drunken drivers: 0
Fatalities: 1
Persons involved in fatal accidents: 2
Pedestrians involved in fatal accidents: 0
Fatal accident statistics in 2011:
Fatal accident count: 1
Vehicles involved in fatal accidents: 1
Fatal accidents caused by drunken drivers: 0
Fatalities: 1
Persons involved in fatal accidents: 2
Pedestrians involved in fatal accidents: 0
Home Mortgage Disclosure Act Aggregated Statistics For Year 2009 (Based on 8 partial tracts)
A) FHA, FSA/RHS & VA Home Purchase Loans
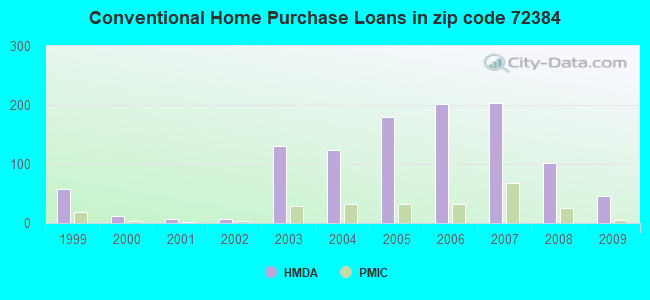
B) Conventional Home Purchase Loans
C) Refinancings
D) Home Improvement Loans
F) Non-occupant Loans on < 5 Family Dwellings (A B C & D)
G) Loans On Manufactured Home Dwelling (A B C & D)
Number
Average Value
Number
Average Value
Number
Average Value
Number
Average Value
Number
Average Value
Number
Average Value
LOANS ORIGINATED
120
$162,753
45
$131,562
159
$161,954
13
$16,585
15
$95,970
1
$16,890
APPLICATIONS APPROVED, NOT ACCEPTED
4
$228,362
1
$131,270
11
$162,148
3
$9,363
1
$39,810
1
$65,090
APPLICATIONS DENIED
11
$133,715
14
$105,337
65
$153,394
12
$23,212
7
$89,807
7
$52,629
APPLICATIONS WITHDRAWN
3
$126,027
4
$140,605
45
$180,494
0
$0
1
$58,340
1
$69,660
FILES CLOSED FOR INCOMPLETENESS
4
$165,002
1
$305,340
11
$171,444
0
$0
0
$0
0
$0
Aggregated Statistics For Year 2008 (Based on 8 partial tracts)
A) FHA, FSA/RHS & VA Home Purchase Loans
B) Conventional Home Purchase Loans
C) Refinancings
D) Home Improvement Loans
F) Non-occupant Loans on < 5 Family Dwellings (A B C & D)
G) Loans On Manufactured Home Dwelling (A B C & D)
Number
Average Value
Number
Average Value
Number
Average Value
Number
Average Value
Number
Average Value
Number
Average Value
LOANS ORIGINATED
86
$166,036
101
$159,324
96
$145,884
20
$25,629
51
$132,805
3
$44,110
APPLICATIONS APPROVED, NOT ACCEPTED
3
$269,883
5
$157,326
9
$180,789
2
$27,040
2
$198,165
1
$29,550
APPLICATIONS DENIED
14
$168,057
25
$99,825
39
$133,230
14
$20,970
4
$72,662
7
$31,493
APPLICATIONS WITHDRAWN
1
$125,290
8
$216,445
28
$154,905
0
$0
3
$102,073
0
$0
FILES CLOSED FOR INCOMPLETENESS
4
$126,795
2
$209,820
4
$82,795
1
$67,340
0
$0
0
$0
Aggregated Statistics For Year 2007 (Based on 8 partial tracts)
A) FHA, FSA/RHS & VA Home Purchase Loans
B) Conventional Home Purchase Loans
C) Refinancings
D) Home Improvement Loans
F) Non-occupant Loans on < 5 Family Dwellings (A B C & D)
G) Loans On Manufactured Home Dwelling (A B C & D)
Number
Average Value
Number
Average Value
Number
Average Value
Number
Average Value
Number
Average Value
Number
Average Value
LOANS ORIGINATED
46
$146,263
203
$152,320
87
$139,042
32
$36,254
49
$113,456
8
$28,712
APPLICATIONS APPROVED, NOT ACCEPTED
2
$112,625
19
$87,448
12
$140,162
5
$113,842
2
$138,280
6
$48,977
APPLICATIONS DENIED
5
$143,444
40
$127,325
55
$129,070
22
$43,279
13
$95,819
7
$41,543
APPLICATIONS WITHDRAWN
1
$211,680
15
$143,583
31
$146,521
2
$142,805
4
$76,015
1
$62,690
FILES CLOSED FOR INCOMPLETENESS
1
$127,160
3
$208,483
11
$169,173
0
$0
0
$0
0
$0
Aggregated Statistics For Year 2006 (Based on 8 partial tracts)
A) FHA, FSA/RHS & VA Home Purchase Loans
B) Conventional Home Purchase Loans
C) Refinancings
D) Home Improvement Loans
F) Non-occupant Loans on < 5 Family Dwellings (A B C & D)
G) Loans On Manufactured Home Dwelling (A B C & D)
Number
Average Value
Number
Average Value
Number
Average Value
Number
Average Value
Number
Average Value
Number
Average Value
LOANS ORIGINATED
59
$130,374
201
$122,076
109
$124,105
26
$27,365
40
$81,259
4
$28,432
APPLICATIONS APPROVED, NOT ACCEPTED
0
$0
10
$92,099
18
$115,634
1
$34,830
3
$104,097
3
$26,987
APPLICATIONS DENIED
6
$131,333
51
$112,310
58
$131,534
15
$33,779
5
$44,176
9
$42,998
APPLICATIONS WITHDRAWN
6
$143,968
19
$137,884
31
$115,041
4
$94,810
6
$132,380
0
$0
FILES CLOSED FOR INCOMPLETENESS
1
$68,810
4
$161,630
14
$162,834
0
$0
0
$0
0
$0
Aggregated Statistics For Year 2005 (Based on 8 partial tracts)
A) FHA, FSA/RHS & VA Home Purchase Loans
B) Conventional Home Purchase Loans
C) Refinancings
D) Home Improvement Loans
E) Loans on Dwellings For 5+ Families
F) Non-occupant Loans on < 5 Family Dwellings (A B C & D)
G) Loans On Manufactured Home Dwelling (A B C & D)
Number
Average Value
Number
Average Value
Number
Average Value
Number
Average Value
Number
Average Value
Number
Average Value
Number
Average Value
LOANS ORIGINATED
62
$122,697
179
$124,971
113
$114,275
11
$22,381
1
$38,520
33
$76,400
5
$28,088
APPLICATIONS APPROVED, NOT ACCEPTED
0
$0
15
$113,482
20
$114,286
3
$123,340
0
$0
1
$62,460
1
$78,710
APPLICATIONS DENIED
10
$99,127
65
$94,734
79
$112,733
15
$36,084
0
$0
12
$55,964
18
$34,519
APPLICATIONS WITHDRAWN
4
$125,578
22
$150,282
37
$155,719
3
$273,623
0
$0
2
$44,385
0
$0
FILES CLOSED FOR INCOMPLETENESS
0
$0
10
$110,952
13
$142,647
0
$0
0
$0
0
$0
0
$0
Aggregated Statistics For Year 2004 (Based on 8 partial tracts)
A) FHA, FSA/RHS & VA Home Purchase Loans
B) Conventional Home Purchase Loans
C) Refinancings
D) Home Improvement Loans
F) Non-occupant Loans on < 5 Family Dwellings (A B C & D)
G) Loans On Manufactured Home Dwelling (A B C & D)
Number
Average Value
Number
Average Value
Number
Average Value
Number
Average Value
Number
Average Value
Number
Average Value
LOANS ORIGINATED
53
$121,719
124
$126,108
116
$116,475
15
$18,068
22
$63,370
3
$46,517
APPLICATIONS APPROVED, NOT ACCEPTED
0
$0
10
$92,801
34
$109,619
3
$95,250
1
$88,270
4
$31,438
APPLICATIONS DENIED
7
$130,854
44
$86,166
80
$98,462
11
$37,538
7
$85,384
10
$45,685
APPLICATIONS WITHDRAWN
2
$109,150
7
$126,891
40
$123,955
1
$46,750
2
$50,135
0
$0
FILES CLOSED FOR INCOMPLETENESS
0
$0
3
$61,390
15
$138,659
2
$25,635
1
$45,240
1
$88,240
Aggregated Statistics For Year 2003 (Based on 8 partial tracts)
A) FHA, FSA/RHS & VA Home Purchase Loans
B) Conventional Home Purchase Loans
C) Refinancings
D) Home Improvement Loans
F) Non-occupant Loans on < 5 Family Dwellings (A B C & D)
Number
Average Value
Number
Average Value
Number
Average Value
Number
Average Value
Number
Average Value
LOANS ORIGINATED
62
$109,757
131
$130,624
289
$119,713
14
$19,254
18
$64,164
APPLICATIONS APPROVED, NOT ACCEPTED
1
$82,570
10
$86,192
35
$112,163
1
$23,590
0
$0
APPLICATIONS DENIED
7
$72,984
23
$105,648
95
$98,880
3
$9,590
3
$43,247
APPLICATIONS WITHDRAWN
6
$112,028
15
$103,249
47
$104,258
1
$1,380
2
$36,655
FILES CLOSED FOR INCOMPLETENESS
0
$0
4
$155,812
18
$86,036
0
$0
0
$0
Aggregated Statistics For Year 2002 (Based on 4 partial tracts)
A) FHA, FSA/RHS & VA Home Purchase Loans
B) Conventional Home Purchase Loans
C) Refinancings
D) Home Improvement Loans
F) Non-occupant Loans on < 5 Family Dwellings (A B C & D)
Number
Average Value
Number
Average Value
Number
Average Value
Number
Average Value
Number
Average Value
LOANS ORIGINATED
7
$91,657
7
$98,434
15
$90,846
2
$4,555
2
$24,510
APPLICATIONS APPROVED, NOT ACCEPTED
0
$0
1
$60,010
6
$79,650
0
$0
1
$82,320
APPLICATIONS DENIED
2
$68,655
6
$60,640
7
$76,530
2
$8,800
1
$60,010
APPLICATIONS WITHDRAWN
1
$72,580
1
$103,370
3
$85,043
0
$0
0
$0
FILES CLOSED FOR INCOMPLETENESS
0
$0
1
$43,670
1
$47,760
0
$0
0
$0
Aggregated Statistics For Year 2001 (Based on 4 partial tracts)
A) FHA, FSA/RHS & VA Home Purchase Loans
B) Conventional Home Purchase Loans
C) Refinancings
D) Home Improvement Loans
F) Non-occupant Loans on < 5 Family Dwellings (A B C & D)
Number
Average Value
Number
Average Value
Number
Average Value
Number
Average Value
Number
Average Value
LOANS ORIGINATED
10
$103,403
7
$61,493
12
$88,395
2
$13,195
3
$39,693
APPLICATIONS APPROVED, NOT ACCEPTED
0
$0
2
$69,280
1
$38,650
0
$0
0
$0
APPLICATIONS DENIED
1
$60,950
3
$49,120
6
$73,523
3
$14,767
0
$0
APPLICATIONS WITHDRAWN
0
$0
1
$29,850
6
$77,555
0
$0
0
$0
FILES CLOSED FOR INCOMPLETENESS
0
$0
0
$0
0
$0
0
$0
0
$0
Aggregated Statistics For Year 2000 (Based on 4 partial tracts)
A) FHA, FSA/RHS & VA Home Purchase Loans
B) Conventional Home Purchase Loans
C) Refinancings
D) Home Improvement Loans
F) Non-occupant Loans on < 5 Family Dwellings (A B C & D)
Number
Average Value
Number
Average Value
Number
Average Value
Number
Average Value
Number
Average Value
LOANS ORIGINATED
6
$92,898
12
$56,085
6
$65,982
4
$5,420
1
$38,020
APPLICATIONS APPROVED, NOT ACCEPTED
0
$0
3
$30,373
2
$37,075
1
$16,650
0
$0
APPLICATIONS DENIED
0
$0
5
$36,070
11
$47,045
4
$9,190
0
$0
APPLICATIONS WITHDRAWN
0
$0
1
$63,150
6
$77,817
1
$16,650
0
$0
FILES CLOSED FOR INCOMPLETENESS
0
$0
0
$0
1
$36,450
0
$0
0
$0
Aggregated Statistics For Year 1999 (Based on 3 partial tracts)
A) FHA, FSA/RHS & VA Home Purchase Loans
B) Conventional Home Purchase Loans
C) Refinancings
D) Home Improvement Loans
E) Loans on Dwellings For 5+ Families
F) Non-occupant Loans on < 5 Family Dwellings (A B C & D)
2002 - 2018 National Fire Incident Reporting System (NFIRS) incidents
Based on the data from the years 2002 - 2018 the average number of fires per year is 8. The highest number of fire incidents - 16 took place in 2010, and the least - 0 in 2003. The data has an increasing trend.
When looking into fire subcategories, the most incidents belonged to: Structure Fires (50.0%), and Outside Fires (25.4%).
Fire incident types reported to NFIRS in Zip Code 72384

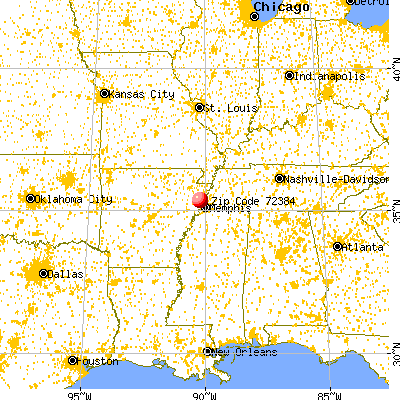


 Nearest zip codes: 72325, 72339, 72338, 72350, 72364, 72386.
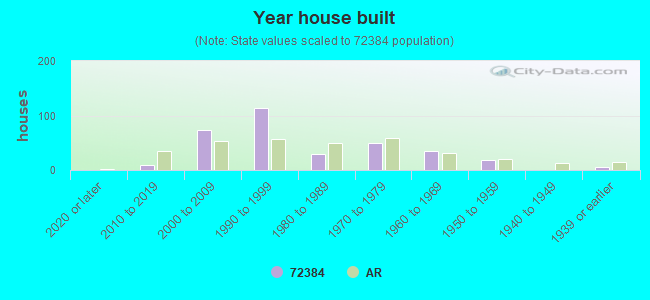


 Based on the data from the years 2002 - 2018 the average number of fires per year is 8. The highest number of fire incidents - 16 took place in 2010, and the least - 0 in 2003. The data has an increasing trend.
 When looking into fire subcategories, the most incidents belonged to: Structure Fires (50.0%), and Outside Fires (25.4%).