Estimated zip code population in 2022: 1,517 Zip code population in 2010: 1,977 Zip code population in 2000: 2,126
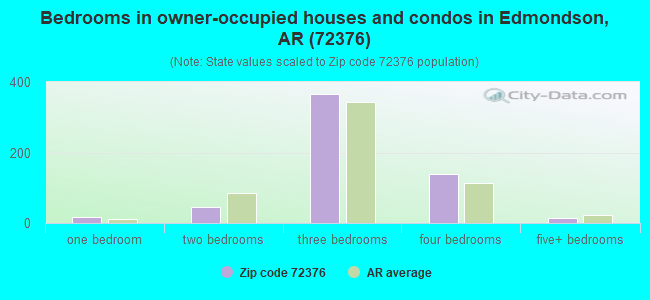
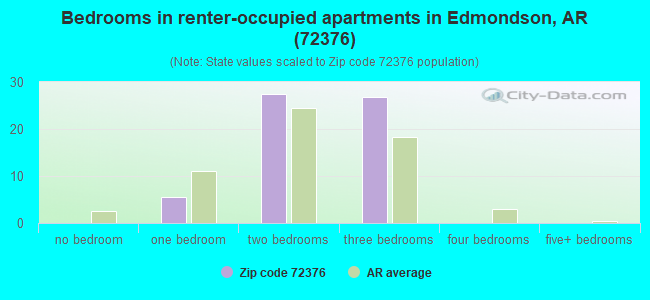
Houses and condos: 701 Renter-occupied apartments: 60
% of renters here:
9%
State:
34%
March 2022 cost of living index in zip code 72376: 77.8 (low, U.S. average is 100)
Land area: 85.7 sq. mi. Water area: 3.3 sq. mi.
Population density: 18 people per square mile
(very low).
OSM Map
General Map
Google Map
MSN Map
OSM Map
General Map
Google Map
MSN Map
OSM Map
General Map
Google Map
MSN Map
OSM Map
General Map
Google Map
MSN Map
Please wait while loading the map...
Real estate property taxes paid for housing units in 2022:
This zip code:
0.4% ($479)
Arkansas:
0.5% ($977)
Median real estate property taxes paid for housing units with mortgages in 2022: $460 (0.3%) Median real estate property taxes paid for housing units with no mortgage in 2022: $488 (0.4%)
Business Search- 14 Million verified businesses
Males: 796
(52.5%)
Females: 720
(47.5%)
For population 25 years and over in 72376:
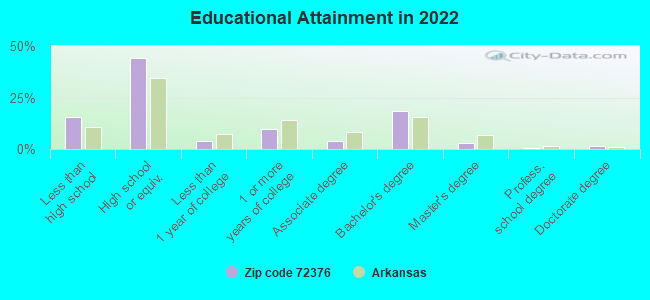
High school or higher: 83.1%
Bachelor's degree or higher: 22.5%
Graduate or professional degree: 4.3%
Unemployed: 5.4%
Mean travel time to work (commute): 26.2 minutes
For population 15 years and over in 72376:
Never married: 22.2%
Now married: 53.1%
Separated: 0.9%
Widowed: 6.7%
Divorced: 17.0%
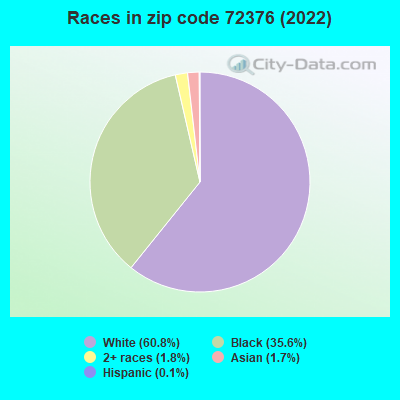
Zip code 72376 compared to state average:
Black race population percentage above state average.
Hispanic race population percentage significantly below state average.
Median age significantly above state average.
Foreign-born population percentage significantly below state average.
Renting percentage significantly below state average.
Length of stay since moving in significantly above state average.
Number of college students significantly below state average.
Averages for the 2020 tax year for zip code 72376, filed in 2021:
Average Adjusted Gross Income (AGI) in 2020: $53,203 (Individual Income Tax Returns)
Here:
$53,203
State:
$64,872
Salary/wage: $42,991 (reported on 80.6% of returns)
Here:
$42,991
State:
$50,644
(% of AGI for various income ranges: 1157.0% for AGIs below $25k, 3646.7% for AGIs $25k-50k, 6631.7% for AGIs $50k-75k, 12423.3% for AGIs $75k-100k, 19312.5% for AGIs $100k-200k)
Taxable interest for individuals: $508 (reported on 17.9% of returns)
This zip code:
$508
Arkansas:
$1,857
(% of AGI for various income ranges: 8.7% for AGIs $25k-50k, 16.7% for AGIs $50k-75k, 33.3% for AGIs $75k-100k, 70.0% for AGIs $100k-200k)
Ordinary dividends: $1,400 (reported on 6.0% of returns)
Here:
$1,400
State:
$21,681
(% of AGI for various income ranges: 186.7% for AGIs $75k-100k)
Net capital gain/loss in AGI: +$9,233 (reported on 4.5% of returns)
Here:
+$9,233
State:
+$22,815
(% of AGI for various income ranges: 461.7% for AGIs $50k-75k)
Profit/loss from business: +$9,725 (reported on 17.9% of returns)
Here:
+$9,725
State:
+$9,743
(% of AGI for various income ranges: 107.5% for AGIs below $25k, 93.3% for AGIs $25k-50k, 2706.7% for AGIs $75k-100k)
Taxable individual retirement arrangement distribution: $10,100 (reported on 4.5% of returns)
72376:
$10,100
Arkansas:
$18,502
(% of AGI for various income ranges: 202.0% for AGIs $25k-50k)
Total itemized deductions: $31,733 (reported on 4.5% of returns)
Here:
$31,733
State:
$52,840
(% of AGI for various income ranges: 3173.3% for AGIs $75k-100k)
Charity contributions: $9,100 (reported on 4.5% of returns)
Here:
$9,100
State:
$35,735
(% of AGI for various income ranges: 455.0% for AGIs $50k-75k)
Taxes paid: $7,067 (reported on 4.5% of returns)
72376:
$7,067
State:
$7,196
(% of AGI for various income ranges: 706.7% for AGIs $75k-100k)
Earned income credit: $2,400 (reported on 29.9% of returns)
Here:
$2,400
State:
$2,546
(% of AGI for various income ranges: 163.5% for AGIs below $25k, 102.0% for AGIs $25k-50k)
Percentage of individuals using paid preparers for their 2020 taxes: 91.0%
Here:
91%
State:
94%
(% for various income ranges: 92.0% for AGIs below $25k, 94.7% for AGIs $25k-50k, 88.9% for AGIs $50k-75k, 83.3% for AGIs $75k-100k, 87.5% for AGIs $100k-200k)
Averages for the 2012 tax year for zip code 72376, filed in 2013:
Average Adjusted Gross Income (AGI) in 2012: $43,588 (Individual Income Tax Returns)
Here:
$43,588
State:
$52,148
Salary/wage: $34,949 (reported on 84.7% of returns)
Here:
$34,949
State:
$41,669
(% of AGI for various income ranges: 76.9% for AGIs below $25k, 81.4% for AGIs $25k-50k, 78.0% for AGIs $50k-75k, 72.6% for AGIs $75k-100k, 47.3% for AGIs $100k-200k)
Taxable interest for individuals: $738 (reported on 18.1% of returns)
This zip code:
$738
Arkansas:
$1,648
(% of AGI for various income ranges: 0.2% for AGIs below $25k, 0.4% for AGIs $25k-50k, 0.5% for AGIs $100k-200k)
Ordinary dividends: $1,075 (reported on 5.6% of returns)
Here:
$1,075
State:
$20,675
Net capital gain/loss in AGI: +$1,400 (reported on 2.8% of returns)
Here:
+$1,400
State:
+$15,222
Profit/loss from business: +$10,233 (reported on 16.7% of returns)
Here:
+$10,233
State:
+$9,665
(% of AGI for various income ranges: 8.8% for AGIs below $25k, 4.0% for AGIs $25k-50k, 11.4% for AGIs $50k-75k)
Taxable individual retirement arrangement distribution: $7,700 (reported on 2.8% of returns)
72376:
$7,700
Arkansas:
$13,644
Total itemized deductions: $18,376 (20% of AGI, reported on 23.6% of returns)
Here:
$18,376
State:
$23,276
Here:
20.2% of AGI
State:
19.1% of AGI
(% of AGI for various income ranges: 11.2% for AGIs $25k-50k, 10.7% for AGIs $50k-75k, 12.1% for AGIs $75k-100k, 12.1% for AGIs $100k-200k)
Charity contributions: $5,479 (reported on 19.4% of returns)
Here:
$5,479
State:
$5,996
(% of AGI for various income ranges: 2.3% for AGIs $25k-50k, 2.3% for AGIs $50k-75k, 3.7% for AGIs $75k-100k, 3.1% for AGIs $100k-200k)
Taxes paid: $5,776 (reported on 23.6% of returns)
72376:
$5,776
State:
$7,941
(% of AGI for various income ranges: 2.0% for AGIs $25k-50k, 2.4% for AGIs $50k-75k, 3.4% for AGIs $75k-100k, 5.6% for AGIs $100k-200k)
Earned income credit: $2,642 (reported on 36.1% of returns)
Here:
$2,642
State:
$2,455
(% of AGI for various income ranges: 12.6% for AGIs below $25k, 1.7% for AGIs $25k-50k)
Percentage of individuals using paid preparers for their 2012 taxes: 61.1%
Here:
61%
State:
61%
(% for various income ranges: 54.5% for AGIs below $25k, 61.9% for AGIs $25k-50k, 62.5% for AGIs $50k-75k, 80.0% for AGIs $75k-100k, 80.0% for AGIs $100k-200k)
Averages for the 2004 tax year for zip code 72376, filed in 2005:
Average Adjusted Gross Income (AGI) in 2004: $32,739 (Individual Income Tax Returns)
Here:
$32,739
State:
$39,270
Salary/wage: $30,249 (reported on 86.6% of returns)
Here:
$30,249
State:
$34,079
(% of AGI for various income ranges: 80.1% for AGIs below $10k, 78.9% for AGIs $10k-25k, 86.5% for AGIs $25k-50k, 88.2% for AGIs $50k-75k, 82.4% for AGIs $75k-100k, 64.0% for AGIs over 100k)
Taxable interest for individuals: $1,007 (reported on 18.3% of returns)
This zip code:
$1,007
Arkansas:
$1,904
(% of AGI for various income ranges: 1.0% for AGIs below $10k, 1.1% for AGIs $10k-25k, 0.3% for AGIs $25k-50k, 0.1% for AGIs $50k-75k, 0.3% for AGIs $75k-100k, 1.0% for AGIs over 100k)
Taxable dividends: $4,021 (reported on 6.0% of returns)
Here:
$4,021
State:
$5,995
Profit/loss from business: +$6,063 (reported on 14.0% of returns)
Here:
+$6,063
State:
+$7,823
(% of AGI for various income ranges: 10.0% for AGIs below $10k, 6.6% for AGIs $10k-25k, 3.9% for AGIs $25k-50k, 0.3% for AGIs $50k-75k)
Total itemized deductions: $16,393 (23% of AGI, reported on 21.2% of returns)
Here:
$16,393
State:
$18,389
Here:
23.1% of AGI
State:
21.0% of AGI
(% of AGI for various income ranges: 6.7% for AGIs $10k-25k, 8.6% for AGIs $25k-50k, 15.2% for AGIs $50k-75k, 15.5% for AGIs $75k-100k, 11.2% for AGIs over 100k)
Charity contributions deductions: $4,027 (5% of AGI, reported on 18.4% of returns)
Here:
$4,027
State:
$4,725
Here:
5.4% of AGI
State:
5.1% of AGI
(% of AGI for various income ranges: 1.5% for AGIs $10k-25k, 1.7% for AGIs $25k-50k, 4.1% for AGIs $50k-75k, 2.6% for AGIs $75k-100k, 2.2% for AGIs over 100k)
Total tax: $4,900 (reported on 63.0% of returns)
72376:
$4,900
State:
$6,047
(% of AGI for various income ranges: 2.5% for AGIs below $10k, 3.2% for AGIs $10k-25k, 6.5% for AGIs $25k-50k, 7.8% for AGIs $50k-75k, 10.6% for AGIs $75k-100k, 20.0% for AGIs over 100k)
Earned income credit: $2,048 (reported on 36.4% of returns)
Here:
$2,048
State:
$1,909
Percentage of individuals using paid preparers for their 2004 taxes: 64.4%
Here:
64%
State:
67%
(% for various income ranges: 57.2% for AGIs below $10k, 70.6% for AGIs $10k-25k, 61.0% for AGIs $25k-50k, 61.1% for AGIs $50k-75k, 70.7% for AGIs $75k-100k, 79.3% for AGIs over 100k)
Household received Food Stamps/SNAP in the past 12 months: 55 Household did not receive Food Stamps/SNAP in the past 12 months: 585
Women who had a birth in the past 12 months: 12 (13 now married, 0 unmarried) Women who did not have a birth in the past 12 months: 227 (97 now married, 130 unmarried)
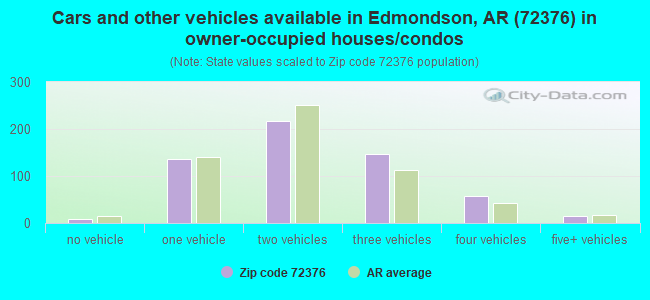
Housing units in zip code 72376 with a mortgage: 144 Houses without a mortgage: 25
Median monthly owner costs for units with a mortgage: $1,293 Median monthly owner costs for units without a mortgage: $399
Residents with income below the poverty level in 2022:
This zip code:
17.1%
Whole state:
16.8%
Residents with income below 50% of the poverty level in 2022:
This zip code:
15.7%
Whole state:
8.5%
Median number of rooms in houses and condos:
Here:
5.5
State:
6.1
Median number of rooms in apartments:
Here:
4.8
State:
4.3
Notable locations in this zip code not listed on our city pages
Notable locations in zip code 72376: Ninetysix Landing (A), Womacks Landing (B), Biggs Landing (C), Anthonyville Volunteer Fire Department (D), Proctor Volunteer Fire Department (E), Edmondson Volunteer Fire Department (F), Edmondson Police Department (G). Display/hide their locations on the map
Churches in zip code 72376 include: Truevine Church (A), Bell Meade Church (B), Burning Bush Church (C), Church of God in Christ (D), Lake Grove Church (E), Mount Olive Church (F), New Bethel Church (G), New Salem Church (H), Saint Johns Church (I). Display/hide their locations on the map
Size of family households: 213 2-persons, 126 3-persons, 31 4-persons, 4 5-persons, 19 6-persons, 22 7-or-more-persons
Size of nonfamily households: 217 1-person, 10 3-persons
183 married couples with children.
16 single-parent households (9 men, 7 women).
99.6% of residents of 72376 zip code speak English at home.
0.5% of residents speak Asian or Pacific Island language at home (100% very well).
Foreign born population: 10 (0.7%) (100.0% of them are naturalized citizens)
This zip code:
0.7%
Whole state:
5.1%
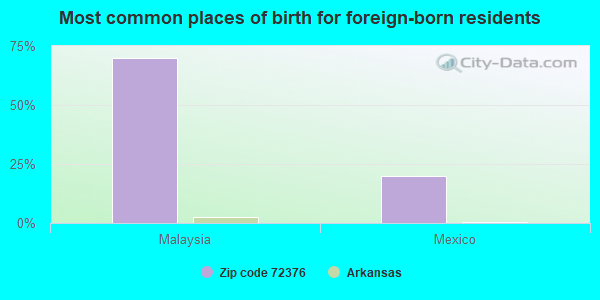
70%Malaysia
20%Mexico
35%American
5%Irish
5%German
3%English
3%Scotch-Irish
0%Welsh
0%Italian
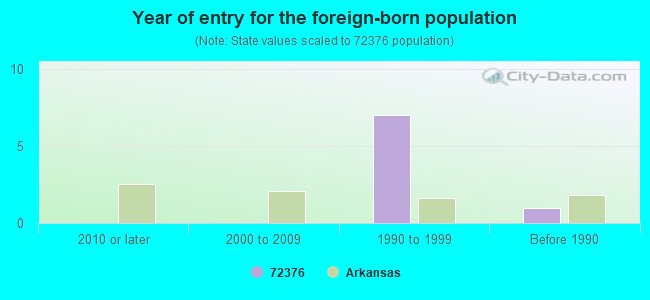
Year of entry for the foreign-born population
02010 or later
02000 to 2009
71990 to 1999
1Before 1990
Facilities with environmental interests located in this zip code:
LEHI AREA HQ (HWY 70 in PROCTOR, AR)
(Integrated Compliance Information System) - ICIS-06-1998-0884, FORMAL ENFORCEMENT ACTION Business SIC classification: HIGHWAY AND STREET CONSTRUCTION, EXCEPT ELEVATED HIGHWAYS
EXXON CO USA 55694 (I-40 & HWY 79 in PROCTOR, AR)
(Resource Conservation and Recovery Act (tracking hazardous waste))
JACKSON INDUSTRIAL COATINGS INC (12748 US HWY 70 in PROCTOR, AR)
Conditionally Exempt Small Quantity Generators, less than 100 kg/month of hazardous waste (Resource Conservation and Recovery Act (tracking hazardous waste)) - notification Organizations: JACKSON JAMESE (CONTACT/OWNER)
Housing units lacking complete plumbing facilities: 4.1% Housing units lacking complete kitchen facilities: 1.9%
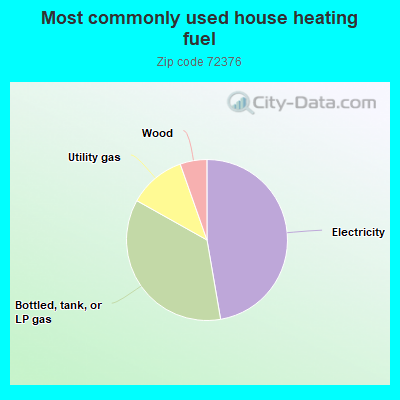
47.4%Electricity
35.9%Bottled, tank, or LP gas
11.5%Utility gas
5.4%Wood
Population in 1990: 953. Population change in the 1990s: +1,173 (+123.1%).
Place of birth for U.S.-born residents:
This state: 738
Midwest: 74
South: 691
West: 6
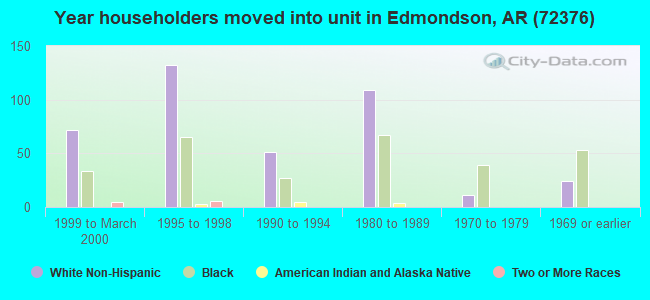
59% of the 72376 zip code residents lived in the same house 5 years ago. Out of people who lived in different houses, 68% lived in this county. Out of people who lived in different counties, 50% lived in Arkansas.
91% of the 72376 zip code residents lived in the same house 1 year ago. Out of people who lived in different houses, 41% moved from this county. Out of people who lived in different houses, 4% moved from different county within same state. Out of people who lived in different houses, 62% moved from different state.
Private vs. public school enrollment:
Students in private schools in grades 1 to 8 (elementary and middle school): 38
Here:
52.4%
Arkansas:
10.5%
Students in private schools in grades 9 to 12 (high school): 49
Here:
50.0%
Arkansas:
8.7%
Students in private undergraduate colleges: 6
Here:
34.5%
Arkansas:
19.4%
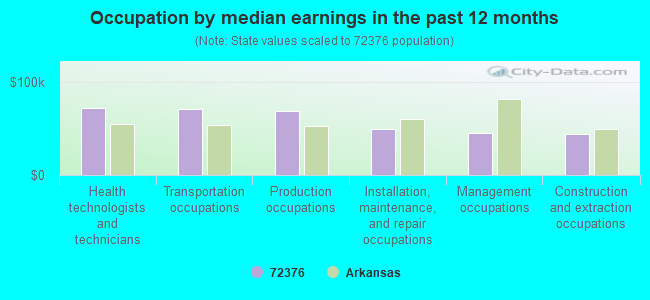
Occupation by median earnings in the past 12 months ($)
72,505Health technologists and technicians
70,707Transportation occupations
68,951Production occupations
49,989Installation, maintenance, and repair occupations
45,536Management occupations
44,423Construction and extraction occupations
Top industries in this zip code by the number of employees in 2005:
Professional, Scientific, and Technical Services: Research and Development in the Physical, Engineering, and Life Sciences (10-19 employees: 1 establishment, 1-4 employees: 1 establishment)
Wholesale Trade: Grain and Field Bean Merchant Wholesalers (1-4: 1)
Health Care and Social Assistance: Other Residential Care Facilities (1-4: 1)
Construction: Site Preparation Contractors (1-4: 1)
Fatal accident statistics in 2014:
Fatal accident count: 1
Vehicles involved in fatal accidents: 1
Fatal accidents caused by drunken drivers: 0
Fatalities: 1
Persons involved in fatal accidents: 1
Pedestrians involved in fatal accidents: 0
Fatal accident statistics in 2011:
Fatal accident count: 2
Vehicles involved in fatal accidents: 2
Fatal accidents caused by drunken drivers: 2
Fatalities: 2
Persons involved in fatal accidents: 2
Pedestrians involved in fatal accidents: 0
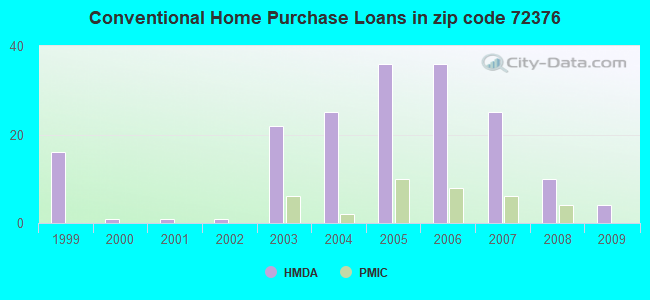
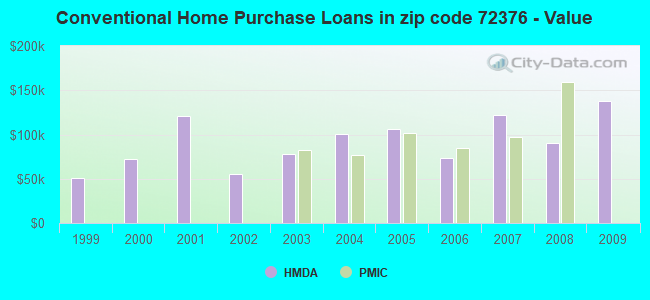
Home Mortgage Disclosure Act Aggregated Statistics For Year 2009 (Based on 8 partial tracts)
A) FHA, FSA/RHS & VA Home Purchase Loans
B) Conventional Home Purchase Loans
C) Refinancings
D) Home Improvement Loans
F) Non-occupant Loans on < 5 Family Dwellings (A B C & D)
G) Loans On Manufactured Home Dwelling (A B C & D)
Number
Average Value
Number
Average Value
Number
Average Value
Number
Average Value
Number
Average Value
Number
Average Value
LOANS ORIGINATED
7
$76,974
4
$138,345
24
$165,884
4
$28,830
7
$211,086
2
$35,250
APPLICATIONS APPROVED, NOT ACCEPTED
2
$114,540
0
$0
0
$0
0
$0
0
$0
0
$0
APPLICATIONS DENIED
1
$48,280
5
$80,988
19
$137,153
7
$5,666
4
$296,505
3
$72,373
APPLICATIONS WITHDRAWN
1
$99,600
1
$117,840
13
$107,002
0
$0
1
$156,190
0
$0
FILES CLOSED FOR INCOMPLETENESS
0
$0
2
$82,355
0
$0
0
$0
1
$56,800
1
$107,910
Aggregated Statistics For Year 2008 (Based on 8 partial tracts)
A) FHA, FSA/RHS & VA Home Purchase Loans
B) Conventional Home Purchase Loans
C) Refinancings
D) Home Improvement Loans
F) Non-occupant Loans on < 5 Family Dwellings (A B C & D)
G) Loans On Manufactured Home Dwelling (A B C & D)
Number
Average Value
Number
Average Value
Number
Average Value
Number
Average Value
Number
Average Value
Number
Average Value
LOANS ORIGINATED
9
$100,226
10
$90,586
16
$135,614
9
$25,097
5
$97,988
5
$67,594
APPLICATIONS APPROVED, NOT ACCEPTED
0
$0
6
$74,393
2
$35,105
1
$10,100
0
$0
5
$78,766
APPLICATIONS DENIED
1
$168,820
15
$55,515
23
$108,149
13
$18,793
7
$56,120
15
$52,675
APPLICATIONS WITHDRAWN
0
$0
3
$60,383
11
$124,705
1
$34,080
1
$50,090
0
$0
FILES CLOSED FOR INCOMPLETENESS
1
$79,510
0
$0
1
$142,940
0
$0
0
$0
0
$0
Aggregated Statistics For Year 2007 (Based on 8 partial tracts)
A) FHA, FSA/RHS & VA Home Purchase Loans
B) Conventional Home Purchase Loans
C) Refinancings
D) Home Improvement Loans
F) Non-occupant Loans on < 5 Family Dwellings (A B C & D)
G) Loans On Manufactured Home Dwelling (A B C & D)
Number
Average Value
Number
Average Value
Number
Average Value
Number
Average Value
Number
Average Value
Number
Average Value
LOANS ORIGINATED
9
$76,412
25
$121,557
28
$127,143
9
$20,294
9
$168,484
11
$47,112
APPLICATIONS APPROVED, NOT ACCEPTED
3
$56,960
5
$57,632
10
$97,549
1
$21,090
1
$81,170
7
$41,441
APPLICATIONS DENIED
2
$82,830
19
$108,841
16
$136,764
5
$18,674
2
$199,340
10
$50,817
APPLICATIONS WITHDRAWN
1
$55,490
0
$0
6
$57,677
0
$0
0
$0
0
$0
FILES CLOSED FOR INCOMPLETENESS
0
$0
2
$237,490
4
$136,068
0
$0
0
$0
0
$0
Aggregated Statistics For Year 2006 (Based on 8 partial tracts)
A) FHA, FSA/RHS & VA Home Purchase Loans
B) Conventional Home Purchase Loans
C) Refinancings
D) Home Improvement Loans
F) Non-occupant Loans on < 5 Family Dwellings (A B C & D)
G) Loans On Manufactured Home Dwelling (A B C & D)
Number
Average Value
Number
Average Value
Number
Average Value
Number
Average Value
Number
Average Value
Number
Average Value
LOANS ORIGINATED
6
$87,498
36
$73,942
25
$117,676
13
$37,237
11
$97,351
10
$49,122
APPLICATIONS APPROVED, NOT ACCEPTED
0
$0
8
$62,662
1
$323,930
0
$0
2
$47,330
4
$51,065
APPLICATIONS DENIED
1
$68,720
23
$69,957
16
$88,102
16
$17,327
5
$83,358
17
$49,061
APPLICATIONS WITHDRAWN
1
$84,300
3
$90,243
9
$84,158
0
$0
0
$0
0
$0
FILES CLOSED FOR INCOMPLETENESS
0
$0
1
$138,960
0
$0
0
$0
0
$0
0
$0
Aggregated Statistics For Year 2005 (Based on 8 partial tracts)
A) FHA, FSA/RHS & VA Home Purchase Loans
B) Conventional Home Purchase Loans
C) Refinancings
D) Home Improvement Loans
F) Non-occupant Loans on < 5 Family Dwellings (A B C & D)
G) Loans On Manufactured Home Dwelling (A B C & D)
Number
Average Value
Number
Average Value
Number
Average Value
Number
Average Value
Number
Average Value
Number
Average Value
LOANS ORIGINATED
10
$87,305
36
$106,593
41
$109,204
6
$28,787
24
$102,015
5
$49,270
APPLICATIONS APPROVED, NOT ACCEPTED
1
$65,320
17
$79,214
15
$91,233
0
$0
4
$114,065
7
$54,276
APPLICATIONS DENIED
4
$85,008
22
$64,725
45
$98,996
14
$28,351
9
$105,900
13
$46,124
APPLICATIONS WITHDRAWN
0
$0
17
$98,649
12
$102,303
1
$39,760
5
$95,440
1
$46,380
FILES CLOSED FOR INCOMPLETENESS
0
$0
0
$0
11
$88,674
0
$0
0
$0
2
$68,155
Aggregated Statistics For Year 2004 (Based on 8 partial tracts)
A) FHA, FSA/RHS & VA Home Purchase Loans
B) Conventional Home Purchase Loans
C) Refinancings
D) Home Improvement Loans
F) Non-occupant Loans on < 5 Family Dwellings (A B C & D)
G) Loans On Manufactured Home Dwelling (A B C & D)
Number
Average Value
Number
Average Value
Number
Average Value
Number
Average Value
Number
Average Value
Number
Average Value
LOANS ORIGINATED
13
$89,927
25
$100,276
52
$119,730
9
$17,390
19
$145,066
8
$50,395
APPLICATIONS APPROVED, NOT ACCEPTED
0
$0
8
$101,928
12
$72,292
0
$0
3
$78,253
2
$53,955
APPLICATIONS DENIED
3
$112,270
14
$70,039
32
$95,307
9
$44,413
2
$102,055
8
$49,534
APPLICATIONS WITHDRAWN
0
$0
10
$92,056
15
$99,533
1
$47,330
2
$81,410
0
$0
FILES CLOSED FOR INCOMPLETENESS
0
$0
1
$139,150
7
$77,360
0
$0
0
$0
0
$0
Aggregated Statistics For Year 2003 (Based on 8 partial tracts)
A) FHA, FSA/RHS & VA Home Purchase Loans
B) Conventional Home Purchase Loans
C) Refinancings
D) Home Improvement Loans
F) Non-occupant Loans on < 5 Family Dwellings (A B C & D)
Number
Average Value
Number
Average Value
Number
Average Value
Number
Average Value
Number
Average Value
LOANS ORIGINATED
10
$76,287
22
$77,970
65
$105,452
8
$10,051
14
$126,416
APPLICATIONS APPROVED, NOT ACCEPTED
0
$0
6
$82,812
21
$64,561
0
$0
1
$49,070
APPLICATIONS DENIED
4
$105,115
33
$47,074
47
$88,867
19
$13,316
4
$52,625
APPLICATIONS WITHDRAWN
1
$83,410
5
$87,830
29
$87,991
1
$9,470
2
$61,410
FILES CLOSED FOR INCOMPLETENESS
0
$0
1
$135,000
4
$58,458
0
$0
0
$0
Aggregated Statistics For Year 2002 (Based on 2 partial tracts)
B) Conventional Home Purchase Loans
C) Refinancings
D) Home Improvement Loans
Number
Average Value
Number
Average Value
Number
Average Value
LOANS ORIGINATED
1
$55,650
2
$73,675
0
$0
APPLICATIONS APPROVED, NOT ACCEPTED
0
$0
0
$0
0
$0
APPLICATIONS DENIED
2
$57,230
1
$62,820
1
$8,850
APPLICATIONS WITHDRAWN
0
$0
0
$0
0
$0
FILES CLOSED FOR INCOMPLETENESS
0
$0
0
$0
0
$0
Aggregated Statistics For Year 2001 (Based on 2 partial tracts)
B) Conventional Home Purchase Loans
C) Refinancings
D) Home Improvement Loans
F) Non-occupant Loans on < 5 Family Dwellings (A B C & D)
Number
Average Value
Number
Average Value
Number
Average Value
Number
Average Value
LOANS ORIGINATED
1
$121,000
3
$67,807
2
$6,325
0
$0
APPLICATIONS APPROVED, NOT ACCEPTED
1
$37,520
0
$0
0
$0
0
$0
APPLICATIONS DENIED
2
$38,260
1
$51,860
1
$13,490
1
$31,200
APPLICATIONS WITHDRAWN
0
$0
1
$38,790
0
$0
0
$0
FILES CLOSED FOR INCOMPLETENESS
0
$0
0
$0
0
$0
0
$0
Aggregated Statistics For Year 2000 (Based on 2 partial tracts)
A) FHA, FSA/RHS & VA Home Purchase Loans
B) Conventional Home Purchase Loans
C) Refinancings
D) Home Improvement Loans
Number
Average Value
Number
Average Value
Number
Average Value
Number
Average Value
LOANS ORIGINATED
1
$44,060
1
$71,880
1
$64,080
1
$6,320
APPLICATIONS APPROVED, NOT ACCEPTED
0
$0
0
$0
0
$0
0
$0
APPLICATIONS DENIED
0
$0
1
$35,630
1
$56,710
0
$0
APPLICATIONS WITHDRAWN
0
$0
1
$20,240
0
$0
0
$0
FILES CLOSED FOR INCOMPLETENESS
0
$0
0
$0
0
$0
0
$0
Aggregated Statistics For Year 1999 (Based on 3 partial tracts)
A) FHA, FSA/RHS & VA Home Purchase Loans
B) Conventional Home Purchase Loans
C) Refinancings
D) Home Improvement Loans
F) Non-occupant Loans on < 5 Family Dwellings (A B C & D)
2002 - 2017 National Fire Incident Reporting System (NFIRS) incidents
Based on the data from the years 2002 - 2017 the average number of fires per year is 17. The highest number of fire incidents - 50 took place in 2006, and the least - 0 in 2016. The data has a decreasing trend.
When looking into fire subcategories, the most incidents belonged to: Outside Fires (44.5%), and Structure Fires (32.0%).
Fire incident types reported to NFIRS in Zip Code 72376

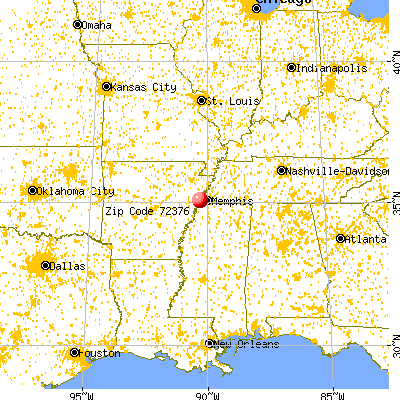


 Nearest zip codes: 72332, 72301, 72327, 38109, 72364, 72346.


 Based on the data from the years 2002 - 2017 the average number of fires per year is 17. The highest number of fire incidents - 50 took place in 2006, and the least - 0 in 2016. The data has a decreasing trend.
 When looking into fire subcategories, the most incidents belonged to: Outside Fires (44.5%), and Structure Fires (32.0%).