Estimated zip code population in 2022: 5,896 Zip code population in 2010: 5,376 Zip code population in 2000: 4,238
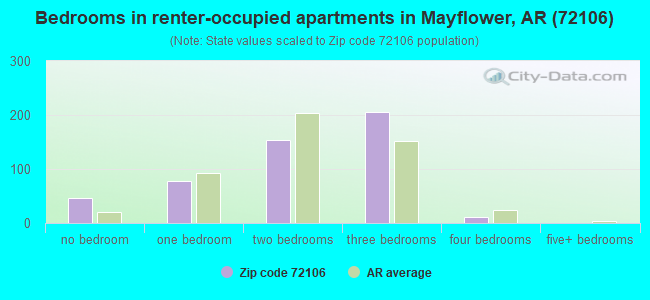
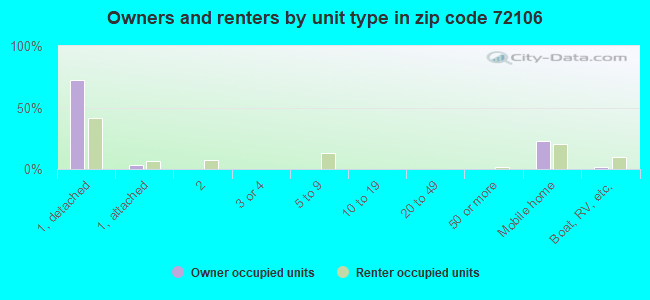
Houses and condos: 2,639 Renter-occupied apartments: 501
% of renters here:
22%
State:
34%
March 2022 cost of living index in zip code 72106: 79.7 (low, U.S. average is 100)
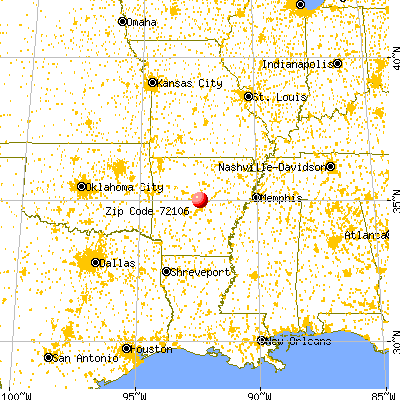
Land area: 45.9 sq. mi. Water area: 6.7 sq. mi.
Population density: 128 people per square mile
(very low).
OSM Map
General Map
Google Map
MSN Map
OSM Map
General Map
Google Map
MSN Map
OSM Map
General Map
Google Map
MSN Map
OSM Map
General Map
Google Map
MSN Map
Please wait while loading the map...
Real estate property taxes paid for housing units in 2022:
This zip code:
0.6% ($984)
Arkansas:
0.5% ($977)
Median real estate property taxes paid for housing units with mortgages in 2022: $624 (0.4%) Median real estate property taxes paid for housing units with no mortgage in 2022: $1,195 (0.7%)
Business Search- 14 Million verified businesses
Males: 3,150
(53.4%)
Females: 2,745
(46.6%)
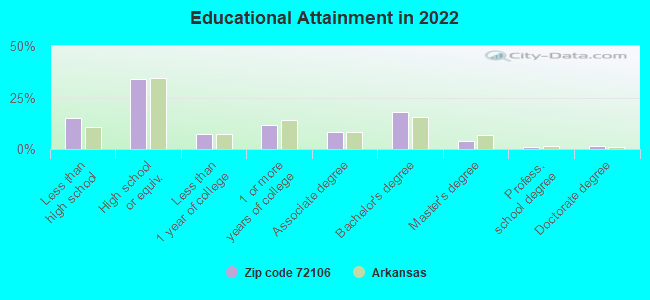
For population 25 years and over in 72106:
High school or higher: 84.9%
Bachelor's degree or higher: 23.9%
Graduate or professional degree: 6.2%
Unemployed: 7.9%
Mean travel time to work (commute): 26.5 minutes
For population 15 years and over in 72106:
Never married: 23.4%
Now married: 56.7%
Separated: 3.1%
Widowed: 3.3%
Divorced: 13.6%
Zip code 72106 compared to state average:
Unemployed percentage above state average.
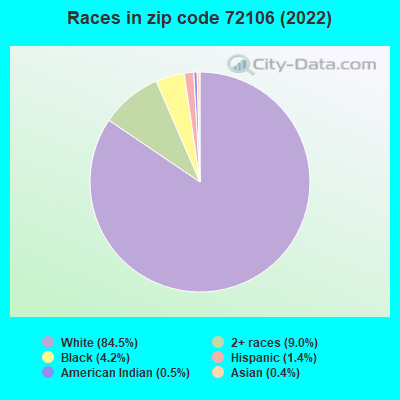
Black race population percentage significantly below state average.
Hispanic race population percentage significantly below state average.
Averages for the 2020 tax year for zip code 72106, filed in 2021:
Average Adjusted Gross Income (AGI) in 2020: $57,150 (Individual Income Tax Returns)
Here:
$57,150
State:
$64,872
Salary/wage: $50,462 (reported on 80.8% of returns)
Here:
$50,462
State:
$50,644
(% of AGI for various income ranges: 1105.6% for AGIs below $25k, 3724.2% for AGIs $25k-50k, 7044.2% for AGIs $50k-75k, 9131.8% for AGIs $75k-100k, 18841.9% for AGIs $100k-200k)
Taxable interest for individuals: $848 (reported on 20.8% of returns)
This zip code:
$848
Arkansas:
$1,857
(% of AGI for various income ranges: 4.9% for AGIs below $25k, 16.0% for AGIs $25k-50k, 12.7% for AGIs $50k-75k, 61.2% for AGIs $75k-100k, 100.6% for AGIs $100k-200k)
Ordinary dividends: $3,259 (reported on 11.2% of returns)
Here:
$3,259
State:
$21,681
(% of AGI for various income ranges: 10.5% for AGIs below $25k, 22.3% for AGIs $25k-50k, 13.8% for AGIs $50k-75k, 36.5% for AGIs $75k-100k, 233.8% for AGIs $100k-200k)
Net capital gain/loss in AGI: +$8,618 (reported on 11.7% of returns)
Here:
+$8,618
State:
+$22,815
(% of AGI for various income ranges: 3.1% for AGIs below $25k, 35.8% for AGIs $25k-50k, 68.1% for AGIs $50k-75k, 132.4% for AGIs $75k-100k, 597.5% for AGIs $100k-200k)
Profit/loss from business: +$5,861 (reported on 18.3% of returns)
Here:
+$5,861
State:
+$9,743
(% of AGI for various income ranges: 212.7% for AGIs below $25k, 36.7% for AGIs $25k-50k, 140.0% for AGIs $50k-75k, 118.2% for AGIs $75k-100k, 364.4% for AGIs $100k-200k)
Taxable individual retirement arrangement distribution: $21,950 (reported on 7.5% of returns)
72106:
$21,950
Arkansas:
$18,502
(% of AGI for various income ranges: 44.9% for AGIs below $25k, 78.5% for AGIs $25k-50k, 129.2% for AGIs $50k-75k, 336.5% for AGIs $75k-100k, 1500.6% for AGIs $100k-200k)
Total itemized deductions: $28,246 (reported on 5.4% of returns)
Here:
$28,246
State:
$52,840
(% of AGI for various income ranges: 426.2% for AGIs $50k-75k, 873.8% for AGIs $100k-200k)
Charity contributions: $15,122 (reported on 3.8% of returns)
Here:
$15,122
State:
$35,735
(% of AGI for various income ranges: 87.3% for AGIs $50k-75k, 313.8% for AGIs $100k-200k)
Taxes paid: $6,377 (reported on 5.4% of returns)
72106:
$6,377
State:
$7,196
(% of AGI for various income ranges: 80.8% for AGIs $50k-75k, 231.9% for AGIs $100k-200k)
Earned income credit: $2,313 (reported on 19.6% of returns)
Here:
$2,313
State:
$2,546
(% of AGI for various income ranges: 116.6% for AGIs below $25k, 83.1% for AGIs $25k-50k)
Percentage of individuals using paid preparers for their 2020 taxes: 94.6%
Here:
95%
State:
94%
(% for various income ranges: 92.6% for AGIs below $25k, 96.7% for AGIs $25k-50k, 94.7% for AGIs $50k-75k, 96.0% for AGIs $75k-100k, 93.3% for AGIs $100k-200k, 100.0% for AGIs over 200k)
Averages for the 2012 tax year for zip code 72106, filed in 2013:
Average Adjusted Gross Income (AGI) in 2012: $46,863 (Individual Income Tax Returns)
Here:
$46,863
State:
$52,148
Salary/wage: $41,780 (reported on 85.8% of returns)
Here:
$41,780
State:
$41,669
(% of AGI for various income ranges: 72.8% for AGIs below $25k, 81.7% for AGIs $25k-50k, 80.9% for AGIs $50k-75k, 79.4% for AGIs $75k-100k, 78.3% for AGIs $100k-200k, 49.4% for AGIs over 200k)
Taxable interest for individuals: $786 (reported on 24.6% of returns)
This zip code:
$786
Arkansas:
$1,648
(% of AGI for various income ranges: 0.6% for AGIs below $25k, 0.6% for AGIs $25k-50k, 0.4% for AGIs $50k-75k, 0.2% for AGIs $75k-100k, 0.6% for AGIs $100k-200k)
Ordinary dividends: $2,232 (reported on 10.8% of returns)
Here:
$2,232
State:
$20,675
(% of AGI for various income ranges: 0.5% for AGIs below $25k, 0.6% for AGIs $25k-50k, 0.4% for AGIs $50k-75k, 0.1% for AGIs $75k-100k, 1.2% for AGIs $100k-200k)
Net capital gain/loss in AGI: +$2,439 (reported on 7.8% of returns)
Here:
+$2,439
State:
+$15,222
(% of AGI for various income ranges: 0.1% for AGIs below $25k, 0.2% for AGIs $50k-75k, 1.7% for AGIs $100k-200k)
Profit/loss from business: +$7,915 (reported on 16.8% of returns)
Here:
+$7,915
State:
+$9,665
(% of AGI for various income ranges: 9.5% for AGIs below $25k, 2.8% for AGIs $25k-50k, 2.5% for AGIs $50k-75k, 2.3% for AGIs $75k-100k, 1.4% for AGIs $100k-200k)
Taxable individual retirement arrangement distribution: $12,165 (reported on 7.3% of returns)
72106:
$12,165
Arkansas:
$13,644
(% of AGI for various income ranges: 3.1% for AGIs below $25k, 1.8% for AGIs $25k-50k, 1.5% for AGIs $50k-75k, 2.4% for AGIs $75k-100k, 2.1% for AGIs $100k-200k)
Total itemized deductions: $18,625 (21% of AGI, reported on 26.3% of returns)
Here:
$18,625
State:
$23,276
Here:
20.9% of AGI
State:
19.1% of AGI
(% of AGI for various income ranges: 5.1% for AGIs below $25k, 7.1% for AGIs $25k-50k, 9.7% for AGIs $50k-75k, 13.6% for AGIs $75k-100k, 15.2% for AGIs $100k-200k, 9.1% for AGIs over 200k)
Charity contributions: $4,595 (reported on 19.0% of returns)
Here:
$4,595
State:
$5,996
(% of AGI for various income ranges: 0.8% for AGIs below $25k, 1.0% for AGIs $25k-50k, 1.8% for AGIs $50k-75k, 2.5% for AGIs $75k-100k, 2.9% for AGIs $100k-200k, 1.6% for AGIs over 200k)
Taxes paid: $6,247 (reported on 25.9% of returns)
72106:
$6,247
State:
$7,941
(% of AGI for various income ranges: 0.9% for AGIs below $25k, 1.8% for AGIs $25k-50k, 2.6% for AGIs $50k-75k, 4.5% for AGIs $75k-100k, 5.7% for AGIs $100k-200k, 4.8% for AGIs over 200k)
Earned income credit: $2,193 (reported on 25.0% of returns)
Here:
$2,193
State:
$2,455
(% of AGI for various income ranges: 8.1% for AGIs below $25k, 1.4% for AGIs $25k-50k)
Percentage of individuals using paid preparers for their 2012 taxes: 62.1%
Here:
62%
State:
61%
(% for various income ranges: 58.7% for AGIs below $25k, 60.7% for AGIs $25k-50k, 67.6% for AGIs $50k-75k, 65.2% for AGIs $75k-100k, 64.7% for AGIs $100k-200k, 100.0% for AGIs over 200k)
Averages for the 2004 tax year for zip code 72106, filed in 2005:
Average Adjusted Gross Income (AGI) in 2004: $35,180 (Individual Income Tax Returns)
Here:
$35,180
State:
$39,270
Salary/wage: $33,210 (reported on 85.4% of returns)
Here:
$33,210
State:
$34,079
(% of AGI for various income ranges: 121.5% for AGIs below $10k, 76.0% for AGIs $10k-25k, 83.8% for AGIs $25k-50k, 85.0% for AGIs $50k-75k, 85.2% for AGIs $75k-100k, 65.7% for AGIs over 100k)
Taxable interest for individuals: $1,005 (reported on 29.1% of returns)
This zip code:
$1,005
Arkansas:
$1,904
(% of AGI for various income ranges: 3.1% for AGIs below $10k, 1.3% for AGIs $10k-25k, 0.7% for AGIs $25k-50k, 0.7% for AGIs $50k-75k, 0.4% for AGIs $75k-100k, 0.9% for AGIs over 100k)
Taxable dividends: $1,530 (reported on 11.6% of returns)
Here:
$1,530
State:
$5,995
(% of AGI for various income ranges: 2.1% for AGIs below $10k, 0.1% for AGIs $10k-25k, 0.4% for AGIs $25k-50k, 0.3% for AGIs $50k-75k, 0.2% for AGIs $75k-100k, 1.2% for AGIs over 100k)
Net capital gain/loss: +$5,243 (reported on 9.6% of returns)
Here:
+$5,243
State:
+$10,430
(% of AGI for various income ranges: 2.3% for AGIs below $10k, 0.5% for AGIs $10k-25k, 0.0% for AGIs $25k-50k, 0.3% for AGIs $50k-75k, -0.2% for AGIs $75k-100k, 6.7% for AGIs over 100k)
Profit/loss from business: +$5,896 (reported on 17.5% of returns)
Here:
+$5,896
State:
+$7,823
(% of AGI for various income ranges: 7.2% for AGIs below $10k, 7.6% for AGIs $10k-25k, 3.5% for AGIs $25k-50k, 0.9% for AGIs $50k-75k, 0.7% for AGIs $75k-100k, 2.1% for AGIs over 100k)
IRA payment deduction: $2,588 (reported on 0.8% of returns)
72106:
$2,588
Arkansas:
$3,204
Total itemized deductions: $16,180 (23% of AGI, reported on 22.7% of returns)
Here:
$16,180
State:
$18,389
Here:
23.2% of AGI
State:
21.0% of AGI
(% of AGI for various income ranges: 6.8% for AGIs below $10k, 5.6% for AGIs $10k-25k, 7.7% for AGIs $25k-50k, 10.6% for AGIs $50k-75k, 13.5% for AGIs $75k-100k, 16.2% for AGIs over 100k)
Charity contributions deductions: $2,952 (4% of AGI, reported on 17.5% of returns)
Here:
$2,952
State:
$4,725
Here:
4.0% of AGI
State:
5.1% of AGI
(% of AGI for various income ranges: 0.7% for AGIs $10k-25k, 1.2% for AGIs $25k-50k, 1.6% for AGIs $50k-75k, 1.9% for AGIs $75k-100k, 2.1% for AGIs over 100k)
Total tax: $4,225 (reported on 74.2% of returns)
72106:
$4,225
State:
$6,047
(% of AGI for various income ranges: 3.5% for AGIs below $10k, 4.3% for AGIs $10k-25k, 6.3% for AGIs $25k-50k, 8.7% for AGIs $50k-75k, 11.0% for AGIs $75k-100k, 15.5% for AGIs over 100k)
Earned income credit: $1,728 (reported on 20.4% of returns)
Here:
$1,728
State:
$1,909
Percentage of individuals using paid preparers for their 2004 taxes: 65.6%
Here:
66%
State:
67%
(% for various income ranges: 61.8% for AGIs below $10k, 65.8% for AGIs $10k-25k, 68.7% for AGIs $25k-50k, 64.2% for AGIs $50k-75k, 60.7% for AGIs $75k-100k, 73.1% for AGIs over 100k)
Likely homosexual households (counted as self-reported same-sex unmarried-partner households)
Lesbian couples: 0.0% of all households
Gay men: 0.3% of all households
Household received Food Stamps/SNAP in the past 12 months: 232 Household did not receive Food Stamps/SNAP in the past 12 months: 2,033
Women who had a birth in the past 12 months: 59 (61 now married, 0 unmarried) Women who did not have a birth in the past 12 months: 1,170 (642 now married, 530 unmarried)
Housing units in zip code 72106 with a mortgage: 904 (35 second mortgage, 34 both second mortgage and home equity loan) Median monthly owner costs for units with a mortgage: $1,073 Median monthly owner costs for units without a mortgage: $516
Residents with income below the poverty level in 2022:
This zip code:
13.1%
Whole state:
16.8%
Residents with income below 50% of the poverty level in 2022:
This zip code:
6.1%
Whole state:
8.5%
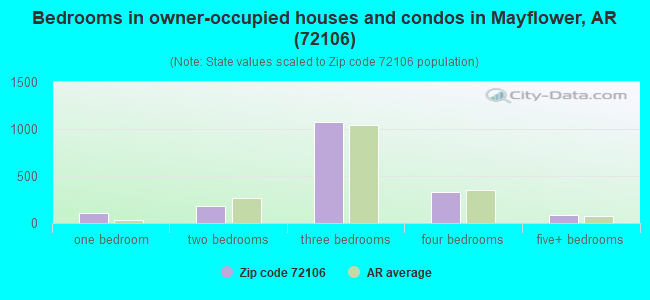
Median number of rooms in houses and condos:
Here:
6.0
State:
6.1
Median number of rooms in apartments:
Here:
4.8
State:
4.3
Notable locations in this zip code not listed on our city pages
Notable locations in zip code 72106: Sport Haven Landing (A), Pooles Landing (B), Paradise Landing (C), Hi-way Landing (D), Edwards Landing (E), Crafton Landing (F), Ballard Landing (G), Mayflower Police Department (H), Arkansas Game and Fish Enforcement (I), Mayflower Volunteer Fire Department (J). Display/hide their locations on the map
Churches in zip code 72106 include: Troutman Chapel (A), Conway Lake Church (B), Northside Church (C), Jones Hill Baptist Church (D), White City Church (E), Bibleway Church (F). Display/hide their locations on the map
Lakes, reservoirs, and swamps: Boone Pond (A), Grassy Lake (B), Stone Lake (C), Jewell Lake (D), Wisley Lake (E), Browns Lake (F), Lake Conway (G), Davis Lake (H). Display/hide their locations on the map
Streams, rivers, and creeks: Tucker Creek (A), Pierce Creek (B), Beaverdam Creek (C), Beaver Creek (D), Tupelo Bayou (E). Display/hide their locations on the map
Parks in zip code 72106 include: Pierce Creek Public Boat Landing (1), Bell Slough State Wildlife Management Area (2), Fletcher Bend Public Use Area (3). Display/hide their locations on the map
Size of family households: 730 2-persons, 418 3-persons, 338 4-persons, 98 5-persons, 9 6-persons, 40 7-or-more-persons
Size of nonfamily households: 466 1-person, 124 2-persons, 9 3-persons
697 married couples with children.
93 single-parent households (31 men, 62 women).
97.9% of residents of 72106 zip code speak English at home.
1.0% of residents speak Spanish at home (100% very well).
0.2% of residents speak other Indo-European language at home (69% very well, 31% well).
0.4% of residents speak Asian or Pacific Island language at home (100% very well).
0.1% of residents speak other language at home (100% not well).
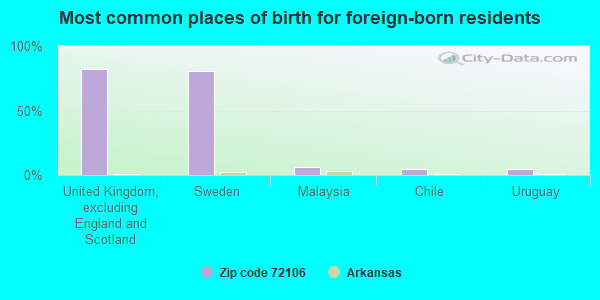
Foreign born population: 319 (5.4%) (15.1% of them are naturalized citizens)
This zip code:
5.4%
Whole state:
5.1%
82%United Kingdom, excluding England and Scotland
80%Sweden
7%Malaysia
4%Chile
4%Uruguay
22%English
12%American
2%Italian
2%German
1%British
1%Irish
1%African
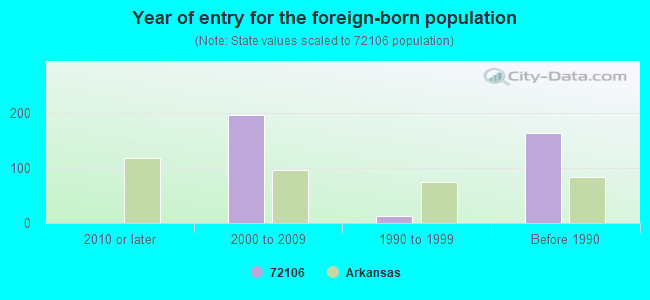
Year of entry for the foreign-born population
02010 or later
1972000 to 2009
121990 to 1999
165Before 1990
Facilities with environmental interests located in this zip code:
SIMPSON, TRESSIE/RESIDENCE (21 SERENITY LANE in MAYFLOWER, AR)
National Pollutant Discharge Elimination System NON-MAJOR (Tracking pollutant discharge elimination systems) - permit STATE MASTER (PDS) - WATER-ARG550289, National Pollutant Discharge Elimination System Permit Business SIC classification: SEWERAGE SYSTEMS Alternative names: TRESSIE SIMPSON, TRESSIE SIMPSON RESIDENCE
GRASSY LAKE APARTMENTS (#11 GRASSY LAKE ROAD in MAYFLOWER, AR)
National Pollutant Discharge Elimination System NON-MAJOR (Tracking pollutant discharge elimination systems) - permit Business SIC classification: ROOMING AND BOARDING HOUSES
CAMP JOSEPH T. ROBINSON (NORTH OF HWY. 89 in NORTH LITTLE ROCK, AR)
SUPERFUND (Superfund database)
GILBERT CENTRAL CORP. - AZTEC 500 (EAST OF I-30, EXIT 129 in MAYFLOWER, AR, AR)
AIR SYNTHETIC MINOR (AIRS/AFS)
Housing units lacking complete plumbing facilities: 6.5% Housing units lacking complete kitchen facilities: 6.1%
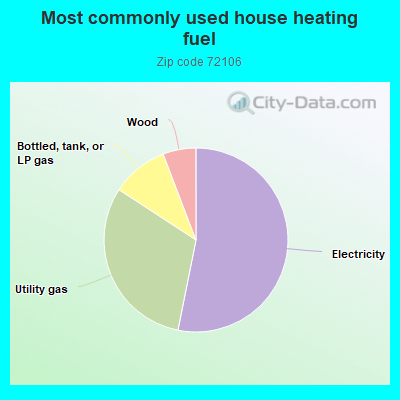
53.2%Electricity
31.1%Utility gas
10.0%Bottled, tank, or LP gas
5.8%Wood
Population in 1990: 3,593. Population change in the 1990s: +645 (+18.0%).
Place of birth for U.S.-born residents:
This state: 3,761
Northeast: 64
Midwest: 296
South: 999
West: 380
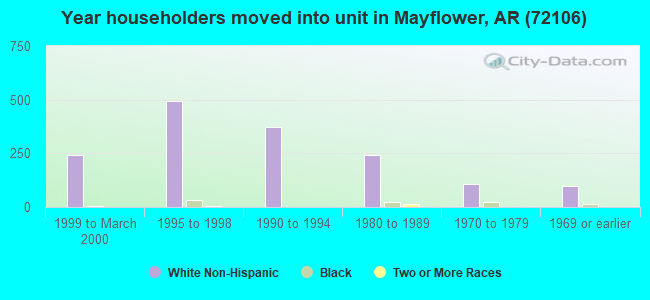
62% of the 72106 zip code residents lived in the same house 5 years ago. Out of people who lived in different houses, 56% lived in this county. Out of people who lived in different counties, 50% lived in Arkansas.
92% of the 72106 zip code residents lived in the same house 1 year ago. Out of people who lived in different houses, 23% moved from this county. Out of people who lived in different houses, 33% moved from different county within same state. Out of people who lived in different houses, 54% moved from different state.
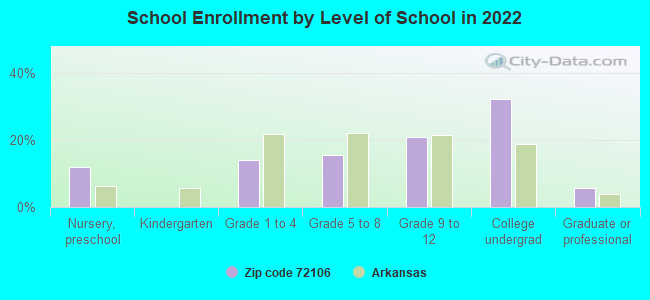
Private vs. public school enrollment:
Students in private schools in grades 1 to 8 (elementary and middle school): 90
Here:
24.5%
Arkansas:
10.5%
Students in private schools in grades 9 to 12 (high school): 63
Here:
24.5%
Arkansas:
8.7%
Students in private undergraduate colleges: 90
Here:
23.1%
Arkansas:
19.4%
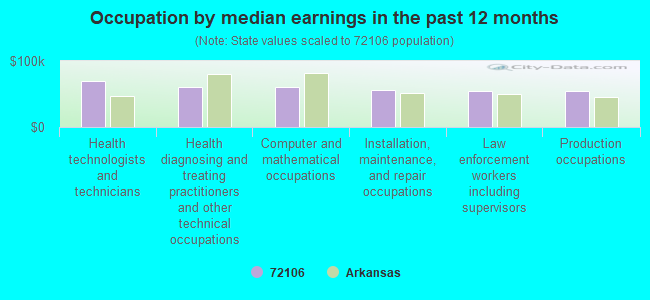
Occupation by median earnings in the past 12 months ($)
69,310Health technologists and technicians
61,049Health diagnosing and treating practitioners and other technical occupations
60,142Computer and mathematical occupations
55,796Installation, maintenance, and repair occupations
54,782Law enforcement workers including supervisors
54,680Production occupations
Companies with federal contracts located in this zip code (MAYFLOWER, AR):
JAMAR CARPORTS & PORTABLE BUIL (65 INTERSTATE DR; small business) : $90,383 in 7 contractsfrom 2002 to 2006
Contracts for Maintenance, Repair and Rebuilding of Equipment -- Prefabricated Structures and Scaffolding, Prefabricated and Portable Buildings, Miscellaneous Prefabricated Structures by Army, U.S. Army Corps of Engineers - civil program financing only Signed by year:2000: $0; 2001: $0; 2002: $16,632; 2003: $18,031; 2004: $37,882; 2005: $13,243; 2006: $4,595.
Biggest contracts:
$37,882 with Army for Maintenance, Repair and Rebuilding of Equipment -- Prefabricated Structures and Scaffolding. Signed on 2004-09-27. Completion date: 2004-11-26.
$18,031 with Army for Prefabricated and Portable Buildings. Signed on 2003-09-27. Completion date: 2003-10-30.
$16,632, same as above.Signed on 2002-09-13. Completion date: 2002-10-11.
$4,900, same as above.Signed on 2005-06-07. Completion date: 2005-06-30.
MAYFLOWER RV INC (87 INTERSTATE DRIVE; small business) : $23,239 in 2 contractsfrom 2005 to 2006
$19,000 with Air Force for Trailers. Signed on 2006-07-10. Completion date: 2006-07-14.
$4,239 with Army for Trailers. Signed on 2005-09-26. Completion date: 2005-09-06.
TURNER PAVING (71 CULBERSON RD; small business)
$10,592 with Army for Maintenance, Repair or Alteration of Real Property -- Highways, Roads, Streets, Bridges, and Railways (includes resurfacing). Signed on 2006-01-17. Completion date: 2006-01-31.
JACK H DICKENS (18101 ROTUNDA CIRCLE; small business) : $6,000 in 4 contractsfrom 2002 to 2003
$9,300 with U.S. Army Corps of Engineers - civil program financing only for Operation of Government-Owned Facilities -- Recreation Facilities (Non-Building). Signed on 2003-03-11. Completion date: 2002-11-15.
$1,320, same as above.Signed on 2002-11-15. Completion date: 2002-11-15.
$0, same as above.Signed on 2003-03-11. Completion date: 2002-11-15.
-$4,620, same as above.Signed on 2003-07-23. Completion date: 2002-11-15.
Top industries in this zip code by the number of employees in 2005:
2002 - 2018 National Fire Incident Reporting System (NFIRS) incidents
According to the data from the years 2002 - 2018 the average number of fires per year is 53. The highest number of reported fire incidents - 122 took place in 2012, and the least - 2 in 2007. The data has an increasing trend.
When looking into fire subcategories, the most reports belonged to: Outside Fires (54.9%), and Structure Fires (28.0%).
Fire incident types reported to NFIRS in Zip Code 72106


 Nearest zip codes: 72034, 72135, 72016, 72035, 72107, 72113.


 According to the data from the years 2002 - 2018 the average number of fires per year is 53. The highest number of reported fire incidents - 122 took place in 2012, and the least - 2 in 2007. The data has an increasing trend.
 When looking into fire subcategories, the most reports belonged to: Outside Fires (54.9%), and Structure Fires (28.0%).