Estimated zip code population in 2022: 416 Zip code population in 2010: 786 Zip code population in 2000: 377
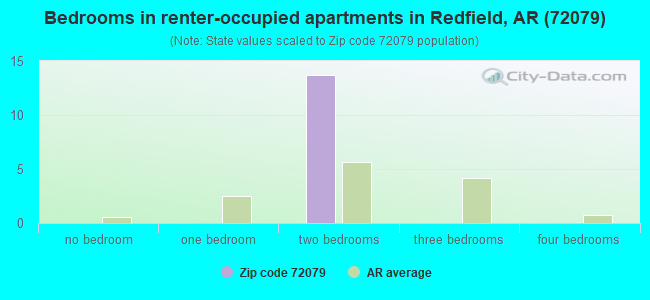
Houses and condos: 217 Renter-occupied apartments: 13
% of renters here:
8%
State:
34%
March 2022 cost of living index in zip code 72079: 78.1 (low, U.S. average is 100)
Land area: 23.4 sq. mi. Water area: 0.4 sq. mi.
Population density: 18 people per square mile
(very low).
OSM Map
General Map
Google Map
MSN Map
OSM Map
General Map
Google Map
MSN Map
OSM Map
General Map
Google Map
MSN Map
OSM Map
General Map
Google Map
MSN Map
Please wait while loading the map...
Real estate property taxes paid for housing units in 2022:
This zip code:
0.5% ($685)
Arkansas:
0.5% ($977)
Median real estate property taxes paid for housing units with mortgages in 2022: $714 (0.3%) Median real estate property taxes paid for housing units with no mortgage in 2022: $667 (0.4%)
Business Search- 14 Million verified businesses
Males: 171
(41.1%)
Females: 245
(58.9%)
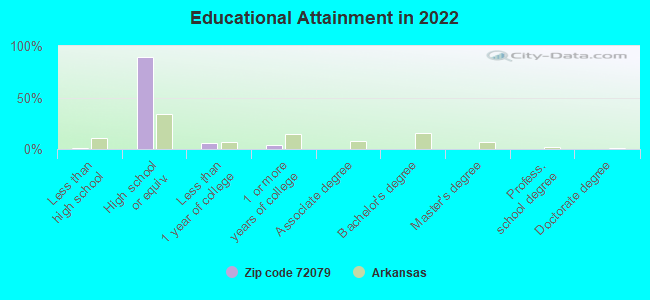
For population 25 years and over in 72079:
High school or higher: 99.7%
Bachelor's degree or higher: 0.0%
Graduate or professional degree: 0.0%
Mean travel time to work (commute): 27.6 minutes
For population 15 years and over in 72079:
Never married: 3.6%
Now married: 64.7%
Separated: 0.0%
Widowed: 16.0%
Divorced: 15.7%
Zip code 72079 compared to state average:
Median household income significantly below state average.
Unemployed percentage significantly below state average.
Black race population percentage below state average.
Hispanic race population percentage significantly below state average.
Median age significantly above state average.
Foreign-born population percentage significantly below state average.
Renting percentage significantly below state average.
Length of stay since moving in significantly above state average.
House age significantly below state average.
Number of college students significantly below state average.
Percentage of population with a bachelor's degree or higher significantly below state average.
Averages for the 2020 tax year for zip code 72079, filed in 2021:
Average Adjusted Gross Income (AGI) in 2020: $49,865 (Individual Income Tax Returns)
Here:
$49,865
State:
$64,872
Salary/wage: $45,996 (reported on 87.1% of returns)
Here:
$45,996
State:
$50,644
(% of AGI for various income ranges: 1204.4% for AGIs below $25k, 3720.0% for AGIs $25k-50k, 5735.0% for AGIs $50k-75k, 19780.0% for AGIs $100k-200k)
Taxable interest for individuals: $83 (reported on 19.4% of returns)
This zip code:
$83
Arkansas:
$1,857
(% of AGI for various income ranges: 2.2% for AGIs below $25k, 5.0% for AGIs $50k-75k)
Profit/loss from business: +$5,050 (reported on 12.9% of returns)
Here:
+$5,050
State:
+$9,743
(% of AGI for various income ranges: 336.7% for AGIs $25k-50k)
Earned income credit: $2,329 (reported on 22.6% of returns)
Here:
$2,329
State:
$2,546
(% of AGI for various income ranges: 113.3% for AGIs below $25k, 101.7% for AGIs $25k-50k)
Percentage of individuals using paid preparers for their 2020 taxes: 90.3%
Here:
90%
State:
94%
(% for various income ranges: 90.9% for AGIs below $25k, 87.5% for AGIs $25k-50k, 100.0% for AGIs $50k-75k, 100.0% for AGIs $75k-100k, 75.0% for AGIs $100k-200k)
Averages for the 2012 tax year for zip code 72079, filed in 2013:
Average Adjusted Gross Income (AGI) in 2012: $42,268 (Individual Income Tax Returns)
Here:
$42,268
State:
$52,148
Salary/wage: $40,106 (reported on 91.2% of returns)
Here:
$40,106
State:
$41,669
(% of AGI for various income ranges: 73.1% for AGIs below $25k, 84.1% for AGIs $25k-50k, 92.3% for AGIs $50k-75k, 84.2% for AGIs $75k-100k, 91.3% for AGIs $100k-200k)
Taxable interest for individuals: $457 (reported on 20.6% of returns)
This zip code:
$457
Arkansas:
$1,648
(% of AGI for various income ranges: 1.7% for AGIs below $25k, 0.2% for AGIs $50k-75k)
Ordinary dividends: $700 (reported on 5.9% of returns)
Here:
$700
State:
$20,675
Profit/loss from business: +$475 (reported on 11.8% of returns)
Here:
+$475
State:
+$9,665
(% of AGI for various income ranges: 5.1% for AGIs below $25k)
Total itemized deductions: $16,186 (23% of AGI, reported on 20.6% of returns)
Here:
$16,186
State:
$23,276
Here:
22.6% of AGI
State:
19.1% of AGI
(% of AGI for various income ranges: 16.2% for AGIs $25k-50k, 20.6% for AGIs $75k-100k)
Charity contributions: $2,500 (reported on 14.7% of returns)
Here:
$2,500
State:
$5,996
Taxes paid: $4,657 (reported on 20.6% of returns)
72079:
$4,657
State:
$7,941
(% of AGI for various income ranges: 3.3% for AGIs $25k-50k, 7.9% for AGIs $75k-100k)
Earned income credit: $2,357 (reported on 20.6% of returns)
Here:
$2,357
State:
$2,455
(% of AGI for various income ranges: 8.7% for AGIs below $25k, 0.9% for AGIs $25k-50k)
Percentage of individuals using paid preparers for their 2012 taxes: 52.9%
Here:
53%
State:
61%
(% for various income ranges: 46.2% for AGIs below $25k, 60.0% for AGIs $25k-50k, 60.0% for AGIs $50k-75k, 100.0% for AGIs $75k-100k)
Averages for the 2004 tax year for zip code 72079, filed in 2005:
Average Adjusted Gross Income (AGI) in 2004: $35,750 (Individual Income Tax Returns)
Here:
$35,750
State:
$39,270
Salary/wage: $35,525 (reported on 89.1% of returns)
Here:
$35,525
State:
$34,079
(% of AGI for various income ranges: 85.2% for AGIs below $10k, 81.1% for AGIs $10k-25k, 84.3% for AGIs $25k-50k, 94.8% for AGIs $50k-75k, 90.1% for AGIs $75k-100k)
Taxable interest for individuals: $220 (reported on 29.2% of returns)
This zip code:
$220
Arkansas:
$1,904
(% of AGI for various income ranges: 0.2% for AGIs $10k-25k, 0.4% for AGIs $25k-50k, 0.1% for AGIs $50k-75k, 0.0% for AGIs $75k-100k)
Taxable dividends: $100 (reported on 6.4% of returns)
Here:
$100
State:
$5,995
Profit/loss from business: +$172 (reported on 9.3% of returns)
Here:
+$172
State:
+$7,823
Total itemized deductions: $12,407 (20% of AGI, reported on 18.9% of returns)
Here:
$12,407
State:
$18,389
Here:
20.3% of AGI
State:
21.0% of AGI
Charity contributions deductions: $1,750 (3% of AGI, reported on 11.5% of returns)
Here:
$1,750
State:
$4,725
Here:
2.9% of AGI
State:
5.1% of AGI
Total tax: $4,059 (reported on 70.5% of returns)
72079:
$4,059
State:
$6,047
(% of AGI for various income ranges: 1.1% for AGIs below $10k, 3.0% for AGIs $10k-25k, 6.2% for AGIs $25k-50k, 8.8% for AGIs $50k-75k, 12.0% for AGIs $75k-100k)
Earned income credit: $2,000 (reported on 18.3% of returns)
Here:
$2,000
State:
$1,909
Percentage of individuals using paid preparers for their 2004 taxes: 60.3%
Here:
60%
State:
67%
(% for various income ranges: 58.7% for AGIs below $10k, 60.0% for AGIs $10k-25k, 60.6% for AGIs $25k-50k, 61.8% for AGIs $50k-75k, 60.0% for AGIs $75k-100k)
Household received Food Stamps/SNAP in the past 12 months: 0 Household did not receive Food Stamps/SNAP in the past 12 months: 168
Women who did not have a birth in the past 12 months: 65 (47 now married, 18 unmarried)
Housing units in zip code 72079 with a mortgage: 77 Median monthly owner costs for units with a mortgage: $1,555 Median monthly owner costs for units without a mortgage: $396
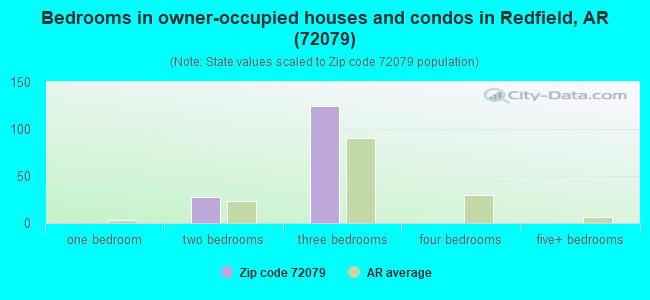
Median number of rooms in houses and condos:
Here:
7.4
State:
6.1
Notable locations in this zip code not listed on our city pages
Streams, rivers, and creeks: Hyde Branch (A), Horn Branch (B), Dale Creek (C), Stokes Creek (D), Smith Creek (E), Case Creek (F), Schoolhouse Creek (G), Brush Creek (H), Patterson Branch (I). Display/hide their locations on the map
Size of family households: 69 2-persons, 64 3-persons, 10 5-persons
Size of nonfamily households: 19 1-person
99.0% of residents of 72079 zip code speak English at home.
1.9% of residents speak Spanish at home (100% very well).
Foreign born population: 0 (0.0%)
:
0.0%
Whole state:
5.1%
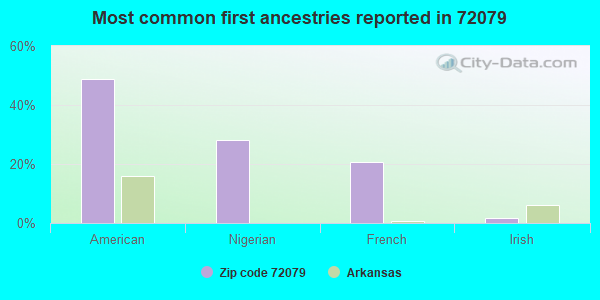
49%American
28%Nigerian
21%French
2%Irish
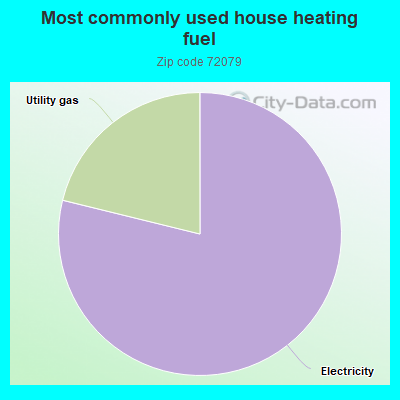
79.4%Electricity
21.3%Utility gas
Population in 1990: 1,682.
Place of birth for U.S.-born residents:
This state: 284
Midwest: 35
South: 93
65% of the 72079 zip code residents lived in the same house 5 years ago. Out of people who lived in different houses, 75% lived in this county.
91% of the 72079 zip code residents lived in the same house 1 year ago. Out of people who lived in different houses, 29% moved from this county. Out of people who lived in different houses, 29% moved from different county within same state. Out of people who lived in different houses, 44% moved from different state.
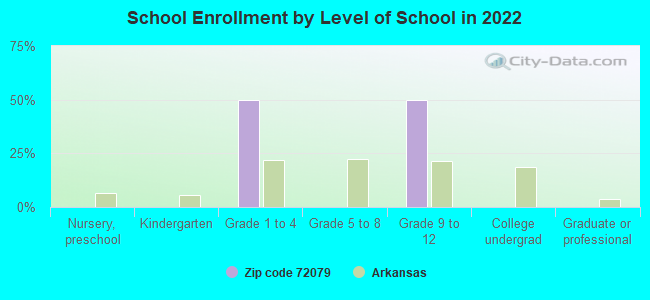
Private vs. public school enrollment:
Students in private schools in grades 1 to 8 (elementary and middle school):
Here:
0.0%
Arkansas:
10.5%
Students in private schools in grades 9 to 12 (high school):
Here:
0.0%
Arkansas:
8.7%
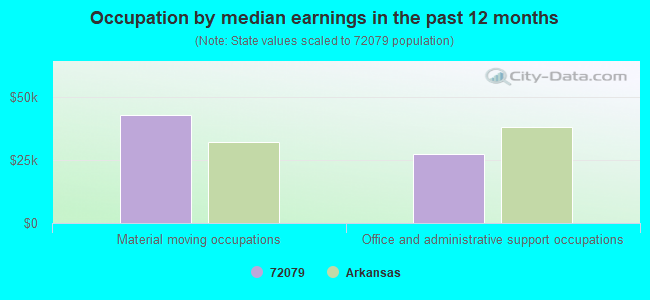
Occupation by median earnings in the past 12 months ($)
42,772Material moving occupations
27,377Office and administrative support occupations
Companies with federal contracts located in this zip code:
JDS FOODS INC (3900 NCTR RD in JEFFERSON, AR; small business) : $1,651 in 2 contractsin 2006
$1,625 with Army for Food Services. Signed on 2006-01-20. Completion date: 2006-01-30.
$26, same as above.Signed on 2006-02-23. Completion date: 2006-01-30.
Top industries in this zip code by the number of employees in 2005:
Professional, Scientific, and Technical Services: Research and Development in the Physical, Engineering, and Life Sciences (50-99 employees: 1 establishment)
Other Services (except Public Administration): Labor Unions and Similar Labor Organizations (20-49: 1)
Administrative and Support and Waste Management and Remediation Services: Facilities Support Services (20-49: 1)
Other Services (except Public Administration): Other Electronic and Precision Equipment Repair and Maintenance (5-9: 1)
Utilities: Water Supply and Irrigation Systems (1-4: 1)
Accommodation and Food Services: Food Service Contractors (1-4: 1)
Fatal accident statistics in 2014:
Fatal accident count: 1
Vehicles involved in fatal accidents: 2
Fatal accidents caused by drunken drivers: 0
Fatalities: 2
Persons involved in fatal accidents: 6
Pedestrians involved in fatal accidents: 0
Fatal accident statistics in 2013:
Fatal accident count: 1
Vehicles involved in fatal accidents: 2
Fatal accidents caused by drunken drivers: 0
Fatalities: 1
Persons involved in fatal accidents: 2
Pedestrians involved in fatal accidents: 0
Home Mortgage Disclosure Act Aggregated Statistics For Year 2009 (Based on 2 partial tracts)
A) FHA, FSA/RHS & VA Home Purchase Loans
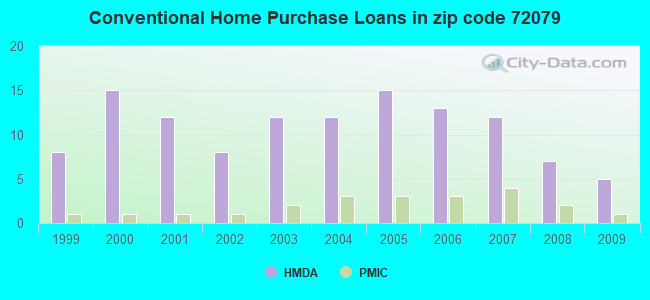
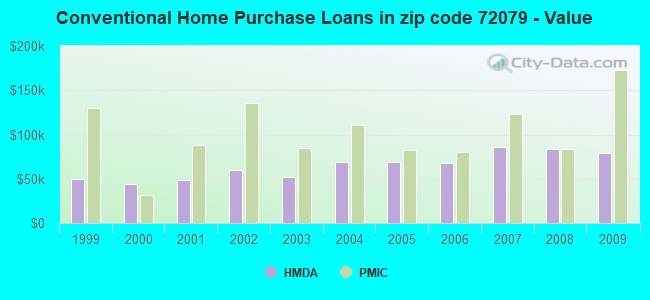
B) Conventional Home Purchase Loans
C) Refinancings
D) Home Improvement Loans
F) Non-occupant Loans on < 5 Family Dwellings (A B C & D)
G) Loans On Manufactured Home Dwelling (A B C & D)
Number
Average Value
Number
Average Value
Number
Average Value
Number
Average Value
Number
Average Value
Number
Average Value
LOANS ORIGINATED
5
$119,702
5
$79,460
15
$101,481
3
$17,517
2
$28,515
4
$59,115
APPLICATIONS APPROVED, NOT ACCEPTED
0
$0
2
$39,890
2
$115,345
0
$0
0
$0
2
$39,250
APPLICATIONS DENIED
2
$75,615
3
$87,577
7
$102,620
2
$6,570
1
$28,200
4
$69,045
APPLICATIONS WITHDRAWN
0
$0
0
$0
4
$104,850
0
$0
0
$0
0
$0
FILES CLOSED FOR INCOMPLETENESS
0
$0
0
$0
0
$0
0
$0
0
$0
0
$0
Aggregated Statistics For Year 2008 (Based on 2 partial tracts)
A) FHA, FSA/RHS & VA Home Purchase Loans
B) Conventional Home Purchase Loans
C) Refinancings
D) Home Improvement Loans
F) Non-occupant Loans on < 5 Family Dwellings (A B C & D)
G) Loans On Manufactured Home Dwelling (A B C & D)
Number
Average Value
Number
Average Value
Number
Average Value
Number
Average Value
Number
Average Value
Number
Average Value
LOANS ORIGINATED
9
$96,726
7
$84,036
8
$93,076
3
$31,400
2
$49,020
6
$66,323
APPLICATIONS APPROVED, NOT ACCEPTED
1
$26,270
2
$68,085
1
$89,070
1
$49,980
0
$0
2
$71,770
APPLICATIONS DENIED
1
$54,150
7
$83,624
5
$105,924
2
$29,475
0
$0
4
$56,230
APPLICATIONS WITHDRAWN
1
$82,020
1
$49,980
2
$81,700
0
$0
0
$0
0
$0
FILES CLOSED FOR INCOMPLETENESS
1
$128,160
0
$0
1
$33,640
0
$0
0
$0
0
$0
Aggregated Statistics For Year 2007 (Based on 2 partial tracts)
A) FHA, FSA/RHS & VA Home Purchase Loans
B) Conventional Home Purchase Loans
C) Refinancings
D) Home Improvement Loans
F) Non-occupant Loans on < 5 Family Dwellings (A B C & D)
G) Loans On Manufactured Home Dwelling (A B C & D)
Number
Average Value
Number
Average Value
Number
Average Value
Number
Average Value
Number
Average Value
Number
Average Value
LOANS ORIGINATED
7
$90,261
12
$86,107
11
$82,255
2
$19,385
1
$83,940
6
$68,833
APPLICATIONS APPROVED, NOT ACCEPTED
0
$0
4
$61,438
2
$92,915
0
$0
0
$0
3
$66,323
APPLICATIONS DENIED
2
$81,060
6
$59,808
7
$81,747
4
$26,592
1
$41,970
5
$47,996
APPLICATIONS WITHDRAWN
0
$0
1
$57,990
3
$102,313
0
$0
0
$0
1
$36,210
FILES CLOSED FOR INCOMPLETENESS
0
$0
2
$87,310
1
$97,080
0
$0
0
$0
0
$0
Aggregated Statistics For Year 2006 (Based on 2 partial tracts)
A) FHA, FSA/RHS & VA Home Purchase Loans
B) Conventional Home Purchase Loans
C) Refinancings
D) Home Improvement Loans
F) Non-occupant Loans on < 5 Family Dwellings (A B C & D)
G) Loans On Manufactured Home Dwelling (A B C & D)
Number
Average Value
Number
Average Value
Number
Average Value
Number
Average Value
Number
Average Value
Number
Average Value
LOANS ORIGINATED
4
$88,270
13
$67,900
10
$57,512
3
$28,517
1
$12,500
9
$41,331
APPLICATIONS APPROVED, NOT ACCEPTED
1
$30,760
6
$62,425
1
$91,310
0
$0
0
$0
7
$57,947
APPLICATIONS DENIED
3
$38,127
7
$45,909
6
$63,065
1
$89,710
0
$0
8
$40,651
APPLICATIONS WITHDRAWN
1
$88,430
1
$75,610
3
$118,870
0
$0
0
$0
1
$31,080
FILES CLOSED FOR INCOMPLETENESS
0
$0
1
$90,350
1
$54,790
0
$0
1
$35,560
0
$0
Aggregated Statistics For Year 2005 (Based on 2 partial tracts)
A) FHA, FSA/RHS & VA Home Purchase Loans
B) Conventional Home Purchase Loans
C) Refinancings
D) Home Improvement Loans
F) Non-occupant Loans on < 5 Family Dwellings (A B C & D)
G) Loans On Manufactured Home Dwelling (A B C & D)
Number
Average Value
Number
Average Value
Number
Average Value
Number
Average Value
Number
Average Value
Number
Average Value
LOANS ORIGINATED
3
$84,373
15
$69,463
12
$70,808
2
$35,245
4
$41,252
6
$53,507
APPLICATIONS APPROVED, NOT ACCEPTED
0
$0
4
$57,912
3
$74,653
0
$0
0
$0
5
$51,648
APPLICATIONS DENIED
0
$0
12
$55,109
10
$89,328
2
$8,650
1
$51,900
13
$53,335
APPLICATIONS WITHDRAWN
0
$0
1
$81,700
6
$74,867
1
$107,330
0
$0
1
$67,600
FILES CLOSED FOR INCOMPLETENESS
0
$0
1
$33,000
1
$34,600
0
$0
0
$0
0
$0
Aggregated Statistics For Year 2004 (Based on 2 partial tracts)
A) FHA, FSA/RHS & VA Home Purchase Loans
B) Conventional Home Purchase Loans
C) Refinancings
D) Home Improvement Loans
F) Non-occupant Loans on < 5 Family Dwellings (A B C & D)
G) Loans On Manufactured Home Dwelling (A B C & D)
Number
Average Value
Number
Average Value
Number
Average Value
Number
Average Value
Number
Average Value
Number
Average Value
LOANS ORIGINATED
5
$86,380
12
$68,405
13
$76,354
3
$35,990
1
$48,060
7
$51,447
APPLICATIONS APPROVED, NOT ACCEPTED
0
$0
4
$66,082
5
$72,924
0
$0
0
$0
4
$39,650
APPLICATIONS DENIED
1
$40,690
9
$57,814
10
$55,525
3
$33,000
1
$11,210
10
$37,711
APPLICATIONS WITHDRAWN
0
$0
2
$55,430
6
$80,153
0
$0
0
$0
1
$47,100
FILES CLOSED FOR INCOMPLETENESS
0
$0
1
$56,710
2
$71,450
0
$0
0
$0
0
$0
Aggregated Statistics For Year 2003 (Based on 2 partial tracts)
A) FHA, FSA/RHS & VA Home Purchase Loans
B) Conventional Home Purchase Loans
C) Refinancings
D) Home Improvement Loans
F) Non-occupant Loans on < 5 Family Dwellings (A B C & D)
Number
Average Value
Number
Average Value
Number
Average Value
Number
Average Value
Number
Average Value
LOANS ORIGINATED
4
$88,910
12
$51,718
20
$75,022
1
$29,800
1
$54,790
APPLICATIONS APPROVED, NOT ACCEPTED
2
$26,595
5
$68,694
4
$61,598
0
$0
0
$0
APPLICATIONS DENIED
3
$33,107
18
$38,928
9
$58,527
2
$15,540
0
$0
APPLICATIONS WITHDRAWN
1
$47,740
1
$56,070
6
$63,760
0
$0
0
$0
FILES CLOSED FOR INCOMPLETENESS
0
$0
0
$0
3
$59,060
0
$0
0
$0
Aggregated Statistics For Year 2002 (Based on 2 partial tracts)
A) FHA, FSA/RHS & VA Home Purchase Loans
B) Conventional Home Purchase Loans
C) Refinancings
D) Home Improvement Loans
F) Non-occupant Loans on < 5 Family Dwellings (A B C & D)
Number
Average Value
Number
Average Value
Number
Average Value
Number
Average Value
Number
Average Value
LOANS ORIGINATED
6
$81,702
8
$59,875
13
$85,424
1
$38,130
1
$35,240
APPLICATIONS APPROVED, NOT ACCEPTED
1
$47,100
7
$54,469
6
$50,890
1
$15,380
1
$19,540
APPLICATIONS DENIED
1
$45,820
12
$44,082
9
$50,943
1
$5,770
1
$58,630
APPLICATIONS WITHDRAWN
0
$0
1
$17,940
5
$50,560
0
$0
1
$34,600
FILES CLOSED FOR INCOMPLETENESS
0
$0
0
$0
2
$68,245
0
$0
0
$0
Aggregated Statistics For Year 2001 (Based on 2 partial tracts)
A) FHA, FSA/RHS & VA Home Purchase Loans
B) Conventional Home Purchase Loans
C) Refinancings
D) Home Improvement Loans
F) Non-occupant Loans on < 5 Family Dwellings (A B C & D)
Number
Average Value
Number
Average Value
Number
Average Value
Number
Average Value
Number
Average Value
LOANS ORIGINATED
3
$74,653
12
$48,033
11
$65,420
1
$46,460
0
$0
APPLICATIONS APPROVED, NOT ACCEPTED
0
$0
7
$43,620
2
$49,340
0
$0
0
$0
APPLICATIONS DENIED
0
$0
13
$38,892
14
$49,090
2
$7,530
1
$20,510
APPLICATIONS WITHDRAWN
0
$0
2
$33,960
5
$51,200
0
$0
0
$0
FILES CLOSED FOR INCOMPLETENESS
0
$0
0
$0
1
$63,440
0
$0
0
$0
Aggregated Statistics For Year 2000 (Based on 2 partial tracts)
A) FHA, FSA/RHS & VA Home Purchase Loans
B) Conventional Home Purchase Loans
C) Refinancings
D) Home Improvement Loans
F) Non-occupant Loans on < 5 Family Dwellings (A B C & D)
Number
Average Value
Number
Average Value
Number
Average Value
Number
Average Value
Number
Average Value
LOANS ORIGINATED
7
$73,876
15
$44,001
8
$54,348
2
$13,935
2
$32,040
APPLICATIONS APPROVED, NOT ACCEPTED
1
$33,320
7
$45,817
4
$55,830
1
$6,730
1
$41,650
APPLICATIONS DENIED
2
$45,495
17
$40,634
8
$51,504
2
$11,695
0
$0
APPLICATIONS WITHDRAWN
0
$0
1
$31,720
7
$40,416
1
$9,930
0
$0
FILES CLOSED FOR INCOMPLETENESS
0
$0
0
$0
1
$23,710
0
$0
0
$0
Aggregated Statistics For Year 1999 (Based on 1 partial tract)

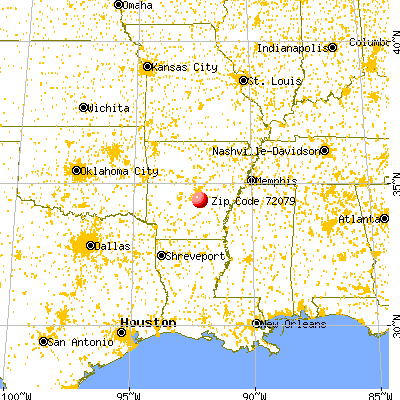


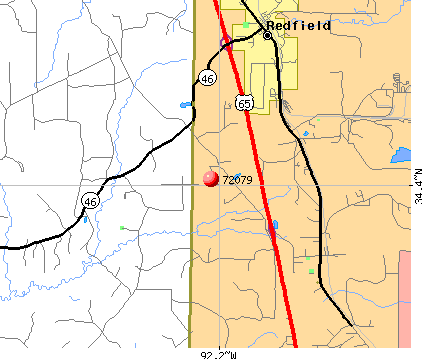 Nearest zip codes: 72132, 71602, 72065, 72152, 72168, 72150.


 : $1,651 in 2 contracts in 2006