Estimated zip code population in 2022: 285 Zip code population in 2010: 544 Zip code population in 2000: 592
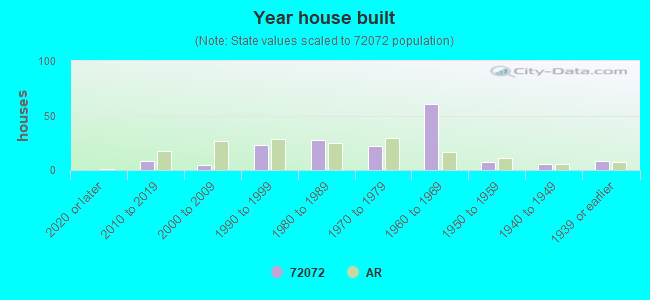
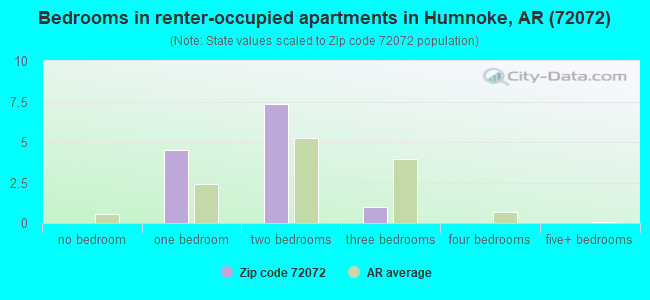
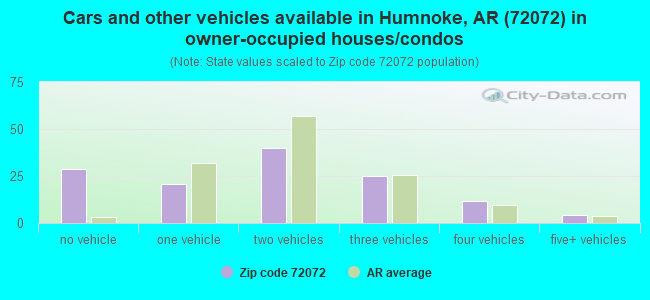
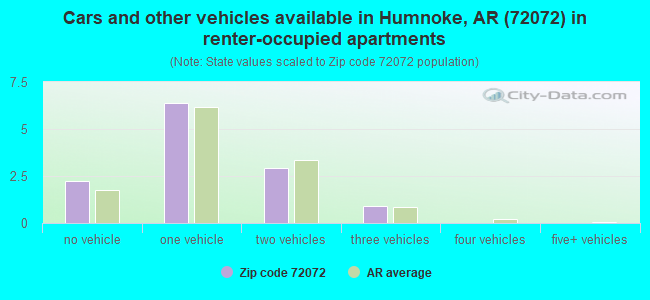
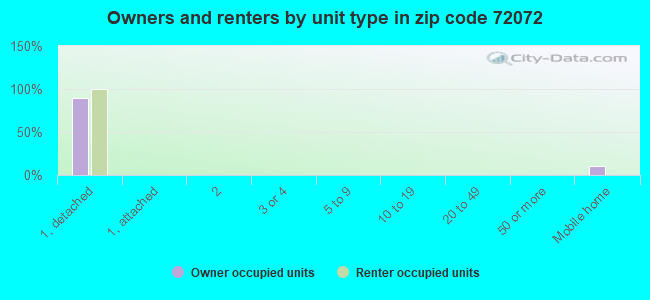
Houses and condos: 172 Renter-occupied apartments: 12
% of renters here:
9%
State:
34%
March 2022 cost of living index in zip code 72072: 76.2 (low, U.S. average is 100)
Land area: 36.6 sq. mi. Water area: 3.5 sq. mi.
Population density: 8 people per square mile
(very low).
OSM Map
General Map
Google Map
MSN Map
OSM Map
General Map
Google Map
MSN Map
OSM Map
General Map
Google Map
MSN Map
OSM Map
General Map
Google Map
MSN Map
Please wait while loading the map...
Real estate property taxes paid for housing units in 2022:
This zip code:
0.7% ($794)
Arkansas:
0.5% ($977)
Median real estate property taxes paid for housing units with mortgages in 2022: $1,073 (0.8%) Median real estate property taxes paid for housing units with no mortgage in 2022: $744 (0.6%)
Business Search- 14 Million verified businesses
Males: 142
(49.8%)
Females: 143
(50.2%)
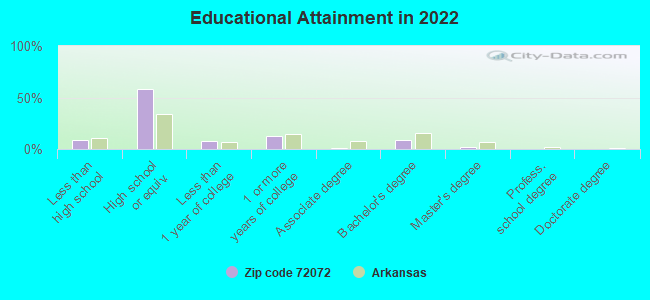
For population 25 years and over in 72072:
High school or higher: 90.0%
Bachelor's degree or higher: 11.4%
Graduate or professional degree: 2.5%
Mean travel time to work (commute): 29.8 minutes
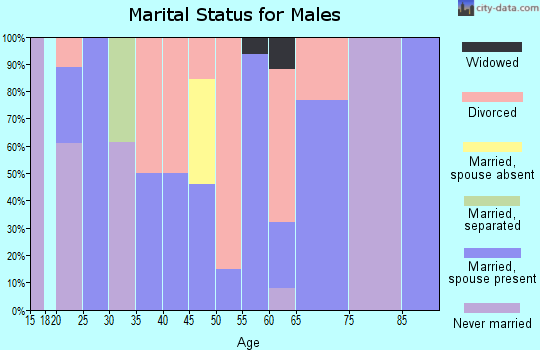
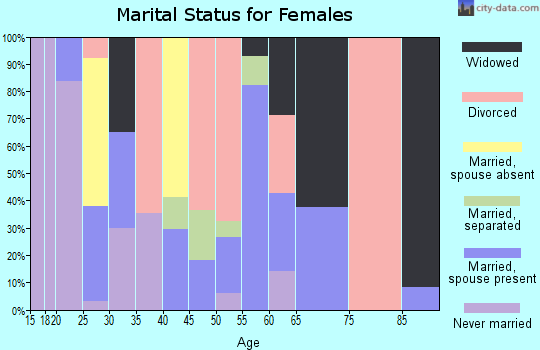
For population 15 years and over in 72072:
Never married: 15.0%
Now married: 61.2%
Separated: 3.8%
Widowed: 13.4%
Divorced: 6.5%
Zip code 72072 compared to state average:
Median house value below state average.
Unemployed percentage significantly below state average.
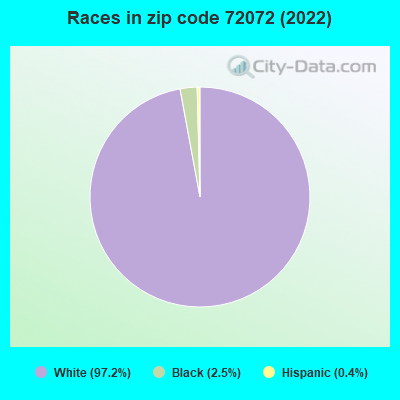
Black race population percentage significantly below state average.
Hispanic race population percentage significantly below state average.
Median age significantly above state average.
Foreign-born population percentage significantly below state average.
Renting percentage significantly below state average.
Length of stay since moving in significantly above state average.
Number of college students significantly below state average.
Percentage of population with a bachelor's degree or higher below state average.
Averages for the 2020 tax year for zip code 72072, filed in 2021:
Average Adjusted Gross Income (AGI) in 2020: $39,628 (Individual Income Tax Returns)
Here:
$39,628
State:
$64,872
Salary/wage: $39,215 (reported on 72.2% of returns)
Here:
$39,215
State:
$50,644
(% of AGI for various income ranges: 856.0% for AGIs below $25k, 5322.0% for AGIs $25k-50k)
Taxable interest for individuals: $433 (reported on 16.7% of returns)
This zip code:
$433
Arkansas:
$1,857
(% of AGI for various income ranges: 26.0% for AGIs $25k-50k)
Profit/loss from business: +$6,300 (reported on 16.7% of returns)
Here:
+$6,300
State:
+$9,743
(% of AGI for various income ranges: 378.0% for AGIs below $25k)
Earned income credit: $2,275 (reported on 22.2% of returns)
Here:
$2,275
State:
$2,546
(% of AGI for various income ranges: 182.0% for AGIs below $25k)
Percentage of individuals using paid preparers for their 2020 taxes: 83.3%
Here:
83%
State:
94%
(% for various income ranges: 85.7% for AGIs below $25k, 116.7% for AGIs $25k-50k, 0.0% for AGIs $50k-75k, 66.7% for AGIs $75k-100k)
Averages for the 2012 tax year for zip code 72072, filed in 2013:
Average Adjusted Gross Income (AGI) in 2012: $46,677 (Individual Income Tax Returns)
Here:
$46,677
State:
$52,148
Salary/wage: $32,016 (reported on 86.4% of returns)
Here:
$32,016
State:
$41,669
(% of AGI for various income ranges: 77.5% for AGIs below $25k, 82.8% for AGIs $25k-50k, 38.0% for AGIs $75k-100k)
Taxable interest for individuals: $267 (reported on 13.6% of returns)
This zip code:
$267
Arkansas:
$1,648
Profit/loss from business: +$5,600 (reported on 13.6% of returns)
Here:
+$5,600
State:
+$9,665
Total itemized deductions: $17,400 (13% of AGI, reported on 13.6% of returns)
Here:
$17,400
State:
$23,276
Here:
13.0% of AGI
State:
19.1% of AGI
Charity contributions: $4,850 (reported on 9.1% of returns)
Here:
$4,850
State:
$5,996
Taxes paid: $8,833 (reported on 13.6% of returns)
72072:
$8,833
State:
$7,941
Earned income credit: $2,429 (reported on 31.8% of returns)
Here:
$2,429
State:
$2,455
(% of AGI for various income ranges: 9.9% for AGIs below $25k, 1.1% for AGIs $25k-50k)
Percentage of individuals using paid preparers for their 2012 taxes: 59.1%
Here:
59%
State:
61%
(% for various income ranges: 66.7% for AGIs below $25k, 50.0% for AGIs $25k-50k, 66.7% for AGIs $75k-100k)
Averages for the 2004 tax year for zip code 72072, filed in 2005:
Average Adjusted Gross Income (AGI) in 2004: $28,740 (Individual Income Tax Returns)
Here:
$28,740
State:
$39,270
Salary/wage: $26,770 (reported on 86.3% of returns)
Here:
$26,770
State:
$34,079
(% of AGI for various income ranges: 92.2% for AGIs below $10k, 77.3% for AGIs $10k-25k, 81.3% for AGIs $25k-50k, 85.7% for AGIs $50k-75k, 74.7% for AGIs $75k-100k)
Taxable interest for individuals: $770 (reported on 26.9% of returns)
This zip code:
$770
Arkansas:
$1,904
(% of AGI for various income ranges: 1.2% for AGIs below $10k, 0.9% for AGIs $10k-25k, 1.2% for AGIs $25k-50k, 0.2% for AGIs $50k-75k)
Taxable dividends: $450 (reported on 8.8% of returns)
Here:
$450
State:
$5,995
Profit/loss from business: +$7,783 (reported on 10.1% of returns)
Here:
+$7,783
State:
+$7,823
Total itemized deductions: $14,375 (23% of AGI, reported on 14.1% of returns)
Here:
$14,375
State:
$18,389
Here:
22.6% of AGI
State:
21.0% of AGI
Charity contributions deductions: $5,655 (8% of AGI, reported on 12.8% of returns)
Here:
$5,655
State:
$4,725
Here:
8.4% of AGI
State:
5.1% of AGI
Total tax: $3,618 (reported on 63.4% of returns)
72072:
$3,618
State:
$6,047
(% of AGI for various income ranges: 2.3% for AGIs below $10k, 3.0% for AGIs $10k-25k, 6.7% for AGIs $25k-50k, 9.0% for AGIs $50k-75k, 15.4% for AGIs $75k-100k)
Earned income credit: $2,068 (reported on 32.2% of returns)
Here:
$2,068
State:
$1,909
Percentage of individuals using paid preparers for their 2004 taxes: 70.9%
Here:
71%
State:
67%
(% for various income ranges: 64.7% for AGIs below $10k, 78.4% for AGIs $10k-25k, 66.7% for AGIs $25k-50k, 115.8% for AGIs $50k-75k)
Household received Food Stamps/SNAP in the past 12 months: 6 Household did not receive Food Stamps/SNAP in the past 12 months: 134
Women who had a birth in the past 12 months: 5 (5 now married, 0 unmarried) Women who did not have a birth in the past 12 months: 34 (24 now married, 10 unmarried)
Housing units in zip code 72072 with a mortgage: 45 (5 second mortgage) Median monthly owner costs for units with a mortgage: $843 Median monthly owner costs for units without a mortgage: $430
Residents with income below the poverty level in 2022:
This zip code:
0.6%
Whole state:
16.8%
Residents with income below 50% of the poverty level in 2022:
This zip code:
0.6%
Whole state:
8.5%
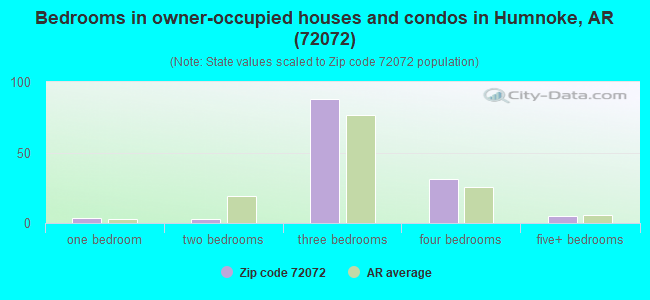
Median number of rooms in houses and condos:
Here:
6.3
State:
6.1
Median number of rooms in apartments:
Here:
5.0
State:
4.3
Notable locations in this zip code not listed on our city pages
Size of family households: 30 2-persons, 25 3-persons, 6 4-persons, 7 5-persons
Size of nonfamily households: 68 1-person, 2 2-persons
37 married couples with children.
0 single-parent households ().
100.4% of residents of 72072 zip code speak English at home.
Foreign born population: 0 (0.0%)
:
0.0%
Whole state:
5.1%
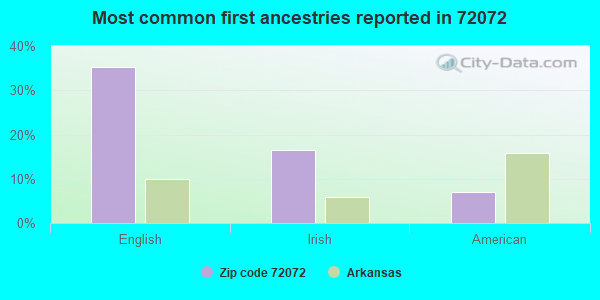
35%English
16%Irish
7%American
Facilities with environmental interests located in this zip code:
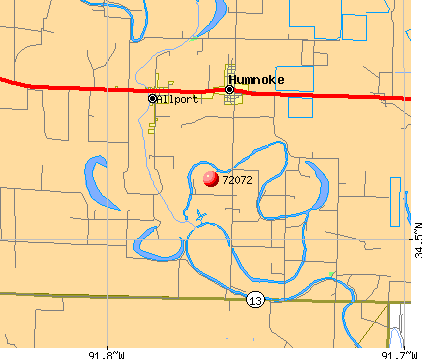
ALLPORT WATER WORKS WATER SYS (270 ALLPORT RD in HUMNOKE, AR)
(Integrated Compliance Information System) - ICIS-06-2000-0574, FORMAL ENFORCEMENT ACTION Business SIC classification: WATER SUPPLY
CARTERS BODY SHOP (HWY 13 N 1 1/2 BLKS N HWY 165 in HUMNOKE, AR)
Conditionally Exempt Small Quantity Generators, less than 100 kg/month of hazardous waste (Resource Conservation and Recovery Act (tracking hazardous waste)) - notification Organizations: CARTER ELBERT (CONTACT/OWNER)
Housing units lacking complete plumbing facilities: 8.5% Housing units lacking complete kitchen facilities: 12.7%
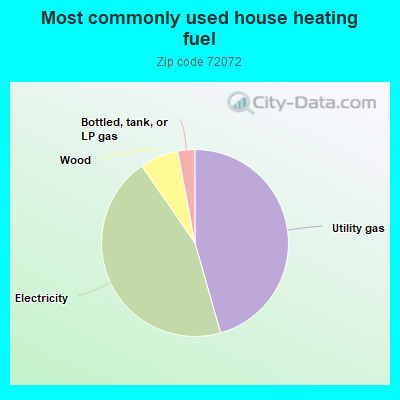
46.0%Utility gas
45.2%Electricity
6.7%Wood
3.0%Bottled, tank, or LP gas
Population in 1990: 992.
Place of birth for U.S.-born residents:
This state: 254
Northeast: 2
Midwest: 10
South: 10
West: 5
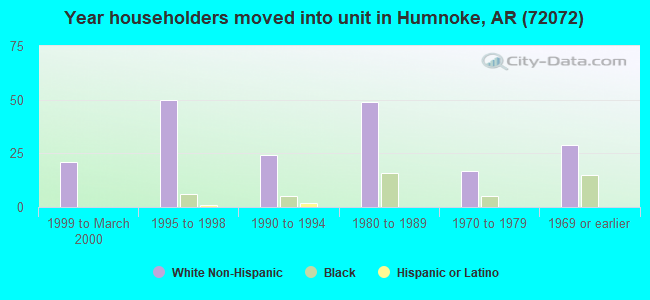
71% of the 72072 zip code residents lived in the same house 5 years ago. Out of people who lived in different houses, 49% lived in this county. Out of people who lived in different counties, 50% lived in Arkansas.
100% of the 72072 zip code residents lived in the same house 1 year ago. Out of people who lived in different houses, 100% moved from different county within same state.
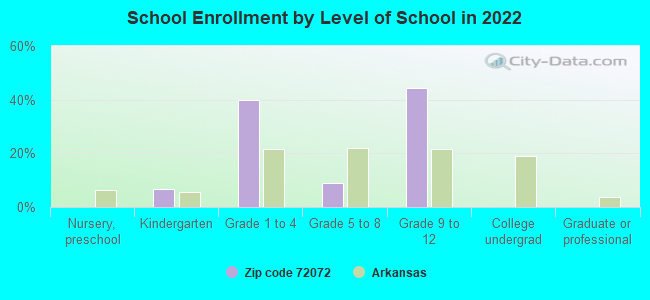
Private vs. public school enrollment:
Students in private schools in grades 1 to 8 (elementary and middle school):
Here:
0.0%
Arkansas:
10.5%
Students in private schools in grades 9 to 12 (high school):
Here:
0.0%
Arkansas:
8.7%
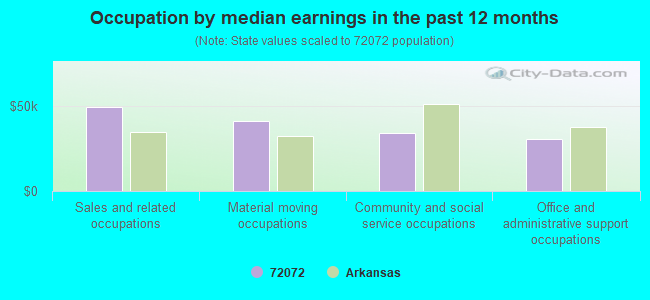
Occupation by median earnings in the past 12 months ($)
49,553Sales and related occupations
41,277Material moving occupations
33,977Community and social service occupations
30,799Office and administrative support occupations
Top industries in this zip code by the number of employees in 2005:
Utilities: Water Supply and Irrigation Systems (1-4 employees: 1 establishment)
Finance and Insurance: Commercial Banking (1-4: 1)
Fatal accident statistics in 2014:
Fatal accident count: 1
Vehicles involved in fatal accidents: 3
Fatal accidents caused by drunken drivers: 0
Fatalities: 1
Persons involved in fatal accidents: 3
Pedestrians involved in fatal accidents: 0
Home Mortgage Disclosure Act Aggregated Statistics For Year 2009 (Based on 2 partial tracts)
A) FHA, FSA/RHS & VA Home Purchase Loans
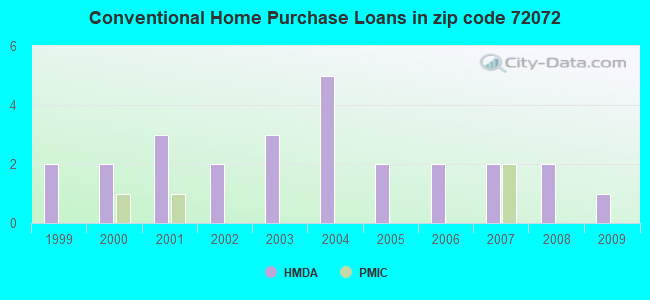
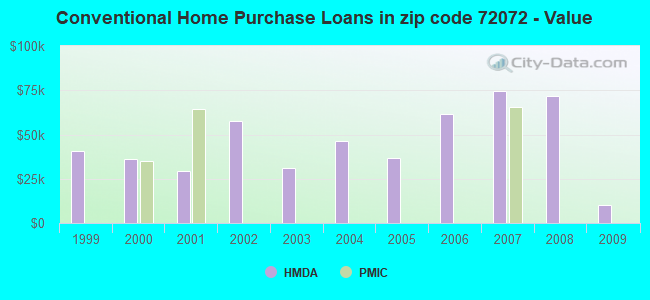
B) Conventional Home Purchase Loans
C) Refinancings
D) Home Improvement Loans
F) Non-occupant Loans on < 5 Family Dwellings (A B C & D)
G) Loans On Manufactured Home Dwelling (A B C & D)
Number
Average Value
Number
Average Value
Number
Average Value
Number
Average Value
Number
Average Value
Number
Average Value
LOANS ORIGINATED
1
$57,870
1
$10,300
2
$72,720
1
$13,030
0
$0
0
$0
APPLICATIONS APPROVED, NOT ACCEPTED
0
$0
0
$0
0
$0
0
$0
0
$0
0
$0
APPLICATIONS DENIED
0
$0
1
$44,840
1
$62,110
0
$0
0
$0
1
$12,120
APPLICATIONS WITHDRAWN
0
$0
0
$0
1
$74,230
0
$0
1
$9,090
0
$0
FILES CLOSED FOR INCOMPLETENESS
0
$0
0
$0
0
$0
0
$0
0
$0
0
$0
Aggregated Statistics For Year 2008 (Based on 2 partial tracts)
A) FHA, FSA/RHS & VA Home Purchase Loans
B) Conventional Home Purchase Loans
C) Refinancings
D) Home Improvement Loans
F) Non-occupant Loans on < 5 Family Dwellings (A B C & D)
G) Loans On Manufactured Home Dwelling (A B C & D)
Number
Average Value
Number
Average Value
Number
Average Value
Number
Average Value
Number
Average Value
Number
Average Value
LOANS ORIGINATED
1
$50,300
2
$71,510
3
$84,337
2
$7,425
1
$12,120
1
$23,030
APPLICATIONS APPROVED, NOT ACCEPTED
0
$0
0
$0
0
$0
0
$0
0
$0
0
$0
APPLICATIONS DENIED
0
$0
1
$58,180
2
$63,175
1
$7,580
1
$30,000
1
$35,750
APPLICATIONS WITHDRAWN
0
$0
0
$0
1
$66,050
0
$0
0
$0
0
$0
FILES CLOSED FOR INCOMPLETENESS
0
$0
0
$0
0
$0
0
$0
0
$0
0
$0
Aggregated Statistics For Year 2007 (Based on 2 partial tracts)
B) Conventional Home Purchase Loans
C) Refinancings
D) Home Improvement Loans
F) Non-occupant Loans on < 5 Family Dwellings (A B C & D)
G) Loans On Manufactured Home Dwelling (A B C & D)
Number
Average Value
Number
Average Value
Number
Average Value
Number
Average Value
Number
Average Value
LOANS ORIGINATED
2
$74,540
3
$57,470
2
$13,940
1
$26,660
0
$0
APPLICATIONS APPROVED, NOT ACCEPTED
0
$0
0
$0
0
$0
0
$0
0
$0
APPLICATIONS DENIED
2
$57,875
3
$84,740
0
$0
1
$26,060
1
$31,510
APPLICATIONS WITHDRAWN
2
$34,695
1
$46,660
0
$0
1
$27,570
0
$0
FILES CLOSED FOR INCOMPLETENESS
0
$0
0
$0
0
$0
0
$0
0
$0
Aggregated Statistics For Year 2006 (Based on 2 partial tracts)
A) FHA, FSA/RHS & VA Home Purchase Loans
B) Conventional Home Purchase Loans
C) Refinancings
F) Non-occupant Loans on < 5 Family Dwellings (A B C & D)
G) Loans On Manufactured Home Dwelling (A B C & D)
Number
Average Value
Number
Average Value
Number
Average Value
Number
Average Value
Number
Average Value
LOANS ORIGINATED
1
$50,900
2
$61,810
4
$43,025
1
$65,450
2
$48,785
APPLICATIONS APPROVED, NOT ACCEPTED
0
$0
1
$28,480
0
$0
0
$0
1
$28,480
APPLICATIONS DENIED
0
$0
2
$46,965
1
$66,050
0
$0
2
$55,450
APPLICATIONS WITHDRAWN
0
$0
0
$0
1
$97,260
0
$0
0
$0
FILES CLOSED FOR INCOMPLETENESS
0
$0
0
$0
0
$0
0
$0
0
$0
Aggregated Statistics For Year 2005 (Based on 2 partial tracts)
A) FHA, FSA/RHS & VA Home Purchase Loans
B) Conventional Home Purchase Loans
C) Refinancings
D) Home Improvement Loans
G) Loans On Manufactured Home Dwelling (A B C & D)
Number
Average Value
Number
Average Value
Number
Average Value
Number
Average Value
Number
Average Value
LOANS ORIGINATED
1
$47,870
2
$36,965
4
$42,798
1
$23,330
1
$55,150
APPLICATIONS APPROVED, NOT ACCEPTED
0
$0
2
$26,360
1
$60,900
0
$0
1
$16,360
APPLICATIONS DENIED
0
$0
2
$28,480
3
$53,530
0
$0
2
$28,480
APPLICATIONS WITHDRAWN
0
$0
0
$0
1
$79,990
0
$0
0
$0
FILES CLOSED FOR INCOMPLETENESS
0
$0
0
$0
0
$0
0
$0
0
$0
Aggregated Statistics For Year 2004 (Based on 2 partial tracts)
B) Conventional Home Purchase Loans
C) Refinancings
D) Home Improvement Loans
F) Non-occupant Loans on < 5 Family Dwellings (A B C & D)
G) Loans On Manufactured Home Dwelling (A B C & D)
Number
Average Value
Number
Average Value
Number
Average Value
Number
Average Value
Number
Average Value
LOANS ORIGINATED
5
$46,238
4
$47,950
2
$9,695
2
$15,150
3
$28,483
APPLICATIONS APPROVED, NOT ACCEPTED
1
$35,750
0
$0
0
$0
0
$0
1
$35,750
APPLICATIONS DENIED
2
$41,815
2
$71,055
2
$8,030
0
$0
2
$15,605
APPLICATIONS WITHDRAWN
0
$0
1
$118,470
0
$0
0
$0
0
$0
FILES CLOSED FOR INCOMPLETENESS
0
$0
0
$0
0
$0
0
$0
0
$0
Aggregated Statistics For Year 2003 (Based on 2 partial tracts)
B) Conventional Home Purchase Loans
C) Refinancings
D) Home Improvement Loans
F) Non-occupant Loans on < 5 Family Dwellings (A B C & D)
Number
Average Value
Number
Average Value
Number
Average Value
Number
Average Value
LOANS ORIGINATED
3
$31,310
7
$45,537
3
$19,493
2
$8,330
APPLICATIONS APPROVED, NOT ACCEPTED
1
$58,480
1
$25,450
0
$0
0
$0
APPLICATIONS DENIED
2
$71,205
2
$28,180
1
$31,210
0
$0
APPLICATIONS WITHDRAWN
1
$55,450
0
$0
0
$0
0
$0
FILES CLOSED FOR INCOMPLETENESS
0
$0
0
$0
0
$0
0
$0
Aggregated Statistics For Year 2002 (Based on 2 partial tracts)
B) Conventional Home Purchase Loans
C) Refinancings
D) Home Improvement Loans
F) Non-occupant Loans on < 5 Family Dwellings (A B C & D)
Number
Average Value
Number
Average Value
Number
Average Value
Number
Average Value
LOANS ORIGINATED
2
$57,570
4
$55,145
3
$13,130
1
$15,450
APPLICATIONS APPROVED, NOT ACCEPTED
0
$0
1
$29,090
0
$0
0
$0
APPLICATIONS DENIED
2
$42,420
4
$48,782
2
$6,365
0
$0
APPLICATIONS WITHDRAWN
0
$0
0
$0
1
$6,670
0
$0
FILES CLOSED FOR INCOMPLETENESS
0
$0
0
$0
0
$0
0
$0
Aggregated Statistics For Year 2001 (Based on 2 partial tracts)
B) Conventional Home Purchase Loans
C) Refinancings
D) Home Improvement Loans
F) Non-occupant Loans on < 5 Family Dwellings (A B C & D)
Number
Average Value
Number
Average Value
Number
Average Value
Number
Average Value
LOANS ORIGINATED
3
$29,390
4
$42,572
3
$12,827
1
$12,120
APPLICATIONS APPROVED, NOT ACCEPTED
1
$56,360
1
$42,420
0
$0
0
$0
APPLICATIONS DENIED
6
$40,652
2
$69,085
2
$7,575
0
$0
APPLICATIONS WITHDRAWN
0
$0
1
$35,750
1
$20,600
0
$0
FILES CLOSED FOR INCOMPLETENESS
0
$0
0
$0
0
$0
0
$0
Aggregated Statistics For Year 2000 (Based on 2 partial tracts)
A) FHA, FSA/RHS & VA Home Purchase Loans
B) Conventional Home Purchase Loans
C) Refinancings
D) Home Improvement Loans
F) Non-occupant Loans on < 5 Family Dwellings (A B C & D)
Number
Average Value
Number
Average Value
Number
Average Value
Number
Average Value
Number
Average Value
LOANS ORIGINATED
1
$35,150
2
$35,905
3
$28,787
2
$14,845
1
$18,180
APPLICATIONS APPROVED, NOT ACCEPTED
0
$0
1
$77,270
0
$0
0
$0
0
$0
APPLICATIONS DENIED
0
$0
5
$32,360
1
$33,330
2
$10,000
0
$0
APPLICATIONS WITHDRAWN
0
$0
1
$24,540
1
$81,810
0
$0
0
$0
FILES CLOSED FOR INCOMPLETENESS
0
$0
0
$0
0
$0
0
$0
0
$0
Aggregated Statistics For Year 1999 (Based on 1 partial tract)
B) Conventional Home Purchase Loans
C) Refinancings
D) Home Improvement Loans
F) Non-occupant Loans on < 5 Family Dwellings (A B C & D)
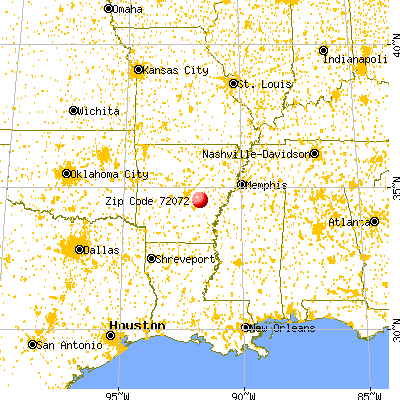


 Nearest zip codes: 72037, 72073, 72175, 72046, 72160, 72024.