Estimated zip code population in 2022: 2,957 Zip code population in 2010: 3,069 Zip code population in 2000: 2,683
Houses and condos: 1,224 Renter-occupied apartments: 332
% of renters here:
32%
State:
32%
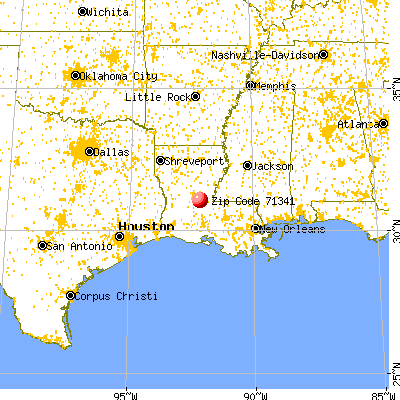
March 2022 cost of living index in zip code 71341: 81.2 (low, U.S. average is 100)
Land area: 25.7 sq. mi. Water area: 0.3 sq. mi.
Population density: 115 people per square mile
(very low).
OSM Map
General Map
Google Map
MSN Map
OSM Map
General Map
Google Map
MSN Map
OSM Map
General Map
Google Map
MSN Map
OSM Map
General Map
Google Map
MSN Map
Please wait while loading the map...
Real estate property taxes paid for housing units in 2022:
This zip code:
0.2% ($206)
Louisiana:
0.5% ($1,127)
Median real estate property taxes paid for housing units with mortgages in 2022: $208 (0.2%) Median real estate property taxes paid for housing units with no mortgage in 2022: $247 (0.2%)
Business Search- 14 Million verified businesses
Males: 1,524
(51.6%)
Females: 1,432
(48.4%)
For population 25 years and over in 71341:
High school or higher: 80.1%
Bachelor's degree or higher: 10.7%
Graduate or professional degree: 0.6%
Unemployed: 4.0%
Mean travel time to work (commute): 40.1 minutes
For population 15 years and over in 71341:
Never married: 22.1%
Now married: 47.2%
Separated: 4.9%
Widowed: 5.6%
Divorced: 20.2%
Zip code 71341 compared to state average:
Median house value below state average.
Black race population percentage below state average.
Hispanic race population percentage below state average.
Foreign-born population percentage significantly below state average.
Length of stay since moving in significantly above state average.
Percentage of population with a bachelor's degree or higher significantly below state average.
Averages for the 2020 tax year for zip code 71341, filed in 2021:
Average Adjusted Gross Income (AGI) in 2020: $46,152 (Individual Income Tax Returns)
Here:
$46,152
State:
$60,757
Salary/wage: $42,376 (reported on 84.1% of returns)
Here:
$42,376
State:
$50,882
(% of AGI for various income ranges: 1117.9% for AGIs below $25k, 3297.9% for AGIs $25k-50k, 6352.0% for AGIs $50k-75k, 10262.5% for AGIs $75k-100k, 19212.5% for AGIs $100k-200k)
Taxable interest for individuals: $923 (reported on 26.5% of returns)
This zip code:
$923
Louisiana:
$1,576
(% of AGI for various income ranges: 21.7% for AGIs below $25k, 24.3% for AGIs $25k-50k, 19.3% for AGIs $50k-75k, 60.0% for AGIs $75k-100k, 108.7% for AGIs $100k-200k)
Ordinary dividends: $1,600 (reported on 6.8% of returns)
Here:
$1,600
State:
$7,743
(% of AGI for various income ranges: 8.1% for AGIs below $25k, 12.1% for AGIs $25k-50k, 95.0% for AGIs $75k-100k)
Net capital gain/loss in AGI: +$3,110 (reported on 7.6% of returns)
Here:
+$3,110
State:
+$16,917
(% of AGI for various income ranges: 9.5% for AGIs below $25k, 14.6% for AGIs $25k-50k, 48.7% for AGIs $50k-75k, 196.2% for AGIs $100k-200k)
Profit/loss from business: +$4,910 (reported on 15.9% of returns)
Here:
+$4,910
State:
+$7,679
(% of AGI for various income ranges: 81.0% for AGIs below $25k, 67.1% for AGIs $25k-50k, 248.7% for AGIs $50k-75k, 162.5% for AGIs $100k-200k)
Taxable individual retirement arrangement distribution: $11,025 (reported on 6.1% of returns)
71341:
$11,025
Louisiana:
$20,716
(% of AGI for various income ranges: 74.0% for AGIs below $25k, 160.0% for AGIs $50k-75k, 413.8% for AGIs $75k-100k)
Earned income credit: $2,674 (reported on 26.5% of returns)
Here:
$2,674
State:
$2,671
(% of AGI for various income ranges: 163.8% for AGIs below $25k, 88.6% for AGIs $25k-50k)
Percentage of individuals using paid preparers for their 2020 taxes: 97.0%
Here:
97%
State:
92%
(% for various income ranges: 98.1% for AGIs below $25k, 94.3% for AGIs $25k-50k, 94.7% for AGIs $50k-75k, 100.0% for AGIs $75k-100k, 100.0% for AGIs $100k-200k)
Averages for the 2012 tax year for zip code 71341, filed in 2013:
Average Adjusted Gross Income (AGI) in 2012: $42,419 (Individual Income Tax Returns)
Here:
$42,419
State:
$56,730
Salary/wage: $39,197 (reported on 85.0% of returns)
Here:
$39,197
State:
$45,545
(% of AGI for various income ranges: 75.7% for AGIs below $25k, 82.3% for AGIs $25k-50k, 79.2% for AGIs $50k-75k, 83.7% for AGIs $75k-100k, 72.7% for AGIs $100k-200k)
Taxable interest for individuals: $1,453 (reported on 28.3% of returns)
This zip code:
$1,453
Louisiana:
$1,804
(% of AGI for various income ranges: 1.9% for AGIs below $25k, 1.0% for AGIs $25k-50k, 0.7% for AGIs $50k-75k, 0.5% for AGIs $75k-100k, 1.0% for AGIs $100k-200k)
Ordinary dividends: $1,212 (reported on 6.3% of returns)
Here:
$1,212
State:
$7,610
(% of AGI for various income ranges: 0.5% for AGIs below $25k, 0.2% for AGIs $25k-50k, 0.4% for AGIs $75k-100k)
Net capital gain/loss in AGI: +$1,914 (reported on 5.5% of returns)
Here:
+$1,914
State:
+$17,096
(% of AGI for various income ranges: 0.9% for AGIs $50k-75k, 0.2% for AGIs $100k-200k)
Profit/loss from business: +$7,762 (reported on 16.5% of returns)
Here:
+$7,762
State:
+$12,088
(% of AGI for various income ranges: 8.8% for AGIs below $25k, 3.2% for AGIs $25k-50k, 1.7% for AGIs $50k-75k, 4.7% for AGIs $75k-100k)
Taxable individual retirement arrangement distribution: $6,414 (reported on 5.5% of returns)
71341:
$6,414
Louisiana:
$16,085
Total itemized deductions: $18,913 (23% of AGI, reported on 11.8% of returns)
Here:
$18,913
State:
$23,585
Here:
22.8% of AGI
State:
18.1% of AGI
(% of AGI for various income ranges: 5.2% for AGIs $25k-50k, 5.1% for AGIs $50k-75k, 6.3% for AGIs $75k-100k, 7.3% for AGIs $100k-200k)
Charity contributions: $2,862 (reported on 6.3% of returns)
Here:
$2,862
State:
$5,533
Taxes paid: $3,231 (reported on 10.2% of returns)
71341:
$3,231
State:
$6,282
(% of AGI for various income ranges: 0.5% for AGIs $25k-50k, 0.5% for AGIs $50k-75k, 0.8% for AGIs $75k-100k, 1.6% for AGIs $100k-200k)
Earned income credit: $2,472 (reported on 25.2% of returns)
Here:
$2,472
State:
$2,633
(% of AGI for various income ranges: 8.8% for AGIs below $25k, 1.4% for AGIs $25k-50k)
Percentage of individuals using paid preparers for their 2012 taxes: 65.4%
Here:
65%
State:
57%
(% for various income ranges: 61.5% for AGIs below $25k, 64.9% for AGIs $25k-50k, 72.2% for AGIs $50k-75k, 70.0% for AGIs $75k-100k, 70.0% for AGIs $100k-200k)
Averages for the 2004 tax year for zip code 71341, filed in 2005:
Average Adjusted Gross Income (AGI) in 2004: $30,831 (Individual Income Tax Returns)
Here:
$30,831
State:
$39,411
Salary/wage: $29,068 (reported on 88.7% of returns)
Here:
$29,068
State:
$34,434
(% of AGI for various income ranges: 91.9% for AGIs below $10k, 79.4% for AGIs $10k-25k, 87.8% for AGIs $25k-50k, 85.9% for AGIs $50k-75k, 88.3% for AGIs $75k-100k, 63.3% for AGIs over 100k)
Taxable interest for individuals: $1,632 (reported on 35.3% of returns)
This zip code:
$1,632
Louisiana:
$1,606
(% of AGI for various income ranges: 3.0% for AGIs below $10k, 2.0% for AGIs $10k-25k, 1.9% for AGIs $25k-50k, 1.4% for AGIs $50k-75k, 0.7% for AGIs $75k-100k, 3.8% for AGIs over 100k)
Taxable dividends: $867 (reported on 9.9% of returns)
Here:
$867
State:
$3,235
(% of AGI for various income ranges: 0.6% for AGIs below $10k, 0.3% for AGIs $10k-25k, 0.4% for AGIs $25k-50k, 0.0% for AGIs $50k-75k, 0.2% for AGIs $75k-100k, 0.3% for AGIs over 100k)
Net capital gain/loss: +$389 (reported on 7.9% of returns)
Here:
+$389
State:
+$8,531
(% of AGI for various income ranges: -0.9% for AGIs below $10k, -0.2% for AGIs $10k-25k, 0.3% for AGIs $25k-50k, 0.4% for AGIs $50k-75k, -0.0% for AGIs $75k-100k, -0.2% for AGIs over 100k)
Profit/loss from business: +$4,203 (reported on 16.7% of returns)
Here:
+$4,203
State:
+$9,128
(% of AGI for various income ranges: 13.2% for AGIs below $10k, 6.8% for AGIs $10k-25k, 1.4% for AGIs $25k-50k, 0.5% for AGIs $50k-75k, 1.0% for AGIs $75k-100k)
IRA payment deduction: $2,476 (reported on 1.7% of returns)
71341:
$2,476
Louisiana:
$3,055
Total itemized deductions: $15,614 (27% of AGI, reported on 10.5% of returns)
Here:
$15,614
State:
$18,222
Here:
26.5% of AGI
State:
20.3% of AGI
(% of AGI for various income ranges: 3.5% for AGIs $10k-25k, 4.6% for AGIs $25k-50k, 6.1% for AGIs $50k-75k, 6.1% for AGIs $75k-100k, 9.3% for AGIs over 100k)
Charity contributions deductions: $3,305 (5% of AGI, reported on 7.9% of returns)
Here:
$3,305
State:
$4,190
Here:
5.3% of AGI
State:
4.4% of AGI
(% of AGI for various income ranges: 2.2% for AGIs below $10k, 0.5% for AGIs $25k-50k, 1.2% for AGIs $50k-75k, 0.4% for AGIs $75k-100k, 2.4% for AGIs over 100k)
Total tax: $3,382 (reported on 67.4% of returns)
71341:
$3,382
State:
$6,529
(% of AGI for various income ranges: 2.7% for AGIs below $10k, 3.4% for AGIs $10k-25k, 5.5% for AGIs $25k-50k, 8.2% for AGIs $50k-75k, 10.6% for AGIs $75k-100k, 15.6% for AGIs over 100k)
Earned income credit: $1,787 (reported on 29.1% of returns)
Here:
$1,787
State:
$2,103
Percentage of individuals using paid preparers for their 2004 taxes: 61.2%
Here:
61%
State:
61%
(% for various income ranges: 55.6% for AGIs below $10k, 61.4% for AGIs $10k-25k, 64.4% for AGIs $25k-50k, 63.8% for AGIs $50k-75k, 64.0% for AGIs $75k-100k, 55.2% for AGIs over 100k)
Household received Food Stamps/SNAP in the past 12 months: 286 Household did not receive Food Stamps/SNAP in the past 12 months: 752
Women who had a birth in the past 12 months: 77 (43 now married, 34 unmarried) Women who did not have a birth in the past 12 months: 532 (160 now married, 373 unmarried)
Housing units in zip code 71341 with a mortgage: 337 Median monthly owner costs for units with a mortgage: $1,030 Median monthly owner costs for units without a mortgage: $385
Residents with income below the poverty level in 2022:
This zip code:
17.9%
Whole state:
18.6%
Residents with income below 50% of the poverty level in 2022:
This zip code:
7.2%
Whole state:
10.1%
Median number of rooms in houses and condos:
Here:
6.2
State:
6.2
Median number of rooms in apartments:
Here:
4.3
State:
4.4
Notable locations in this zip code not listed on our city pages
In group quarters: 74 (-1 institutionalized population)
Size of family households: 269 2-persons, 259 3-persons, 64 4-persons, 73 5-persons, 6 6-persons, 32 7-or-more-persons
Size of nonfamily households: 230 1-person, 78 2-persons
488 married couples with children.
277 single-parent households (34 men, 243 women).
83.3% of residents of 71341 zip code speak English at home.
0.7% of residents speak Spanish at home (100% very well).
13.5% of residents speak other Indo-European language at home (87% very well, 11% well, 2% not well).
0.1% of residents speak Asian or Pacific Island language at home (50% well, 50% not well).
1.3% of residents speak other language at home (100% very well).
Foreign born population: 13 (0.4%) (92.8% of them are naturalized citizens)
This zip code:
0.4%
Whole state:
4.2%
69%Honduras
23%Japan
41%French
19%Irish
6%German
3%Dutch
2%European
2%American
2%Portuguese
Year of entry for the foreign-born population
12010 or later
02000 to 2009
81990 to 1999
1Before 1990
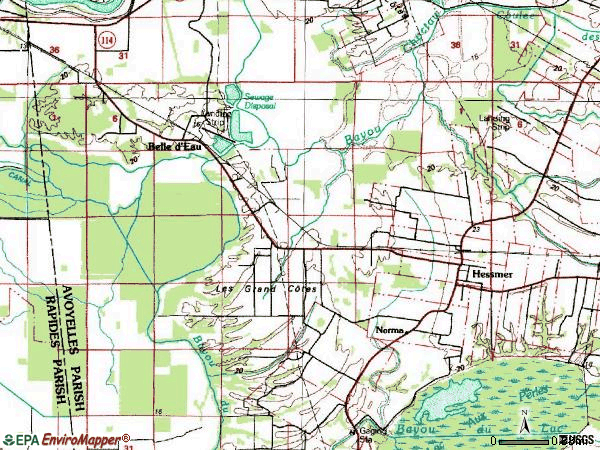
Facilities with environmental interests located in this zip code:
ALLEN CANNING COMPANY (OFF HWY 114 AT BELLE OF D'EAU 5 MILES in HESSMER, LA)
SUPERFUND (Superfund database) National Pollutant Discharge Elimination System NON-MAJOR (Tracking pollutant discharge elimination systems) - permit Business SIC classification: CANNED FRUITS, VEGETABLES, PRESERVES, JAMS, AND JELLIES Alternative names: ALLEN CANNING - HESSMER
HESSMER, VILLAGE OF (PO BOX 125 in HESSMER, LA)
National Pollutant Discharge Elimination System NON-MAJOR (Tracking pollutant discharge elimination systems) - permit COMMUNITY WATER SYSTEM (SDWIS) Business SIC classification: SEWERAGE SYSTEMS Alternative names: VILLAGE OF HESSMER
ALLEN CANNING CO - HESSMER PLANT (1581 HWY 114 in HESSMER, LA)
AIR MINOR (AIRS/AFS) Business SIC classification: CANNED FRUITS, VEGETABLES, PRESERVES, JAMS, AND JELLIES Alternative names: AVOYELLES FARMERS, PHIL MASSIE
BELLSOUTH TELECOMMUNICATIONS I (HIGHWAY 114 in HESSMER, LA)
National Pollutant Discharge Elimination System NON-MAJOR (Tracking pollutant discharge elimination systems) - permit Business SIC classification: SEWERAGE SYSTEMS Alternative names: BELLSOUTH TELECOMMU-BELL HESSM
Housing units lacking complete plumbing facilities: 3.4% Housing units lacking complete kitchen facilities: 6.5%
57.0%Electricity
42.5%Utility gas
0.6%Wood
Population in 1990: 3,057.
Place of birth for U.S.-born residents:
This state: 2,650
Midwest: 20
South: 263
West: 10
67% of the 71341 zip code residents lived in the same house 5 years ago. Out of people who lived in different houses, 71% lived in this county. Out of people who lived in different counties, 50% lived in Louisiana.
86% of the 71341 zip code residents lived in the same house 1 year ago. Out of people who lived in different houses, 35% moved from this county. Out of people who lived in different houses, 31% moved from different county within same state. Out of people who lived in different houses, 31% moved from different state.
Private vs. public school enrollment:
Students in private schools in grades 1 to 8 (elementary and middle school): 62
Here:
12.2%
Louisiana:
19.6%
Students in private schools in grades 9 to 12 (high school):
Here:
0.0%
Louisiana:
18.3%
Students in private undergraduate colleges:
Here:
0.5%
Louisiana:
17.4%
Occupation by median earnings in the past 12 months ($)
206,702Transportation occupations
59,943Production occupations
48,899Management occupations
46,962Health technologists and technicians
40,920Construction and extraction occupations
37,600Installation, maintenance, and repair occupations
Top industries in this zip code by the number of employees in 2005:
Wholesale Trade: Fresh Fruit and Vegetable Merchant Wholesalers (50-99 employees: 1 establishment, 5-9 employees: 1 establishment)
Health Care and Social Assistance: Nursing Care Facilities (50-99: 1)
Construction: Plumbing, Heating, and Air-Conditioning Contractors (20-49: 1)
Health Care and Social Assistance: Child Day Care Services (5-9: 1, 1-4: 1)
Educational Services: Elementary and Secondary Schools (5-9: 1)
People in group quarters in 2010:
69 people in nursing facilities/skilled-nursing facilities
5 people in residential treatment centers for adults
People in group quarters in 2000:
88 people in nursing homes
Fatal accident statistics in 2013:
Fatal accident count: 1
Vehicles involved in fatal accidents: 1
Fatal accidents caused by drunken drivers: 0
Fatalities: 1
Persons involved in fatal accidents: 1
Pedestrians involved in fatal accidents: 0
2002 - 2018 National Fire Incident Reporting System (NFIRS) incidents
Based on the data from the years 2002 - 2018 the average number of fires per year is 18. The highest number of fire incidents - 30 took place in 2008, and the least - 0 in 2006. The data has a rising trend.
When looking into fire subcategories, the most incidents belonged to: Outside Fires (54.6%), and Structure Fires (32.9%).
Fire incident types reported to NFIRS in Zip Code 71341


 Nearest zip codes: 71350, 71327, 71325, 71333, 71322, 71331.


 Based on the data from the years 2002 - 2018 the average number of fires per year is 18. The highest number of fire incidents - 30 took place in 2008, and the least - 0 in 2006. The data has a rising trend.
 When looking into fire subcategories, the most incidents belonged to: Outside Fires (54.6%), and Structure Fires (32.9%).