Estimated zip code population in 2022: 1,397 Zip code population in 2010: 1,621 Zip code population in 2000: 1,475
Houses and condos: 851 Renter-occupied apartments: 98
% of renters here:
18%
State:
32%
March 2022 cost of living index in zip code 70733: 81.8 (low, U.S. average is 100)
Land area: 10.3 sq. mi. Water area: 0.3 sq. mi.
Population density: 135 people per square mile
(very low).
OSM Map
General Map
Google Map
MSN Map
OSM Map
General Map
Google Map
MSN Map
OSM Map
General Map
Google Map
MSN Map
OSM Map
General Map
Google Map
MSN Map
Please wait while loading the map...
Real estate property taxes paid for housing units in 2022:
This zip code:
0.4% ($811)
Louisiana:
0.5% ($1,127)
Median real estate property taxes paid for housing units with mortgages in 2022: $878 (0.4%) Median real estate property taxes paid for housing units with no mortgage in 2022: $722 (0.3%)
Business Search- 14 Million verified businesses
Males: 800
(57.3%)
Females: 597
(42.7%)
For population 25 years and over in 70733:
High school or higher: 89.5%
Bachelor's degree or higher: 21.8%
Graduate or professional degree: 3.4%
Unemployed: 0.7%
Mean travel time to work (commute): 38.6 minutes
For population 15 years and over in 70733:
Never married: 31.4%
Now married: 47.0%
Separated: 0.9%
Widowed: 5.3%
Divorced: 15.4%
Zip code 70733 compared to state average:
Unemployed percentage significantly below state average.
Black race population percentage significantly below state average.
Hispanic race population percentage significantly below state average.
Foreign-born population percentage significantly below state average.
Renting percentage below state average.
Length of stay since moving in significantly above state average.
Averages for the 2020 tax year for zip code 70733, filed in 2021:
Average Adjusted Gross Income (AGI) in 2020: $63,089 (Individual Income Tax Returns)
Here:
$63,089
State:
$60,757
Salary/wage: $61,073 (reported on 78.8% of returns)
Here:
$61,073
State:
$50,882
(% of AGI for various income ranges: 948.6% for AGIs below $25k, 3439.3% for AGIs $25k-50k, 7245.0% for AGIs $50k-75k, 8743.3% for AGIs $75k-100k, 18751.8% for AGIs $100k-200k)
Taxable interest for individuals: $395 (reported on 23.8% of returns)
This zip code:
$395
Louisiana:
$1,576
(% of AGI for various income ranges: 8.1% for AGIs below $25k, 12.9% for AGIs $25k-50k, 21.2% for AGIs $50k-75k, 6.7% for AGIs $75k-100k, 17.3% for AGIs $100k-200k)
Ordinary dividends: $2,271 (reported on 8.8% of returns)
Here:
$2,271
State:
$7,743
(% of AGI for various income ranges: 19.0% for AGIs below $25k, 56.2% for AGIs $50k-75k, 67.3% for AGIs $100k-200k)
Net capital gain/loss in AGI: +$5,957 (reported on 8.8% of returns)
Here:
+$5,957
State:
+$16,917
(% of AGI for various income ranges: 52.9% for AGIs $25k-50k, 311.8% for AGIs $100k-200k)
Profit/loss from business: +$2,669 (reported on 16.2% of returns)
Here:
+$2,669
State:
+$7,679
(% of AGI for various income ranges: 172.9% for AGIs below $25k, 203.8% for AGIs $50k-75k)
Taxable individual retirement arrangement distribution: $20,683 (reported on 7.5% of returns)
70733:
$20,683
Louisiana:
$20,716
(% of AGI for various income ranges: 381.4% for AGIs $25k-50k, 1178.3% for AGIs $75k-100k)
Total itemized deductions: $27,180 (reported on 6.2% of returns)
Here:
$27,180
State:
$36,265
(% of AGI for various income ranges: 1235.5% for AGIs $100k-200k)
Charity contributions: $10,500 (reported on 5.0% of returns)
Here:
$10,500
State:
$13,106
(% of AGI for various income ranges: 381.8% for AGIs $100k-200k)
Taxes paid: $6,900 (reported on 6.2% of returns)
70733:
$6,900
State:
$6,643
(% of AGI for various income ranges: 313.6% for AGIs $100k-200k)
Earned income credit: $2,479 (reported on 17.5% of returns)
Here:
$2,479
State:
$2,671
(% of AGI for various income ranges: 121.4% for AGIs below $25k, 65.7% for AGIs $25k-50k)
Percentage of individuals using paid preparers for their 2020 taxes: 93.8%
Here:
94%
State:
92%
(% for various income ranges: 92.3% for AGIs below $25k, 100.0% for AGIs $25k-50k, 83.3% for AGIs $50k-75k, 100.0% for AGIs $75k-100k, 93.8% for AGIs $100k-200k)
Averages for the 2012 tax year for zip code 70733, filed in 2013:
Average Adjusted Gross Income (AGI) in 2012: $51,555 (Individual Income Tax Returns)
Here:
$51,555
State:
$56,730
Salary/wage: $49,469 (reported on 83.3% of returns)
Here:
$49,469
State:
$45,545
(% of AGI for various income ranges: 74.6% for AGIs below $25k, 75.6% for AGIs $25k-50k, 84.6% for AGIs $50k-75k, 81.8% for AGIs $75k-100k, 79.7% for AGIs $100k-200k)
Taxable interest for individuals: $414 (reported on 26.9% of returns)
This zip code:
$414
Louisiana:
$1,804
(% of AGI for various income ranges: 0.2% for AGIs below $25k, 0.6% for AGIs $25k-50k, 0.2% for AGIs $75k-100k, 0.1% for AGIs $100k-200k)
Ordinary dividends: $1,786 (reported on 9.0% of returns)
Here:
$1,786
State:
$7,610
(% of AGI for various income ranges: 0.5% for AGIs $25k-50k, 0.2% for AGIs $75k-100k, 0.5% for AGIs $100k-200k)
Net capital gain/loss in AGI: +$2,933 (reported on 7.7% of returns)
Here:
+$2,933
State:
+$17,096
Profit/loss from business: +$6,391 (reported on 14.1% of returns)
Here:
+$6,391
State:
+$12,088
(% of AGI for various income ranges: 10.9% for AGIs below $25k, 2.4% for AGIs $50k-75k, 1.4% for AGIs $100k-200k)
Taxable individual retirement arrangement distribution: $12,220 (reported on 6.4% of returns)
70733:
$12,220
Louisiana:
$16,085
Total itemized deductions: $16,560 (20% of AGI, reported on 25.6% of returns)
Here:
$16,560
State:
$23,585
Here:
20.4% of AGI
State:
18.1% of AGI
(% of AGI for various income ranges: 8.9% for AGIs $25k-50k, 7.6% for AGIs $50k-75k, 8.8% for AGIs $75k-100k, 9.7% for AGIs $100k-200k)
Charity contributions: $2,892 (reported on 15.4% of returns)
Here:
$2,892
State:
$5,533
(% of AGI for various income ranges: 1.1% for AGIs $25k-50k, 1.4% for AGIs $75k-100k, 1.0% for AGIs $100k-200k)
Taxes paid: $3,820 (reported on 25.6% of returns)
70733:
$3,820
State:
$6,282
(% of AGI for various income ranges: 0.6% for AGIs $25k-50k, 1.3% for AGIs $50k-75k, 2.1% for AGIs $75k-100k, 3.1% for AGIs $100k-200k)
Earned income credit: $1,986 (reported on 17.9% of returns)
Here:
$1,986
State:
$2,633
(% of AGI for various income ranges: 7.4% for AGIs below $25k, 0.7% for AGIs $25k-50k)
Percentage of individuals using paid preparers for their 2012 taxes: 55.1%
Here:
55%
State:
57%
(% for various income ranges: 53.8% for AGIs below $25k, 47.4% for AGIs $25k-50k, 58.3% for AGIs $50k-75k, 54.5% for AGIs $75k-100k, 70.0% for AGIs $100k-200k)
Averages for the 2004 tax year for zip code 70733, filed in 2005:
Average Adjusted Gross Income (AGI) in 2004: $38,492 (Individual Income Tax Returns)
Here:
$38,492
State:
$39,411
Salary/wage: $38,448 (reported on 86.7% of returns)
Here:
$38,448
State:
$34,434
(% of AGI for various income ranges: 81.6% for AGIs below $10k, 83.3% for AGIs $10k-25k, 85.4% for AGIs $25k-50k, 88.4% for AGIs $50k-75k, 92.7% for AGIs $75k-100k, 83.2% for AGIs over 100k)
Taxable interest for individuals: $461 (reported on 29.9% of returns)
This zip code:
$461
Louisiana:
$1,606
(% of AGI for various income ranges: 2.1% for AGIs below $10k, 0.3% for AGIs $10k-25k, 0.6% for AGIs $25k-50k, 0.2% for AGIs $50k-75k, 0.1% for AGIs $75k-100k, 0.3% for AGIs over 100k)
Taxable dividends: $411 (reported on 10.7% of returns)
Here:
$411
State:
$3,235
(% of AGI for various income ranges: 0.1% for AGIs $10k-25k, 0.1% for AGIs $25k-50k, 0.0% for AGIs $50k-75k, 0.0% for AGIs $75k-100k, 0.3% for AGIs over 100k)
Net capital gain/loss: +$2,765 (reported on 5.0% of returns)
Here:
+$2,765
State:
+$8,531
Profit/loss from business: +$306 (reported on 12.4% of returns)
Here:
+$306
State:
+$9,128
(% of AGI for various income ranges: 7.3% for AGIs below $10k, 4.1% for AGIs $10k-25k, -1.6% for AGIs $25k-50k, -0.5% for AGIs $50k-75k)
IRA payment deduction: $2,583 (reported on 1.8% of returns)
70733:
$2,583
Louisiana:
$3,055
Total itemized deductions: $17,060 (24% of AGI, reported on 21.8% of returns)
Here:
$17,060
State:
$18,222
Here:
24.1% of AGI
State:
20.3% of AGI
(% of AGI for various income ranges: 9.5% for AGIs $25k-50k, 12.2% for AGIs $50k-75k, 14.5% for AGIs $75k-100k, 9.7% for AGIs over 100k)
Charity contributions deductions: $2,148 (3% of AGI, reported on 18.7% of returns)
Here:
$2,148
State:
$4,190
Here:
2.9% of AGI
State:
4.4% of AGI
(% of AGI for various income ranges: 0.7% for AGIs $25k-50k, 1.6% for AGIs $50k-75k, 1.0% for AGIs $75k-100k, 1.7% for AGIs over 100k)
Total tax: $4,427 (reported on 75.1% of returns)
70733:
$4,427
State:
$6,529
(% of AGI for various income ranges: 2.9% for AGIs below $10k, 4.3% for AGIs $10k-25k, 6.1% for AGIs $25k-50k, 7.8% for AGIs $50k-75k, 10.0% for AGIs $75k-100k, 15.8% for AGIs over 100k)
Earned income credit: $1,762 (reported on 17.9% of returns)
Here:
$1,762
State:
$2,103
Percentage of individuals using paid preparers for their 2004 taxes: 55.8%
Here:
56%
State:
61%
(% for various income ranges: 61.0% for AGIs below $10k, 57.7% for AGIs $10k-25k, 49.7% for AGIs $25k-50k, 52.8% for AGIs $50k-75k, 58.3% for AGIs $75k-100k, 64.9% for AGIs over 100k)
Likely homosexual households (counted as self-reported same-sex unmarried-partner households)
Lesbian couples: 0.6% of all households
Gay men: 0.0% of all households
Household received Food Stamps/SNAP in the past 12 months: 80 Household did not receive Food Stamps/SNAP in the past 12 months: 455
Women who had a birth in the past 12 months: 9 (8 now married, 0 unmarried) Women who did not have a birth in the past 12 months: 226 (120 now married, 105 unmarried)
Housing units in zip code 70733 with a mortgage: 207 (19 second mortgage, 18 both second mortgage and home equity loan) Houses without a mortgage: 6
Median monthly owner costs for units with a mortgage: $1,695 Median monthly owner costs for units without a mortgage: $316
Residents with income below the poverty level in 2022:
This zip code:
24.6%
Whole state:
18.6%
Residents with income below 50% of the poverty level in 2022:
This zip code:
15.0%
Whole state:
10.1%
Median number of rooms in houses and condos:
Here:
5.1
State:
6.2
Median number of rooms in apartments:
Here:
4.6
State:
4.4
Notable locations in this zip code not listed on our city pages
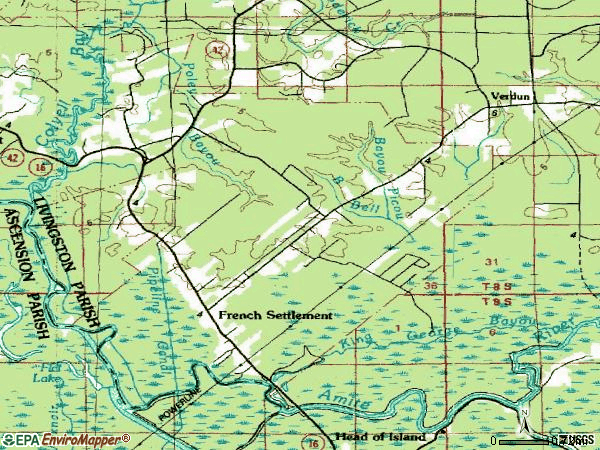
Notable locations in zip code 70733: The Y (A), French Settlement Volunteer Fire Department Fire Protection District Number 8 (B). Display/hide their locations on the map
Churches in zip code 70733 include: Saint Joseph Catholic Church (A), Mount Erie Baptist Church (B), First Baptist Church (C). Display/hide their locations on the map
Size of family households: 138 2-persons, 59 3-persons, 83 4-persons, 38 5-persons, 3 7-or-more-persons
Size of nonfamily households: 176 1-person, 37 2-persons
143 married couples with children.
149 single-parent households (30 men, 119 women).
98.4% of residents of 70733 zip code speak English at home.
0.3% of residents speak Spanish at home (100% well).
1.1% of residents speak other Indo-European language at home (100% very well).
Foreign born population: 10 (0.7%) (100.0% of them are naturalized citizens)
This zip code:
0.7%
Whole state:
4.2%
90%France
30%French
19%German
16%Italian
15%Russian
9%Irish
8%American
5%English
Year of entry for the foreign-born population
02010 or later
92000 to 2009
01990 to 1999
6Before 1990
Facilities with environmental interests located in this zip code:
FRENCH SETTLEMENT ELEMENTARY SCHOOL (15810 LA HIGHWAY 16 in FRENCH SETTLEMENT, LA)
(Geographic Names Information System) (National Center for Education Statistics) - STATE ID-032028 Organizations: LIVINGSTON PARISH SCHOOL BOARD (SCHOOL DISTRICT)
FRENCH SETTLEMENT HIGH SCHOOL (15875 LA HIGHWAY 16 in FRENCH SETTLEMENT, LA)
(Geographic Names Information System) (National Center for Education Statistics) - STATE ID-032009 Organizations: LIVINGSTON PARISH SCHOOL BOARD (SCHOOL DISTRICT)
AUTO BOATS CYCLES (16750 HWY 42 in FRENCH SETTLEMENT, LA)
(Resource Conservation and Recovery Act (tracking hazardous waste)) Business NAICS classification: AUTOMOTIVE BODY, PAINT, AND INTERIOR REPAIR AND MAINTENANCE. Organizations: JAMES WILSON (CONTACT/OWNER)
AIMES AUTOMOTIVE CNTR (17115 HWY 16 in FRENCH SETTLEMENT, LA)
Conditionally Exempt Small Quantity Generators, less than 100 kg/month of hazardous waste (Resource Conservation and Recovery Act (tracking hazardous waste)) - notification Business NAICS classification: GENERAL AUTOMOTIVE REPAIR. Organizations: RICKY AIME (CONTACT/OWNER)
R & A AUTOMOTIVE (16622 HWY 16 in FRENCH SETTLEMENT, LA)
Conditionally Exempt Small Quantity Generators, less than 100 kg/month of hazardous waste (Resource Conservation and Recovery Act (tracking hazardous waste)) - notification Business NAICS classification: OTHER AUTOMOTIVE MECHANICAL AND ELECTRICAL REPAIR AND MAINTENANCE. Organizations: HALLIE L PRUITT (CONTACT/OWNER)
Housing units lacking complete plumbing facilities: 19.4% Housing units lacking complete kitchen facilities: 7.0%
76.4%Electricity
17.3%Utility gas
4.2%Bottled, tank, or LP gas
1.9%Other fuel
0.6%Wood
Population in 1990: 3,132.
Place of birth for U.S.-born residents:
This state: 1,098
Northeast: 11
Midwest: 67
South: 188
West: 15
65% of the 70733 zip code residents lived in the same house 5 years ago. Out of people who lived in different houses, 46% lived in this county. Out of people who lived in different counties, 50% lived in Louisiana.
89% of the 70733 zip code residents lived in the same house 1 year ago. Out of people who lived in different houses, 23% moved from this county. Out of people who lived in different houses, 69% moved from different county within same state. Out of people who lived in different houses, 5% moved from different state.
Private vs. public school enrollment:
Students in private schools in grades 1 to 8 (elementary and middle school): 7
Here:
6.2%
Louisiana:
19.6%
Students in private schools in grades 9 to 12 (high school): 7
Here:
15.2%
Louisiana:
18.3%
Students in private undergraduate colleges: 12
Here:
26.1%
Louisiana:
17.4%
Occupation by median earnings in the past 12 months ($)
79,904Management occupations
75,730Material moving occupations
70,544Installation, maintenance, and repair occupations
58,240Production occupations
58,022Sales and related occupations
52,852Construction and extraction occupations
Top industries in this zip code by the number of employees in 2005:
Other Services (except Public Administration): Religious Organizations (5-9 employees: 1 establishment, 1-4 employees: 1 establishment)
Other Services (except Public Administration): General Automotive Repair (5-9: 1)
Utilities: Natural Gas Distribution (1-4: 1)
Construction: Painting and Wall Covering Contractors (1-4: 1)
Construction: Commercial and Institutional Building Construction (1-4: 1)
Arts, Entertainment, and Recreation: Dance Companies (1-4: 1)
Construction: Residential Remodelers (1-4: 1)
Fatal accident statistics in 2014:
Fatal accident count: 1
Vehicles involved in fatal accidents: 2
Fatal accidents caused by drunken drivers: 0
Fatalities: 1
Persons involved in fatal accidents: 3
Pedestrians involved in fatal accidents: 1
Fatal accident statistics in 2011:
Fatal accident count: 1
Vehicles involved in fatal accidents: 2
Fatal accidents caused by drunken drivers: 1
Fatalities: 1
Persons involved in fatal accidents: 2
Pedestrians involved in fatal accidents: 0
Home Mortgage Disclosure Act Aggregated Statistics For Year 2009 (Based on 2 partial tracts)
A) FHA, FSA/RHS & VA Home Purchase Loans
B) Conventional Home Purchase Loans
C) Refinancings
D) Home Improvement Loans
F) Non-occupant Loans on < 5 Family Dwellings (A B C & D)
G) Loans On Manufactured Home Dwelling (A B C & D)
Number
Average Value
Number
Average Value
Number
Average Value
Number
Average Value
Number
Average Value
Number
Average Value
LOANS ORIGINATED
7
$131,789
10
$81,886
36
$141,719
5
$54,152
7
$100,237
10
$57,788
APPLICATIONS APPROVED, NOT ACCEPTED
2
$150,080
2
$86,065
4
$148,338
1
$42,930
0
$0
2
$48,155
APPLICATIONS DENIED
2
$121,070
7
$62,883
20
$118,980
5
$37,830
4
$71,268
11
$71,136
APPLICATIONS WITHDRAWN
1
$186,440
2
$63,630
12
$142,632
1
$59,180
2
$93,605
3
$90,640
FILES CLOSED FOR INCOMPLETENESS
1
$251,030
1
$48,740
3
$146,597
1
$65,760
0
$0
1
$69,240
Aggregated Statistics For Year 2008 (Based on 2 partial tracts)
A) FHA, FSA/RHS & VA Home Purchase Loans
B) Conventional Home Purchase Loans
C) Refinancings
D) Home Improvement Loans
F) Non-occupant Loans on < 5 Family Dwellings (A B C & D)
G) Loans On Manufactured Home Dwelling (A B C & D)
Number
Average Value
Number
Average Value
Number
Average Value
Number
Average Value
Number
Average Value
Number
Average Value
LOANS ORIGINATED
10
$152,863
16
$117,128
27
$138,847
9
$31,073
5
$103,740
12
$56,279
APPLICATIONS APPROVED, NOT ACCEPTED
0
$0
5
$117,510
5
$149,072
2
$22,240
1
$38,680
3
$50,283
APPLICATIONS DENIED
1
$177,150
4
$56,762
18
$133,790
8
$57,730
2
$23,595
8
$46,078
APPLICATIONS WITHDRAWN
2
$128,610
3
$144,533
7
$137,867
1
$50,670
0
$0
2
$69,235
FILES CLOSED FOR INCOMPLETENESS
0
$0
0
$0
3
$144,407
1
$46,420
0
$0
1
$46,420
Aggregated Statistics For Year 2007 (Based on 2 partial tracts)
A) FHA, FSA/RHS & VA Home Purchase Loans
B) Conventional Home Purchase Loans
C) Refinancings
D) Home Improvement Loans
F) Non-occupant Loans on < 5 Family Dwellings (A B C & D)
G) Loans On Manufactured Home Dwelling (A B C & D)
Number
Average Value
Number
Average Value
Number
Average Value
Number
Average Value
Number
Average Value
Number
Average Value
LOANS ORIGINATED
5
$99,640
29
$106,277
32
$117,599
10
$29,049
7
$101,894
17
$60,364
APPLICATIONS APPROVED, NOT ACCEPTED
0
$0
4
$80,260
5
$113,952
2
$16,050
1
$119,130
3
$48,737
APPLICATIONS DENIED
2
$161,295
6
$70,848
24
$103,598
9
$45,599
0
$0
12
$64,209
APPLICATIONS WITHDRAWN
0
$0
3
$100,053
8
$131,512
3
$101,083
0
$0
3
$60,470
FILES CLOSED FOR INCOMPLETENESS
0
$0
2
$126,290
4
$157,330
0
$0
0
$0
1
$73,490
Aggregated Statistics For Year 2006 (Based on 2 partial tracts)
A) FHA, FSA/RHS & VA Home Purchase Loans
B) Conventional Home Purchase Loans
C) Refinancings
D) Home Improvement Loans
F) Non-occupant Loans on < 5 Family Dwellings (A B C & D)
G) Loans On Manufactured Home Dwelling (A B C & D)
Number
Average Value
Number
Average Value
Number
Average Value
Number
Average Value
Number
Average Value
Number
Average Value
LOANS ORIGINATED
7
$105,376
36
$101,965
32
$94,802
9
$45,557
6
$84,452
18
$52,497
APPLICATIONS APPROVED, NOT ACCEPTED
0
$0
6
$91,027
5
$86,952
1
$71,940
1
$80,450
3
$46,157
APPLICATIONS DENIED
2
$85,675
10
$70,707
15
$90,434
9
$36,016
2
$79,295
14
$45,394
APPLICATIONS WITHDRAWN
1
$164,000
4
$207,228
8
$108,062
2
$42,355
0
$0
2
$47,190
FILES CLOSED FOR INCOMPLETENESS
0
$0
2
$80,260
2
$184,695
0
$0
0
$0
0
$0
Aggregated Statistics For Year 2005 (Based on 2 partial tracts)
A) FHA, FSA/RHS & VA Home Purchase Loans
B) Conventional Home Purchase Loans
C) Refinancings
D) Home Improvement Loans
F) Non-occupant Loans on < 5 Family Dwellings (A B C & D)
G) Loans On Manufactured Home Dwelling (A B C & D)
Number
Average Value
Number
Average Value
Number
Average Value
Number
Average Value
Number
Average Value
Number
Average Value
LOANS ORIGINATED
7
$73,547
28
$99,946
31
$91,160
9
$66,659
3
$69,497
13
$58,526
APPLICATIONS APPROVED, NOT ACCEPTED
0
$0
8
$81,421
9
$111,699
2
$36,745
0
$0
3
$42,677
APPLICATIONS DENIED
2
$61,500
10
$69,199
27
$91,485
7
$47,909
0
$0
8
$51,880
APPLICATIONS WITHDRAWN
0
$0
4
$152,012
22
$131,758
3
$122,617
2
$96,120
3
$95,410
FILES CLOSED FOR INCOMPLETENESS
0
$0
2
$71,560
3
$150,467
1
$118,750
0
$0
0
$0
Aggregated Statistics For Year 2004 (Based on 2 partial tracts)
A) FHA, FSA/RHS & VA Home Purchase Loans
B) Conventional Home Purchase Loans
C) Refinancings
D) Home Improvement Loans
F) Non-occupant Loans on < 5 Family Dwellings (A B C & D)
G) Loans On Manufactured Home Dwelling (A B C & D)
Number
Average Value
Number
Average Value
Number
Average Value
Number
Average Value
Number
Average Value
Number
Average Value
LOANS ORIGINATED
3
$101,600
19
$83,854
39
$91,364
8
$26,158
3
$88,577
10
$42,200
APPLICATIONS APPROVED, NOT ACCEPTED
0
$0
4
$91,768
10
$96,545
0
$0
1
$76,590
2
$35,390
APPLICATIONS DENIED
0
$0
7
$86,477
34
$77,462
8
$41,001
1
$74,270
11
$51,304
APPLICATIONS WITHDRAWN
0
$0
1
$171,740
26
$99,720
0
$0
0
$0
3
$65,497
FILES CLOSED FOR INCOMPLETENESS
1
$41,770
2
$94,765
3
$103,147
0
$0
0
$0
0
$0
Aggregated Statistics For Year 2003 (Based on 2 partial tracts)
A) FHA, FSA/RHS & VA Home Purchase Loans
B) Conventional Home Purchase Loans
C) Refinancings
D) Home Improvement Loans
F) Non-occupant Loans on < 5 Family Dwellings (A B C & D)
Number
Average Value
Number
Average Value
Number
Average Value
Number
Average Value
Number
Average Value
LOANS ORIGINATED
4
$88,868
24
$84,612
65
$95,266
13
$18,745
7
$67,746
APPLICATIONS APPROVED, NOT ACCEPTED
0
$0
2
$67,110
17
$83,367
1
$20,500
0
$0
APPLICATIONS DENIED
1
$48,740
10
$49,008
34
$79,385
9
$25,743
0
$0
APPLICATIONS WITHDRAWN
0
$0
1
$82,390
16
$104,581
0
$0
0
$0
FILES CLOSED FOR INCOMPLETENESS
0
$0
1
$74,650
3
$89,867
0
$0
1
$43,710
Aggregated Statistics For Year 2002 (Based on 2 partial tracts)
A) FHA, FSA/RHS & VA Home Purchase Loans
B) Conventional Home Purchase Loans
C) Refinancings
D) Home Improvement Loans
F) Non-occupant Loans on < 5 Family Dwellings (A B C & D)
Number
Average Value
Number
Average Value
Number
Average Value
Number
Average Value
Number
Average Value
LOANS ORIGINATED
3
$95,540
19
$95,295
43
$83,549
8
$12,812
2
$69,625
APPLICATIONS APPROVED, NOT ACCEPTED
0
$0
5
$72,332
12
$60,663
2
$21,855
1
$43,710
APPLICATIONS DENIED
1
$64,600
12
$47,222
19
$72,942
5
$20,190
2
$48,930
APPLICATIONS WITHDRAWN
0
$0
3
$72,330
8
$83,065
0
$0
0
$0
FILES CLOSED FOR INCOMPLETENESS
1
$75,810
2
$81,810
3
$99,020
0
$0
0
$0
Aggregated Statistics For Year 2001 (Based on 2 partial tracts)
A) FHA, FSA/RHS & VA Home Purchase Loans
B) Conventional Home Purchase Loans
C) Refinancings
D) Home Improvement Loans
F) Non-occupant Loans on < 5 Family Dwellings (A B C & D)
Number
Average Value
Number
Average Value
Number
Average Value
Number
Average Value
Number
Average Value
LOANS ORIGINATED
2
$99,990
16
$68,101
53
$82,958
9
$17,621
4
$73,008
APPLICATIONS APPROVED, NOT ACCEPTED
0
$0
4
$36,842
12
$78,102
1
$23,210
0
$0
APPLICATIONS DENIED
0
$0
13
$39,245
21
$69,477
5
$18,412
2
$50,475
APPLICATIONS WITHDRAWN
1
$60,340
2
$62,275
11
$73,879
0
$0
1
$63,050
FILES CLOSED FOR INCOMPLETENESS
0
$0
0
$0
3
$103,790
0
$0
0
$0
Aggregated Statistics For Year 2000 (Based on 2 partial tracts)
A) FHA, FSA/RHS & VA Home Purchase Loans
B) Conventional Home Purchase Loans
C) Refinancings
D) Home Improvement Loans
F) Non-occupant Loans on < 5 Family Dwellings (A B C & D)
Number
Average Value
Number
Average Value
Number
Average Value
Number
Average Value
Number
Average Value
LOANS ORIGINATED
2
$71,945
23
$66,832
22
$67,989
12
$15,601
5
$82,078
APPLICATIONS APPROVED, NOT ACCEPTED
0
$0
4
$33,072
9
$74,997
2
$29,395
0
$0
APPLICATIONS DENIED
1
$47,960
21
$46,840
26
$61,620
3
$35,713
3
$38,937
APPLICATIONS WITHDRAWN
1
$84,710
3
$55,957
14
$62,219
0
$0
1
$56,860
FILES CLOSED FOR INCOMPLETENESS
0
$0
2
$42,935
2
$103,660
0
$0
0
$0
Aggregated Statistics For Year 1999 (Based on 1 partial tract)
A) FHA, FSA/RHS & VA Home Purchase Loans
B) Conventional Home Purchase Loans
C) Refinancings
D) Home Improvement Loans
F) Non-occupant Loans on < 5 Family Dwellings (A B C & D)


 Nearest zip codes: 70774, 70754, 70769, 70737, 70449, 70726.