Estimated zip code population in 2022: 1,240 Zip code population in 2010: 1,510 Zip code population in 2000: 1,531
Houses and condos: 548 Renter-occupied apartments: 43
% of renters here:
8%
State:
34%
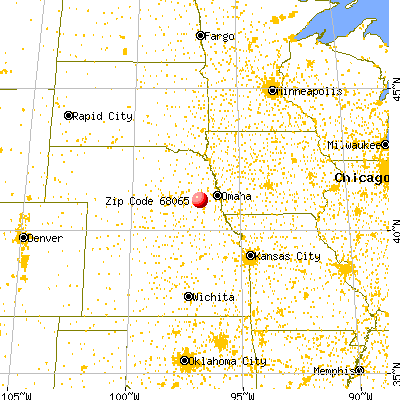
March 2022 cost of living index in zip code 68065: 75.7 (low, U.S. average is 100)
Land area: 91.0 sq. mi. Water area: 0.5 sq. mi.
Population density: 14 people per square mile
(very low).
OSM Map
General Map
Google Map
MSN Map
OSM Map
General Map
Google Map
MSN Map
OSM Map
General Map
Google Map
MSN Map
OSM Map
General Map
Google Map
MSN Map
Please wait while loading the map...
Real estate property taxes paid for housing units in 2022:
This zip code:
1.0% ($3,000)
Nebraska:
1.4% ($3,313)
Median real estate property taxes paid for housing units with mortgages in 2022: $3,009 (1.1%) Median real estate property taxes paid for housing units with no mortgage in 2022: $2,977 (1.0%)
Business Search- 14 Million verified businesses
Males: 662
(53.4%)
Females: 577
(46.6%)
For population 25 years and over in 68065:
High school or higher: 94.4%
Bachelor's degree or higher: 31.7%
Graduate or professional degree: 9.7%
Unemployed: 1.1%
Mean travel time to work (commute): 27.9 minutes
For population 15 years and over in 68065:
Never married: 20.4%
Now married: 65.7%
Separated: 0.7%
Widowed: 4.7%
Divorced: 8.5%
Zip code 68065 compared to state average:
Unemployed percentage below state average.
Black race population percentage significantly below state average.
Hispanic race population percentage significantly below state average.
Median age significantly above state average.
Foreign-born population percentage significantly below state average.
Renting percentage significantly below state average.
Length of stay since moving in significantly above state average.
Averages for the 2020 tax year for zip code 68065, filed in 2021:
Average Adjusted Gross Income (AGI) in 2020: $73,299 (Individual Income Tax Returns)
Here:
$73,299
State:
$73,874
Salary/wage: $59,079 (reported on 81.2% of returns)
Here:
$59,079
State:
$58,268
(% of AGI for various income ranges: 1332.7% for AGIs below $25k, 3644.5% for AGIs $25k-50k, 6565.0% for AGIs $50k-75k, 10164.3% for AGIs $75k-100k, 17820.0% for AGIs $100k-200k)
Taxable interest for individuals: $1,290 (reported on 44.9% of returns)
This zip code:
$1,290
Nebraska:
$1,748
(% of AGI for various income ranges: 51.8% for AGIs below $25k, 18.2% for AGIs $25k-50k, 30.0% for AGIs $50k-75k, 105.7% for AGIs $75k-100k, 266.7% for AGIs $100k-200k)
Ordinary dividends: $2,338 (reported on 23.2% of returns)
Here:
$2,338
State:
$7,841
(% of AGI for various income ranges: 17.3% for AGIs below $25k, 30.9% for AGIs $25k-50k, 76.0% for AGIs $50k-75k, 40.0% for AGIs $75k-100k, 361.7% for AGIs $100k-200k)
Net capital gain/loss in AGI: +$7,194 (reported on 23.2% of returns)
Here:
+$7,194
State:
+$21,703
(% of AGI for various income ranges: 83.6% for AGIs $25k-50k, 99.0% for AGIs $50k-75k, 308.6% for AGIs $75k-100k, 1240.0% for AGIs $100k-200k)
Profit/loss from business: +$8,189 (reported on 13.0% of returns)
Here:
+$8,189
State:
+$11,239
(% of AGI for various income ranges: 179.1% for AGIs below $25k, 237.0% for AGIs $50k-75k, 505.0% for AGIs $100k-200k)
Taxable individual retirement arrangement distribution: $13,200 (reported on 11.6% of returns)
68065:
$13,200
Nebraska:
$18,251
(% of AGI for various income ranges: 448.2% for AGIs $25k-50k, 804.3% for AGIs $75k-100k)
Total itemized deductions: $37,625 (reported on 5.8% of returns)
Here:
$37,625
State:
$37,704
(% of AGI for various income ranges: 2508.3% for AGIs $100k-200k)
Charity contributions: $8,567 (reported on 4.3% of returns)
Here:
$8,567
State:
$15,251
(% of AGI for various income ranges: 367.1% for AGIs $75k-100k)
Taxes paid: $7,650 (reported on 5.8% of returns)
68065:
$7,650
State:
$8,015
(% of AGI for various income ranges: 510.0% for AGIs $100k-200k)
Earned income credit: $2,050 (reported on 8.7% of returns)
Here:
$2,050
State:
$2,260
(% of AGI for various income ranges: 61.8% for AGIs below $25k, 50.0% for AGIs $25k-50k)
Percentage of individuals using paid preparers for their 2020 taxes: 94.2%
Here:
94%
State:
95%
(% for various income ranges: 94.1% for AGIs below $25k, 92.9% for AGIs $25k-50k, 92.9% for AGIs $50k-75k, 100.0% for AGIs $75k-100k, 91.7% for AGIs $100k-200k, 100.0% for AGIs over 200k)
Averages for the 2012 tax year for zip code 68065, filed in 2013:
Average Adjusted Gross Income (AGI) in 2012: $55,385 (Individual Income Tax Returns)
Here:
$55,385
State:
$60,572
Salary/wage: $43,815 (reported on 85.9% of returns)
Here:
$43,815
State:
$47,046
(% of AGI for various income ranges: 74.5% for AGIs below $25k, 81.0% for AGIs $25k-50k, 77.7% for AGIs $50k-75k, 70.7% for AGIs $75k-100k, 54.1% for AGIs $100k-200k)
Taxable interest for individuals: $972 (reported on 50.7% of returns)
This zip code:
$972
Nebraska:
$1,535
(% of AGI for various income ranges: 1.3% for AGIs below $25k, 0.7% for AGIs $25k-50k, 0.8% for AGIs $50k-75k, 0.6% for AGIs $75k-100k, 1.0% for AGIs $100k-200k)
Ordinary dividends: $3,847 (reported on 23.9% of returns)
Here:
$3,847
State:
$5,776
(% of AGI for various income ranges: 0.4% for AGIs below $25k, 1.0% for AGIs $25k-50k, 0.4% for AGIs $50k-75k, 0.7% for AGIs $75k-100k, 3.4% for AGIs $100k-200k)
Net capital gain/loss in AGI: +$4,607 (reported on 19.7% of returns)
Here:
+$4,607
State:
+$16,171
(% of AGI for various income ranges: 0.6% for AGIs $25k-50k, 1.8% for AGIs $50k-75k, 3.0% for AGIs $75k-100k, 1.6% for AGIs $100k-200k)
Profit/loss from business: +$6,169 (reported on 18.3% of returns)
Here:
+$6,169
State:
+$9,897
(% of AGI for various income ranges: 5.8% for AGIs below $25k, 1.6% for AGIs $25k-50k, 3.9% for AGIs $50k-75k, 2.7% for AGIs $75k-100k)
Taxable individual retirement arrangement distribution: $9,844 (reported on 12.7% of returns)
68065:
$9,844
Nebraska:
$12,804
(% of AGI for various income ranges: 3.3% for AGIs below $25k, 4.9% for AGIs $25k-50k, 7.4% for AGIs $75k-100k)
Total itemized deductions: $17,433 (21% of AGI, reported on 33.8% of returns)
Here:
$17,433
State:
$23,343
Here:
20.8% of AGI
State:
18.7% of AGI
(% of AGI for various income ranges: 11.8% for AGIs below $25k, 5.5% for AGIs $25k-50k, 9.4% for AGIs $50k-75k, 11.4% for AGIs $75k-100k, 12.8% for AGIs $100k-200k)
Charity contributions: $3,067 (reported on 25.4% of returns)
Here:
$3,067
State:
$4,921
(% of AGI for various income ranges: 1.8% for AGIs below $25k, 1.2% for AGIs $50k-75k, 1.1% for AGIs $75k-100k, 2.2% for AGIs $100k-200k)
Taxes paid: $7,074 (reported on 32.4% of returns)
68065:
$7,074
State:
$9,758
(% of AGI for various income ranges: 1.9% for AGIs below $25k, 1.6% for AGIs $25k-50k, 3.5% for AGIs $50k-75k, 4.9% for AGIs $75k-100k, 5.6% for AGIs $100k-200k)
Earned income credit: $2,000 (reported on 8.5% of returns)
Here:
$2,000
State:
$2,188
(% of AGI for various income ranges: 4.2% for AGIs below $25k)
Percentage of individuals using paid preparers for their 2012 taxes: 70.4%
Here:
70%
State:
57%
(% for various income ranges: 54.2% for AGIs below $25k, 73.3% for AGIs $25k-50k, 80.0% for AGIs $50k-75k, 87.5% for AGIs $75k-100k, 77.8% for AGIs $100k-200k)
Averages for the 2004 tax year for zip code 68065, filed in 2005:
Average Adjusted Gross Income (AGI) in 2004: $42,410 (Individual Income Tax Returns)
Here:
$42,410
State:
$44,271
Salary/wage: $36,230 (reported on 86.2% of returns)
Here:
$36,230
State:
$38,230
(% of AGI for various income ranges: 176.7% for AGIs below $10k, 70.1% for AGIs $10k-25k, 86.2% for AGIs $25k-50k, 82.5% for AGIs $50k-75k, 78.2% for AGIs $75k-100k, 46.6% for AGIs over 100k)
Taxable interest for individuals: $1,603 (reported on 59.9% of returns)
This zip code:
$1,603
Nebraska:
$1,759
(% of AGI for various income ranges: 9.2% for AGIs below $10k, 4.9% for AGIs $10k-25k, 2.5% for AGIs $25k-50k, 1.6% for AGIs $50k-75k, 0.7% for AGIs $75k-100k, 2.5% for AGIs over 100k)
Taxable dividends: $1,174 (reported on 22.8% of returns)
Here:
$1,174
State:
$2,804
(% of AGI for various income ranges: 1.4% for AGIs below $10k, 0.4% for AGIs $10k-25k, 0.3% for AGIs $25k-50k, 1.2% for AGIs $50k-75k, 0.3% for AGIs $75k-100k, 0.7% for AGIs over 100k)
Net capital gain/loss: +$5,199 (reported on 22.9% of returns)
Here:
+$5,199
State:
+$7,887
(% of AGI for various income ranges: 8.1% for AGIs below $10k, 1.6% for AGIs $10k-25k, 0.5% for AGIs $25k-50k, 0.8% for AGIs $50k-75k, 0.4% for AGIs $75k-100k, 8.7% for AGIs over 100k)
Profit/loss from business: +$6,714 (reported on 15.4% of returns)
Here:
+$6,714
State:
+$7,743
(% of AGI for various income ranges: 4.4% for AGIs $10k-25k, 3.9% for AGIs $25k-50k, 3.5% for AGIs $50k-75k, 1.5% for AGIs $75k-100k)
IRA payment deduction: $2,857 (reported on 5.1% of returns)
68065:
$2,857
Nebraska:
$2,902
Total itemized deductions: $19,144 (25% of AGI, reported on 29.5% of returns)
Here:
$19,144
State:
$18,692
Here:
24.7% of AGI
State:
21.1% of AGI
(% of AGI for various income ranges: 15.1% for AGIs $10k-25k, 8.3% for AGIs $25k-50k, 10.8% for AGIs $50k-75k, 15.0% for AGIs $75k-100k, 19.2% for AGIs over 100k)
Charity contributions deductions: $3,211 (4% of AGI, reported on 25.7% of returns)
Here:
$3,211
State:
$3,500
Here:
4.1% of AGI
State:
3.8% of AGI
(% of AGI for various income ranges: 1.3% for AGIs $10k-25k, 0.8% for AGIs $25k-50k, 1.3% for AGIs $50k-75k, 1.5% for AGIs $75k-100k, 4.3% for AGIs over 100k)
Total tax: $5,260 (reported on 79.0% of returns)
68065:
$5,260
State:
$6,550
(% of AGI for various income ranges: 4.7% for AGIs below $10k, 4.3% for AGIs $10k-25k, 6.9% for AGIs $25k-50k, 8.3% for AGIs $50k-75k, 9.3% for AGIs $75k-100k, 16.6% for AGIs over 100k)
Earned income credit: $1,677 (reported on 9.1% of returns)
Here:
$1,677
State:
$1,643
Percentage of individuals using paid preparers for their 2004 taxes: 71.4%
Here:
71%
State:
62%
(% for various income ranges: 56.6% for AGIs below $10k, 69.7% for AGIs $10k-25k, 75.9% for AGIs $25k-50k, 80.2% for AGIs $50k-75k, 74.1% for AGIs $75k-100k, 76.3% for AGIs over 100k)
Household received Food Stamps/SNAP in the past 12 months: 12 Household did not receive Food Stamps/SNAP in the past 12 months: 516
Women who had a birth in the past 12 months: 17 (18 now married, 0 unmarried) Women who did not have a birth in the past 12 months: 229 (118 now married, 110 unmarried)
Housing units in zip code 68065 with a mortgage: 241 (23 second mortgage, 22 both second mortgage and home equity loan) Houses without a mortgage: 7
Median monthly owner costs for units with a mortgage: $1,456 Median monthly owner costs for units without a mortgage: $668
Residents with income below the poverty level in 2022:
This zip code:
5.1%
Whole state:
11.2%
Residents with income below 50% of the poverty level in 2022:
This zip code:
3.6%
Whole state:
6.1%
Median number of rooms in houses and condos:
Here:
6.5
State:
7.1
Median number of rooms in apartments:
Here:
4.5
State:
4.2
Notable locations in this zip code not listed on our city pages
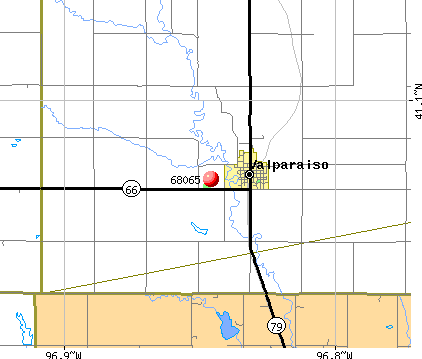
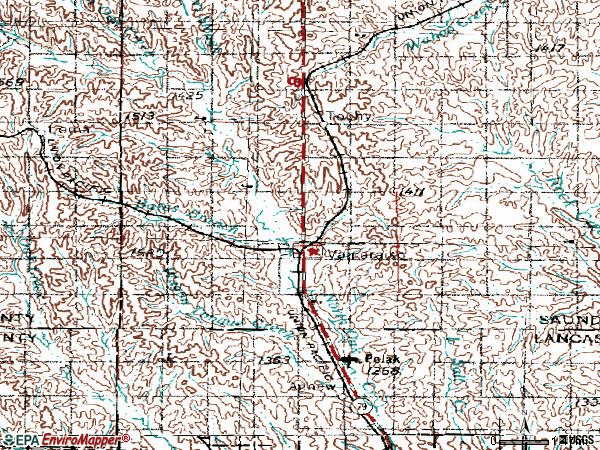
Notable locations in zip code 68065: Touhy (A), D and D Elevator (B), Valparaiso (C), Novotnys Sky Ranch (D), Polaks Sky Ranch (E), Valparaiso Public Library (F), Valparaiso Fire and Rescue (G). Display/hide their locations on the map
Cemeteries: Saint Joseph Cemetery (1), Valparaiso Cemetery (2), Saint Marys Cemetery (3), Saint Vitus Cemetery (4), Jensen Cemetery (5), Oak Grove Cemetery (6). Display/hide their locations on the map
Reservoirs: Wildwood Lake (A), S and H Farms Reservoir (B), Marshalek Reservoir (C), Schmidt Reservoir (D), Meadowlark Lake (E), North Oak Creek Reservoir 2-C (F), Larson Reservoir (G), Peanut Creek Reservoir 57-A (H). Display/hide their locations on the map
Parks in zip code 68065 include: Wildwood Lake State Wildlife Management Area (1), Larkspur State Wildlife Management Area (2). Display/hide their locations on the map
In group quarters: 29 (-1 institutionalized population)
Size of family households: 227 2-persons, 61 3-persons, 54 4-persons, 23 5-persons, 16 6-persons, 8 7-or-more-persons
Size of nonfamily households: 127 1-person, 9 2-persons
230 married couples with children.
20 single-parent households (20 women).
98.9% of residents of 68065 zip code speak English at home.
1.3% of residents speak Spanish at home (100% very well).
Foreign born population: 0 (0.0%)
:
0.0%
Whole state:
7.2%
55%Czech
25%German
6%Czechoslovakian
6%European
5%American
1%Irish
1%French
Year of entry for the foreign-born population
02010 or later
02000 to 2009
01990 to 1999
13Before 1990
Facilities with environmental interests located in this zip code:
BENES SVC CO (HWY 66 W in VALPARAISO, NE)
(Integrated Compliance Information System) - ICIS-07-1996-0110, FORMAL ENFORCEMENT ACTION COMPLIANCE ACTIVITY (Tracking inspections of insecticide, fungicide, and rodenticide, and toxic substances) Alternative names: BENES, DAVID
D & D ELEVATOR INCORPORATED (402 WEST 2ND STREET in VALPARAISO, NE)
AIR MINOR (AIRS/AFS) COMPLIANCE ACTIVITY (Tracking inspections of insecticide, fungicide, and rodenticide, and toxic substances) STATE MASTER (Nebraska tracking) - AIR PROGRAM, LEGAL SERVICES Business SIC classification: GRAIN AND FIELD BEANS Alternative names: GENES FEEDS
VALPARAISO WASTEWATER TREAT (JCT 8TH& MAPLE STREETS in VALPARAISO, NE)
STATE MASTER (Nebraska tracking) - National Pollutant Discharge Elimination System Permit, WASTEWATER FACILITY National Pollutant Discharge Elimination System NON-MAJOR (Tracking pollutant discharge elimination systems) - permit Business SIC classification: SEWERAGE SYSTEMS Organizations: GREG BOUC, UTILITY SUPT (CONTACT/OPERATOR)
Alternative names: VALPARAISO WWTF
VALPARAISO BURN SITE (3RD & CEDAR ST in VALPARAISO, NE)
AIR MINOR (AIRS/AFS) STATE MASTER (Nebraska tracking) - AIR PROGRAM Business SIC classification: AIR AND WATER RESOURCE AND SOLID WASTE MANAGEMENT
VALPARAISO LANDFILL (HIGHWAY 79 N in VALPARAISO, NE)
AIR MINOR (AIRS/AFS) STATE MASTER (Nebraska tracking) - AIR PROGRAM, REFUSE DISPOSAL Business SIC classification: AIR AND WATER RESOURCE AND SOLID WASTE MANAGEMENT
ELEMENTARY SCH AT VALPARAISO ( in VALPARAISO, NE)
(National Center for Education Statistics) - STATE ID-550161003 Organizations: RAYMOND CENTRAL SCHOOLS (SCHOOL DISTRICT)
HENRY, KEVIN (145 E 7TH ST in VALPARASIO, NE)
COMPLIANCE ACTIVITY (Tracking inspections of insecticide, fungicide, and rodenticide, and toxic substances)
Housing units lacking complete plumbing facilities: 2.1% Housing units lacking complete kitchen facilities: 2.8%
46.0%Electricity
39.9%Bottled, tank, or LP gas
6.3%Other fuel
4.3%Utility gas
3.3%Wood
0.6%Fuel oil, kerosene, etc.
Population in 1990: 1,095. Population change in the 1990s: +436 (+39.8%).
Place of birth for U.S.-born residents:
This state: 1,098
Northeast: 11
Midwest: 84
South: 1
West: 27
69% of the 68065 zip code residents lived in the same house 5 years ago. Out of people who lived in different houses, 51% lived in this county. Out of people who lived in different counties, 50% lived in Nebraska.
94% of the 68065 zip code residents lived in the same house 1 year ago. Out of people who lived in different houses, 21% moved from this county. Out of people who lived in different houses, 27% moved from different county within same state. Out of people who lived in different houses, 67% moved from different state.
Private vs. public school enrollment:
Students in private schools in grades 1 to 8 (elementary and middle school): 22
Here:
29.2%
Nebraska:
14.1%
Students in private schools in grades 9 to 12 (high school):
Here:
0.0%
Nebraska:
12.5%
Students in private undergraduate colleges: 10
Here:
25.5%
Nebraska:
18.0%
Occupation by median earnings in the past 12 months ($)
104,041Management occupations
80,942Sales and related occupations
77,132Health technologists and technicians
76,880Computer and mathematical occupations
65,493Production occupations
62,031Architecture and engineering occupations
Top industries in this zip code by the number of employees in 2005:
Construction: Plumbing, Heating, and Air-Conditioning Contractors (100-249 employees: 1 establishment)
Professional, Scientific, and Technical Services: Other Computer Related Services (50-99: 1)
Accommodation and Food Services: Full-Service Restaurants (10-19: 1, 5-9: 1)
Wholesale Trade: Farm and Garden Machinery and Equipment Merchant Wholesalers (10-19: 1)
Finance and Insurance: Commercial Banking (10-19: 1)
Construction: All Other Specialty Trade Contractors (5-9: 1, 1-4: 2)
Construction: New Single-Family Housing Construction (except Operative Builders) (5-9: 1, 1-4: 1)
People in group quarters in 2010:
25 people in other noninstitutional facilities
People in group quarters in 2000:
124 people in homes for the mentally retarded
9 people in other noninstitutional group quarters
Fatal accident statistics in 2014:
Fatal accident count: 1
Vehicles involved in fatal accidents: 2
Fatal accidents caused by drunken drivers: 0
Fatalities: 1
Persons involved in fatal accidents: 4
Pedestrians involved in fatal accidents: 0
Home Mortgage Disclosure Act Aggregated Statistics For Year 2009 (Based on 2 partial tracts)
A) FHA, FSA/RHS & VA Home Purchase Loans
B) Conventional Home Purchase Loans
C) Refinancings
D) Home Improvement Loans
F) Non-occupant Loans on < 5 Family Dwellings (A B C & D)
G) Loans On Manufactured Home Dwelling (A B C & D)
Number
Average Value
Number
Average Value
Number
Average Value
Number
Average Value
Number
Average Value
Number
Average Value
LOANS ORIGINATED
12
$157,952
12
$189,027
78
$179,578
6
$32,053
3
$150,857
1
$49,040
APPLICATIONS APPROVED, NOT ACCEPTED
0
$0
0
$0
6
$191,838
0
$0
0
$0
0
$0
APPLICATIONS DENIED
1
$271,490
1
$110,270
16
$177,950
2
$19,975
0
$0
0
$0
APPLICATIONS WITHDRAWN
0
$0
1
$130,840
11
$168,310
0
$0
0
$0
0
$0
FILES CLOSED FOR INCOMPLETENESS
0
$0
0
$0
1
$156,920
0
$0
0
$0
0
$0
Aggregated Statistics For Year 2008 (Based on 2 partial tracts)
A) FHA, FSA/RHS & VA Home Purchase Loans
B) Conventional Home Purchase Loans
C) Refinancings
D) Home Improvement Loans
F) Non-occupant Loans on < 5 Family Dwellings (A B C & D)
Number
Average Value
Number
Average Value
Number
Average Value
Number
Average Value
Number
Average Value
LOANS ORIGINATED
5
$168,348
18
$188,862
44
$162,710
4
$17,820
6
$137,938
APPLICATIONS APPROVED, NOT ACCEPTED
0
$0
1
$174,860
3
$165,687
1
$9,810
0
$0
APPLICATIONS DENIED
0
$0
1
$177,960
10
$183,036
3
$22,883
0
$0
APPLICATIONS WITHDRAWN
0
$0
1
$287,760
10
$184,423
1
$63,390
0
$0
FILES CLOSED FOR INCOMPLETENESS
0
$0
0
$0
2
$143,520
1
$130,600
0
$0
Aggregated Statistics For Year 2007 (Based on 2 partial tracts)
A) FHA, FSA/RHS & VA Home Purchase Loans
B) Conventional Home Purchase Loans
C) Refinancings
D) Home Improvement Loans
F) Non-occupant Loans on < 5 Family Dwellings (A B C & D)
G) Loans On Manufactured Home Dwelling (A B C & D)
Number
Average Value
Number
Average Value
Number
Average Value
Number
Average Value
Number
Average Value
Number
Average Value
LOANS ORIGINATED
1
$273,640
28
$150,013
38
$130,968
11
$47,101
8
$123,039
2
$53,220
APPLICATIONS APPROVED, NOT ACCEPTED
0
$0
1
$206,910
4
$121,992
1
$57,890
0
$0
0
$0
APPLICATIONS DENIED
0
$0
3
$112,583
12
$150,197
2
$57,765
2
$96,280
0
$0
APPLICATIONS WITHDRAWN
0
$0
1
$244,220
9
$162,656
0
$0
0
$0
0
$0
FILES CLOSED FOR INCOMPLETENESS
0
$0
0
$0
3
$192,557
0
$0
0
$0
0
$0
Aggregated Statistics For Year 2006 (Based on 2 partial tracts)
A) FHA, FSA/RHS & VA Home Purchase Loans
B) Conventional Home Purchase Loans
C) Refinancings
D) Home Improvement Loans
F) Non-occupant Loans on < 5 Family Dwellings (A B C & D)
G) Loans On Manufactured Home Dwelling (A B C & D)
Number
Average Value
Number
Average Value
Number
Average Value
Number
Average Value
Number
Average Value
Number
Average Value
LOANS ORIGINATED
1
$293,500
24
$149,400
40
$143,974
8
$32,710
6
$116,850
1
$47,360
APPLICATIONS APPROVED, NOT ACCEPTED
0
$0
1
$265,030
6
$150,218
1
$59,800
0
$0
0
$0
APPLICATIONS DENIED
0
$0
2
$128,690
14
$149,039
2
$34,685
0
$0
0
$0
APPLICATIONS WITHDRAWN
0
$0
3
$128,930
8
$142,592
1
$56,450
1
$260,490
0
$0
FILES CLOSED FOR INCOMPLETENESS
0
$0
0
$0
0
$0
0
$0
0
$0
0
$0
Aggregated Statistics For Year 2005 (Based on 2 partial tracts)
A) FHA, FSA/RHS & VA Home Purchase Loans
B) Conventional Home Purchase Loans
C) Refinancings
D) Home Improvement Loans
F) Non-occupant Loans on < 5 Family Dwellings (A B C & D)
Number
Average Value
Number
Average Value
Number
Average Value
Number
Average Value
Number
Average Value
LOANS ORIGINATED
5
$134,430
40
$134,114
43
$138,241
9
$35,508
3
$207,387
APPLICATIONS APPROVED, NOT ACCEPTED
0
$0
2
$86,230
5
$125,962
0
$0
0
$0
APPLICATIONS DENIED
0
$0
3
$100,147
11
$150,087
1
$91,370
1
$105,490
APPLICATIONS WITHDRAWN
1
$230,110
3
$118,323
8
$177,785
1
$132,040
0
$0
FILES CLOSED FOR INCOMPLETENESS
0
$0
0
$0
2
$151,770
0
$0
0
$0
Aggregated Statistics For Year 2004 (Based on 2 partial tracts)
A) FHA, FSA/RHS & VA Home Purchase Loans
B) Conventional Home Purchase Loans
C) Refinancings
D) Home Improvement Loans
F) Non-occupant Loans on < 5 Family Dwellings (A B C & D)
G) Loans On Manufactured Home Dwelling (A B C & D)
Number
Average Value
Number
Average Value
Number
Average Value
Number
Average Value
Number
Average Value
Number
Average Value
LOANS ORIGINATED
5
$151,844
36
$133,015
48
$143,146
9
$33,648
4
$91,732
2
$60,280
APPLICATIONS APPROVED, NOT ACCEPTED
0
$0
4
$122,770
2
$191,120
0
$0
0
$0
0
$0
APPLICATIONS DENIED
0
$0
3
$119,200
12
$135,587
2
$43,175
1
$91,850
0
$0
APPLICATIONS WITHDRAWN
1
$85,630
3
$104,133
8
$95,411
1
$28,700
0
$0
0
$0
FILES CLOSED FOR INCOMPLETENESS
0
$0
0
$0
3
$172,623
0
$0
0
$0
0
$0
Aggregated Statistics For Year 2003 (Based on 2 partial tracts)
A) FHA, FSA/RHS & VA Home Purchase Loans
B) Conventional Home Purchase Loans
C) Refinancings
D) Home Improvement Loans
F) Non-occupant Loans on < 5 Family Dwellings (A B C & D)
Number
Average Value
Number
Average Value
Number
Average Value
Number
Average Value
Number
Average Value
LOANS ORIGINATED
5
$121,036
15
$125,979
87
$144,161
5
$27,748
2
$76,905
APPLICATIONS APPROVED, NOT ACCEPTED
0
$0
1
$108,600
6
$161,660
0
$0
0
$0
APPLICATIONS DENIED
0
$0
0
$0
11
$174,334
0
$0
0
$0
APPLICATIONS WITHDRAWN
0
$0
1
$90,660
9
$151,573
0
$0
0
$0
FILES CLOSED FOR INCOMPLETENESS
0
$0
0
$0
1
$212,890
0
$0
0
$0
Aggregated Statistics For Year 2002 (Based on 2 partial tracts)
A) FHA, FSA/RHS & VA Home Purchase Loans
B) Conventional Home Purchase Loans
C) Refinancings
D) Home Improvement Loans
F) Non-occupant Loans on < 5 Family Dwellings (A B C & D)
Number
Average Value
Number
Average Value
Number
Average Value
Number
Average Value
Number
Average Value
LOANS ORIGINATED
1
$94,240
8
$123,308
62
$137,845
5
$29,804
2
$63,625
APPLICATIONS APPROVED, NOT ACCEPTED
0
$0
1
$83,000
8
$133,742
0
$0
0
$0
APPLICATIONS DENIED
0
$0
1
$128,930
9
$145,939
1
$17,220
0
$0
APPLICATIONS WITHDRAWN
0
$0
0
$0
7
$148,304
0
$0
0
$0
FILES CLOSED FOR INCOMPLETENESS
0
$0
0
$0
2
$97,475
0
$0
0
$0
Aggregated Statistics For Year 2001 (Based on 2 partial tracts)
B) Conventional Home Purchase Loans
C) Refinancings
D) Home Improvement Loans
F) Non-occupant Loans on < 5 Family Dwellings (A B C & D)
Number
Average Value
Number
Average Value
Number
Average Value
Number
Average Value
LOANS ORIGINATED
6
$173,022
47
$122,109
6
$14,950
2
$97,715
APPLICATIONS APPROVED, NOT ACCEPTED
0
$0
3
$112,107
0
$0
0
$0
APPLICATIONS DENIED
1
$122,470
8
$107,191
2
$23,800
0
$0
APPLICATIONS WITHDRAWN
0
$0
5
$127,302
0
$0
0
$0
FILES CLOSED FOR INCOMPLETENESS
0
$0
2
$110,390
0
$0
0
$0
Aggregated Statistics For Year 2000 (Based on 2 partial tracts)
A) FHA, FSA/RHS & VA Home Purchase Loans
B) Conventional Home Purchase Loans
C) Refinancings
D) Home Improvement Loans
F) Non-occupant Loans on < 5 Family Dwellings (A B C & D)
Number
Average Value
Number
Average Value
Number
Average Value
Number
Average Value
Number
Average Value
LOANS ORIGINATED
2
$95,680
8
$146,091
16
$120,093
5
$20,380
1
$54,300
APPLICATIONS APPROVED, NOT ACCEPTED
0
$0
1
$103,100
2
$94,960
1
$11,240
0
$0
APPLICATIONS DENIED
0
$0
2
$77,980
5
$103,382
1
$12,200
0
$0
APPLICATIONS WITHDRAWN
0
$0
0
$0
3
$83,960
0
$0
0
$0
FILES CLOSED FOR INCOMPLETENESS
0
$0
0
$0
1
$174,860
0
$0
0
$0
Aggregated Statistics For Year 1999 (Based on 1 partial tract)
Detailed PMIC statistics for the following Tracts:0102.00
2002 - 2016 National Fire Incident Reporting System (NFIRS) incidents
Based on the data from the years 2002 - 2016 the average number of fire incidents per year is 8. The highest number of fires - 20 took place in 2002, and the least - 0 in 2007. The data has a decreasing trend.
When looking into fire subcategories, the most reports belonged to: Outside Fires (69.2%), and Structure Fires (19.7%).
Fire incident types reported to NFIRS in Zip Code 68065


 Nearest zip codes: 68428, 68070, 68402, 68360, 68524, 68635.


 Based on the data from the years 2002 - 2016 the average number of fire incidents per year is 8. The highest number of fires - 20 took place in 2002, and the least - 0 in 2007. The data has a decreasing trend.
 When looking into fire subcategories, the most reports belonged to: Outside Fires (69.2%), and Structure Fires (19.7%).