Estimated zip code population in 2022: 2,629 Zip code population in 2010: 1,839 Zip code population in 2000: 1,760
March 2022 cost of living index in zip code 66013: 79.5 (low, U.S. average is 100)
Land area: 42.0 sq. mi. Water area: 0.5 sq. mi.
Population density: 63 people per square mile
(very low).
OSM Map
General Map
Google Map
MSN Map
OSM Map
General Map
Google Map
MSN Map
OSM Map
General Map
Google Map
MSN Map
OSM Map
General Map
Google Map
MSN Map
Please wait while loading the map...
Real estate property taxes paid for housing units in 2022:
This zip code:
0.9% ($6,927)
Kansas:
1.2% ($2,578)
Median real estate property taxes paid for housing units with mortgages in 2022: $6,638 (1.0%) Median real estate property taxes paid for housing units with no mortgage in 2022: $7,464 (0.9%)
Business Search- 14 Million verified businesses
Males: 1,419
(54.0%)
Females: 1,208
(46.0%)
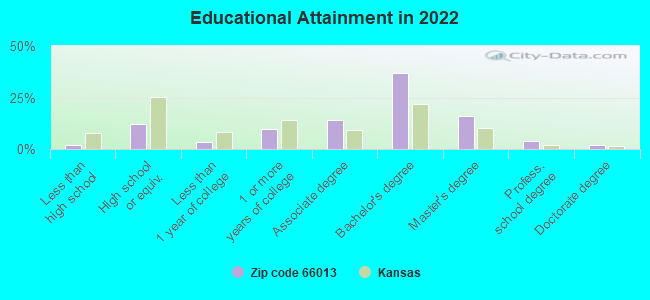
For population 25 years and over in 66013:
High school or higher: 99.2%
Bachelor's degree or higher: 59.3%
Graduate or professional degree: 22.2%
Mean travel time to work (commute): 26.3 minutes
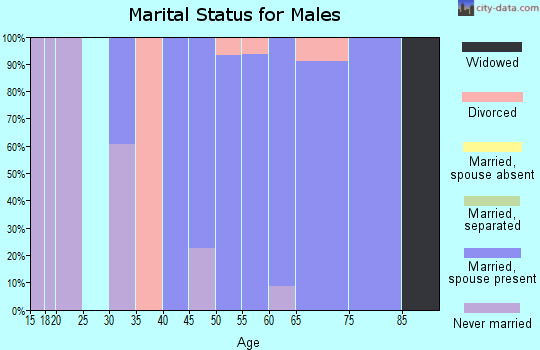
For population 15 years and over in 66013:
Never married: 17.9%
Now married: 74.4%
Separated: 0.0%
Widowed: 4.6%
Divorced: 3.1%
Zip code 66013 compared to state average:
Median household income significantly above state average.
Median house value significantly above state average.
Unemployed percentage significantly below state average.
Black race population percentage significantly below state average.
Hispanic race population percentage significantly below state average.
Foreign-born population percentage significantly below state average.
Renting percentage significantly below state average.
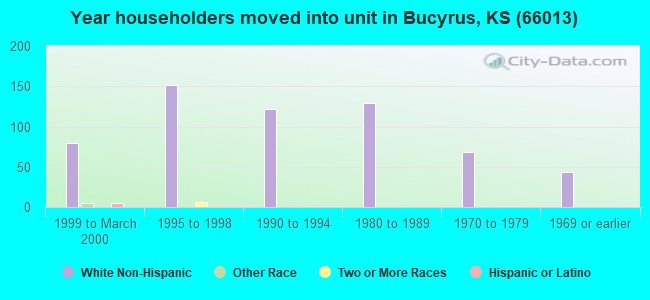
Length of stay since moving in above state average.
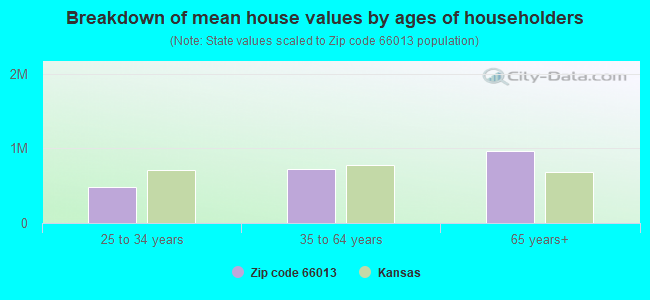
Estimated median house/condo value in 2022: $740,944
66013:
$740,944
Kansas:
$206,600
According to our research of Kansas and other state lists, there were 5 registered sex offenders living in 66013 zip code as of May 17, 2024. The ratio of all residents to sex offenders in zip code 66013 is 414 to 1. The ratio of registered sex offenders to all residents in this zip code is lower than the state average.
Median resident age:
This zip code:
38.7 years
Kansas median age:
37.6 years
Average household size:
This zip code:
3.4 people
Kansas:
2.4 people
Averages for the 2020 tax year for zip code 66013, filed in 2021:
Average Adjusted Gross Income (AGI) in 2020: $182,544 (Individual Income Tax Returns)
Here:
$182,544
State:
$72,721
Salary/wage: $124,871 (reported on 82.9% of returns)
Here:
$124,871
State:
$58,641
(% of AGI for various income ranges: 1502.3% for AGIs below $25k, 4930.0% for AGIs $25k-50k, 6841.4% for AGIs $50k-75k, 10354.0% for AGIs $75k-100k, 19527.5% for AGIs $100k-200k, 102922.9% for AGIs over 200k)
Taxable interest for individuals: $3,435 (reported on 48.7% of returns)
This zip code:
$3,435
Kansas:
$1,625
(% of AGI for various income ranges: 25.4% for AGIs below $25k, 60.8% for AGIs $25k-50k, 115.7% for AGIs $50k-75k, 144.0% for AGIs $75k-100k, 334.4% for AGIs $100k-200k, 1662.9% for AGIs over 200k)
Ordinary dividends: $9,316 (reported on 42.7% of returns)
Here:
$9,316
State:
$7,290
(% of AGI for various income ranges: 33.1% for AGIs below $25k, 175.8% for AGIs $25k-50k, 464.3% for AGIs $50k-75k, 518.0% for AGIs $75k-100k, 440.6% for AGIs $100k-200k, 4450.0% for AGIs over 200k)
Net capital gain/loss in AGI: +$36,411 (reported on 38.5% of returns)
Here:
+$36,411
State:
+$20,511
(% of AGI for various income ranges: 10.8% for AGIs below $25k, 146.7% for AGIs $25k-50k, 201.4% for AGIs $50k-75k, 914.0% for AGIs $75k-100k, 639.4% for AGIs $100k-200k, 20820.0% for AGIs over 200k)
Profit/loss from business: +$23,388 (reported on 21.4% of returns)
Here:
+$23,388
State:
+$13,852
(% of AGI for various income ranges: 239.2% for AGIs below $25k, 412.5% for AGIs $25k-50k, 531.4% for AGIs $50k-75k, 558.0% for AGIs $75k-100k, 808.8% for AGIs $100k-200k, 4422.9% for AGIs over 200k)
Taxable individual retirement arrangement distribution: $26,962 (reported on 11.1% of returns)
66013:
$26,962
Kansas:
$19,921
(% of AGI for various income ranges: 263.8% for AGIs below $25k, 1252.9% for AGIs $50k-75k, 735.6% for AGIs $100k-200k, 1582.9% for AGIs over 200k)
Total itemized deductions: $43,696 (reported on 23.9% of returns)
Here:
$43,696
State:
$36,939
(% of AGI for various income ranges: 670.8% for AGIs $25k-50k, 1430.0% for AGIs $75k-100k, 1588.1% for AGIs $100k-200k, 11677.1% for AGIs over 200k)
Charity contributions: $18,604 (reported on 21.4% of returns)
Here:
$18,604
State:
$15,443
(% of AGI for various income ranges: 616.0% for AGIs $75k-100k, 305.6% for AGIs $100k-200k, 5505.7% for AGIs over 200k)
Taxes paid: $9,582 (reported on 23.9% of returns)
66013:
$9,582
State:
$8,001
(% of AGI for various income ranges: 166.7% for AGIs $25k-50k, 380.0% for AGIs $75k-100k, 472.5% for AGIs $100k-200k, 2195.7% for AGIs over 200k)
Earned income credit: $1,717 (reported on 5.1% of returns)
Here:
$1,717
State:
$2,267
(% of AGI for various income ranges: 32.3% for AGIs below $25k, 50.8% for AGIs $25k-50k)
Percentage of individuals using paid preparers for their 2020 taxes: 94.0%
Here:
94%
State:
95%
(% for various income ranges: 92.0% for AGIs below $25k, 88.9% for AGIs $25k-50k, 91.7% for AGIs $50k-75k, 100.0% for AGIs $75k-100k, 96.4% for AGIs $100k-200k, 96.0% for AGIs over 200k)
Averages for the 2012 tax year for zip code 66013, filed in 2013:
Average Adjusted Gross Income (AGI) in 2012: $123,031 (Individual Income Tax Returns)
Here:
$123,031
State:
$60,095
Salary/wage: $85,385 (reported on 81.3% of returns)
Here:
$85,385
State:
$48,770
(% of AGI for various income ranges: 65.8% for AGIs below $25k, 79.5% for AGIs $25k-50k, 74.3% for AGIs $50k-75k, 70.6% for AGIs $75k-100k, 74.9% for AGIs $100k-200k, 44.5% for AGIs over 200k)
Taxable interest for individuals: $3,575 (reported on 48.4% of returns)
This zip code:
$3,575
Kansas:
$1,506
(% of AGI for various income ranges: 1.7% for AGIs below $25k, 1.7% for AGIs $25k-50k, 1.6% for AGIs $50k-75k, 0.6% for AGIs $75k-100k, 0.5% for AGIs $100k-200k, 1.8% for AGIs over 200k)
Ordinary dividends: $7,288 (reported on 36.3% of returns)
Here:
$7,288
State:
$6,093
(% of AGI for various income ranges: 2.0% for AGIs below $25k, 1.4% for AGIs $25k-50k, 4.7% for AGIs $50k-75k, 0.9% for AGIs $75k-100k, 1.4% for AGIs $100k-200k, 2.4% for AGIs over 200k)
Net capital gain/loss in AGI: +$57,400 (reported on 29.7% of returns)
Here:
+$57,400
State:
+$14,598
(% of AGI for various income ranges: 0.3% for AGIs below $25k, 0.4% for AGIs $75k-100k, 23.2% for AGIs over 200k)
Profit/loss from business: +$25,218 (reported on 24.2% of returns)
Here:
+$25,218
State:
+$12,554
(% of AGI for various income ranges: 14.1% for AGIs below $25k, 3.7% for AGIs $25k-50k, 6.4% for AGIs $75k-100k, 6.9% for AGIs $100k-200k, 4.2% for AGIs over 200k)
Taxable individual retirement arrangement distribution: $17,618 (reported on 12.1% of returns)
66013:
$17,618
Kansas:
$14,098
(% of AGI for various income ranges: 9.0% for AGIs $25k-50k, 5.7% for AGIs $75k-100k, 4.2% for AGIs $100k-200k)
Total itemized deductions: $42,711 (19% of AGI, reported on 48.4% of returns)
Here:
$42,711
State:
$23,678
Here:
18.8% of AGI
State:
18.9% of AGI
(% of AGI for various income ranges: 13.5% for AGIs below $25k, 14.4% for AGIs $25k-50k, 18.9% for AGIs $50k-75k, 20.9% for AGIs $75k-100k, 18.5% for AGIs $100k-200k, 15.9% for AGIs over 200k)
Charity contributions: $10,345 (reported on 41.8% of returns)
Here:
$10,345
State:
$5,321
(% of AGI for various income ranges: 2.1% for AGIs below $25k, 1.0% for AGIs $25k-50k, 1.6% for AGIs $50k-75k, 2.5% for AGIs $75k-100k, 2.9% for AGIs $100k-200k, 4.3% for AGIs over 200k)
Taxes paid: $19,350 (reported on 48.4% of returns)
66013:
$19,350
State:
$9,548
(% of AGI for various income ranges: 3.3% for AGIs below $25k, 4.2% for AGIs $25k-50k, 6.6% for AGIs $50k-75k, 7.2% for AGIs $75k-100k, 8.4% for AGIs $100k-200k, 7.9% for AGIs over 200k)
Earned income credit: $1,825 (reported on 8.8% of returns)
Here:
$1,825
State:
$2,212
(% of AGI for various income ranges: 2.8% for AGIs below $25k, 1.1% for AGIs $25k-50k)
Percentage of individuals using paid preparers for their 2012 taxes: 61.5%
Here:
62%
State:
56%
(% for various income ranges: 56.7% for AGIs below $25k, 56.2% for AGIs $25k-50k, 55.6% for AGIs $50k-75k, 66.7% for AGIs $75k-100k, 64.7% for AGIs $100k-200k, 80.0% for AGIs over 200k)
Averages for the 2004 tax year for zip code 66013, filed in 2005:
Average Adjusted Gross Income (AGI) in 2004: $105,710 (Individual Income Tax Returns)
Here:
$105,710
State:
$45,726
Salary/wage: $64,457 (reported on 84.9% of returns)
Here:
$64,457
State:
$40,112
(% of AGI for various income ranges: 75.5% for AGIs $10k-25k, 80.0% for AGIs $25k-50k, 79.8% for AGIs $50k-75k, 81.0% for AGIs $75k-100k, 39.2% for AGIs over 100k)
Taxable interest for individuals: $2,956 (reported on 62.0% of returns)
This zip code:
$2,956
Kansas:
$1,749
(% of AGI for various income ranges: 4.6% for AGIs $10k-25k, 3.8% for AGIs $25k-50k, 1.2% for AGIs $50k-75k, 0.9% for AGIs $75k-100k, 1.4% for AGIs over 100k)
Taxable dividends: $4,043 (reported on 37.2% of returns)
Here:
$4,043
State:
$3,066
(% of AGI for various income ranges: 0.8% for AGIs $10k-25k, 2.0% for AGIs $25k-50k, 1.0% for AGIs $50k-75k, 0.9% for AGIs $75k-100k, 1.3% for AGIs over 100k)
Net capital gain/loss: +$16,865 (reported on 30.4% of returns)
Here:
+$16,865
State:
+$7,555
(% of AGI for various income ranges: 0.7% for AGIs $10k-25k, -0.0% for AGIs $25k-50k, 1.1% for AGIs $50k-75k, 3.0% for AGIs $75k-100k, 5.8% for AGIs over 100k)
Profit/loss from business: +$11,649 (reported on 19.5% of returns)
Here:
+$11,649
State:
+$9,571
(% of AGI for various income ranges: 6.0% for AGIs $10k-25k, 1.5% for AGIs $25k-50k, 4.4% for AGIs $50k-75k, 4.5% for AGIs $75k-100k, 1.6% for AGIs over 100k)
IRA payment deduction: $3,444 (reported on 4.1% of returns)
66013:
$3,444
Kansas:
$2,922
(% of AGI for various income ranges: 1.7% for AGIs $10k-25k, 0.4% for AGIs $50k-75k, 0.8% for AGIs $75k-100k)
Self-employed pension: $19,667 (reported on 2.0% of returns)
Here:
$19,667
Kansas:
$14,209
Total itemized deductions: $32,455 (16% of AGI, reported on 47.2% of returns)
Here:
$32,455
State:
$18,779
Here:
15.7% of AGI
State:
20.5% of AGI
(% of AGI for various income ranges: 11.4% for AGIs $10k-25k, 21.3% for AGIs $25k-50k, 15.8% for AGIs $50k-75k, 19.4% for AGIs $75k-100k, 12.7% for AGIs over 100k)
Charity contributions deductions: $5,916 (3% of AGI, reported on 42.0% of returns)
Here:
$5,916
State:
$3,892
Here:
2.6% of AGI
State:
4.0% of AGI
(% of AGI for various income ranges: 1.1% for AGIs $10k-25k, 2.2% for AGIs $25k-50k, 1.8% for AGIs $50k-75k, 2.6% for AGIs $75k-100k, 2.3% for AGIs over 100k)
Total tax: $18,322 (reported on 78.5% of returns)
66013:
$18,322
State:
$7,203
(% of AGI for various income ranges: 5.2% for AGIs $10k-25k, 6.2% for AGIs $25k-50k, 9.1% for AGIs $50k-75k, 10.3% for AGIs $75k-100k, 14.6% for AGIs over 100k)
Earned income credit: $1,581 (reported on 4.9% of returns)
Here:
$1,581
State:
$1,674
Percentage of individuals using paid preparers for their 2004 taxes: 63.9%
Here:
64%
State:
63%
(% for various income ranges: 55.9% for AGIs below $10k, 58.2% for AGIs $10k-25k, 62.2% for AGIs $25k-50k, 68.2% for AGIs $50k-75k, 61.8% for AGIs $75k-100k, 76.2% for AGIs over 100k)
Household received Food Stamps/SNAP in the past 12 months: 0 Household did not receive Food Stamps/SNAP in the past 12 months: 765
Women who had a birth in the past 12 months: 19 (19 now married, 0 unmarried) Women who did not have a birth in the past 12 months: 521 (334 now married, 185 unmarried)
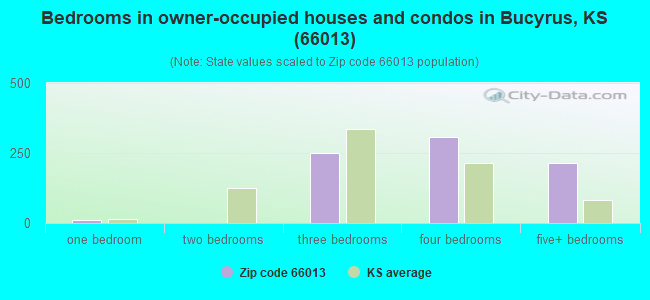
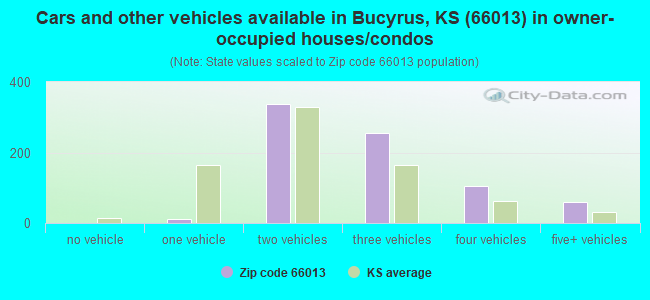
Housing units in zip code 66013 with a mortgage: 442 (43 second mortgage, 45 both second mortgage and home equity loan) Median monthly owner costs for units with a mortgage: $2,866 Median monthly owner costs for units without a mortgage: $1,069
Residents with income below the poverty level in 2022:
This zip code:
2.3%
Whole state:
12.0%
Residents with income below 50% of the poverty level in 2022:
This zip code:
0.2%
Whole state:
6.4%
Median number of rooms in houses and condos:
Here:
7.9
State:
6.9
Notable locations in this zip code not listed on our city pages
Notable locations in zip code 66013: Bucyrus Wastewater Plant (A), Griffin Industrial Park (B), Guetterman Brothers Elevator Grain Elevator Number 1 (C). Display/hide their locations on the map
Size of family households: 254 2-persons, 117 3-persons, 117 4-persons, 94 5-persons, 26 6-persons, 50 7-or-more-persons
Size of nonfamily households: 81 1-person, 14 2-persons
997 married couples with children.
33 single-parent households (33 women).
96.5% of residents of 66013 zip code speak English at home.
2.8% of residents speak Spanish at home (41% very well, 29% well, 30% not well).
0.2% of residents speak other Indo-European language at home (100% very well).
0.4% of residents speak Asian or Pacific Island language at home (100% very well).
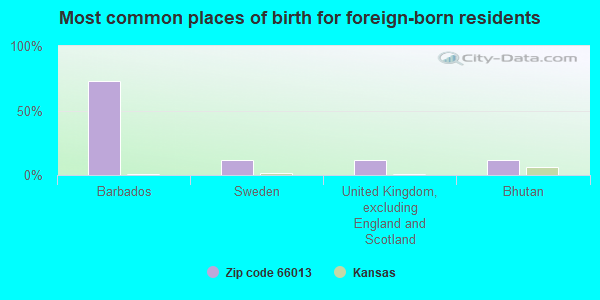
Foreign born population: 69 (2.6%) (35.5% of them are naturalized citizens)
This zip code:
2.6%
Whole state:
7.1%
73%Barbados
11%Sweden
11%United Kingdom, excluding England and Scotland
11%Bhutan
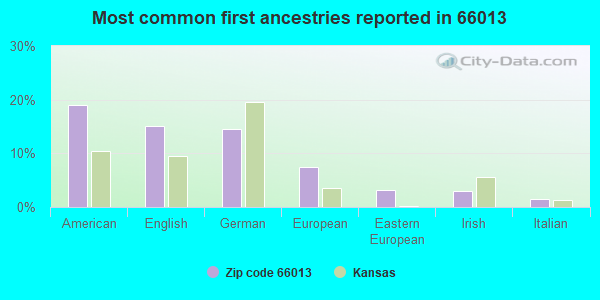
19%American
15%English
15%German
7%European
3%Eastern European
3%Irish
2%Italian
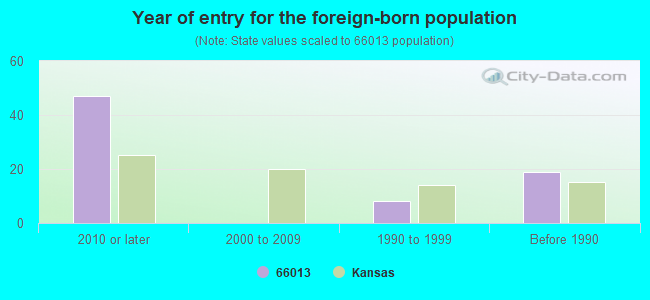
Year of entry for the foreign-born population
472010 or later
02000 to 2009
81990 to 1999
19Before 1990
Facilities with environmental interests located in this zip code:
MCCORKENDALE CONST INC (20750 S FOSTER COURT in BUCYRUS, KS)
STATE MASTER (Kansas Facility Profiler) - TANKS-43822, UNDERGROUND STORAGE TANK PROGRAM Conditionally Exempt Small Quantity Generators, less than 100 kg/month of hazardous waste (Resource Conservation and Recovery Act (tracking hazardous waste)) Organizations: MCCLAN LLC (CONTACT/OWNER)
, MCCORKENDALE CONSTRUCTION INC. (OWNER/OPERATOR)
BUCYRUS ELEVATOR INC. (MAIN ST. in BUCYRUS, KS)
AIR MINOR (AIRS/AFS) STATE MASTER (Kansas Facility Profiler) - ISTEPS-12100010, AIR PROGRAM Business SIC classification: GRAIN AND FIELD BEANS Business NAICS classification: GRAIN AND FIELD BEAN WHOLESALERS. Alternative names: CLOSED FACILITY - BUCYRUS ELEVATOR INC.
BUCYRUS WASTEWATER PLANT (21900 S. BUCYRUS RD in BUCYRUS, KS)
National Pollutant Discharge Elimination System NON-MAJOR (Tracking pollutant discharge elimination systems) - permit Business SIC classification: SEWERAGE SYSTEMS Organizations: MIAMI CO S.D #2 BUCYRUS (CONTACT/OWNER)
Alternative names: MIAMI CO S.D #2 BUCYRUS, MIAMI CO. SEWER DISTRICT NO.2
MEYERS TURF FARMS (12390 WEST 215TH STREET (215TH & QUIVIRA) in BUCYRUS, KS)
(Resource Conservation and Recovery Act (tracking hazardous waste)) Organizations: JACK MEYERS (CONTACT/OWNER)
Housing units lacking complete plumbing facilities: 1.4% Housing units lacking complete kitchen facilities: 8.2%
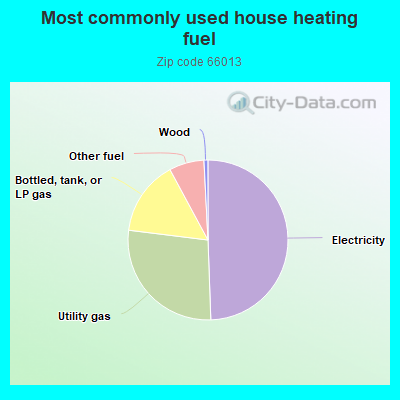
49.6%Electricity
27.6%Utility gas
15.2%Bottled, tank, or LP gas
7.1%Other fuel
0.8%Wood
Population in 1990: 989. Population change in the 1990s: +771 (+78.0%).
Place of birth for U.S.-born residents:
This state: 1,008
Northeast: 84
Midwest: 896
South: 372
West: 179
62% of the 66013 zip code residents lived in the same house 5 years ago. Out of people who lived in different houses, 42% lived in this county. Out of people who lived in different counties, 50% lived in Kansas.
91% of the 66013 zip code residents lived in the same house 1 year ago. Out of people who lived in different houses, 70% moved from this county. Out of people who lived in different houses, 16% moved from different county within same state. Out of people who lived in different houses, 12% moved from different state. Out of people who lived in different houses, 1% moved from abroad.
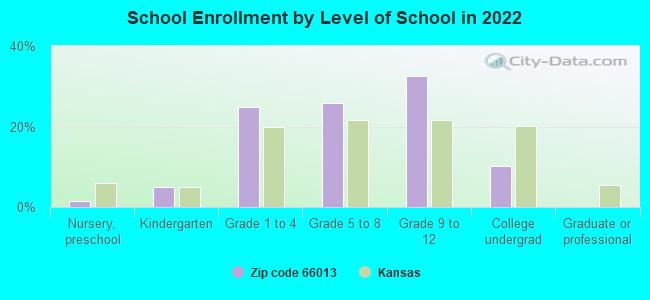
Private vs. public school enrollment:
Students in private schools in grades 1 to 8 (elementary and middle school): 177
Here:
41.8%
Kansas:
14.1%
Students in private schools in grades 9 to 12 (high school):
Here:
0.0%
Kansas:
10.8%
Students in private undergraduate colleges: 10
Here:
13.5%
Kansas:
15.4%
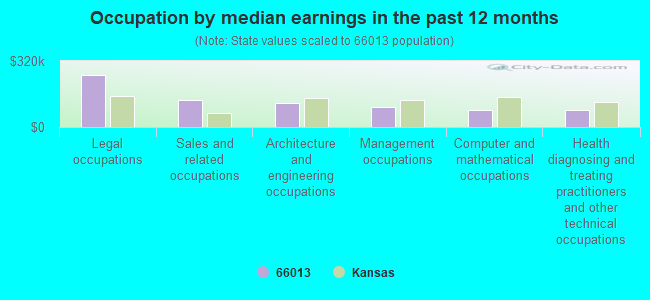
Occupation by median earnings in the past 12 months ($)
251,386Legal occupations
128,569Sales and related occupations
114,994Architecture and engineering occupations
98,356Management occupations
82,762Computer and mathematical occupations
80,111Health diagnosing and treating practitioners and other technical occupations
Companies with federal contracts located in this zip code (BUCYRUS, KS):
WILLIAMS BUILDING CORPORATION (6925C W 206TH STREET; small business) : $8,635,011 in 78 contractsfrom 2000 to 2005
Contracts for Maintenance, Repair or Alteration of Real Property -- Family Housing Facilities, Construction of Structures and Facilities -- Family Housing Facilities, Demolition of Structures or Facilities (Other than Buildings), Maintenance, Repair or Alteration of Real Property -- Other Non-Building Facilities, and moreby Air Force, Army Signed by year:2000: $5,175,645; 2001: $2,407,952; 2002: $282,420; 2003: $776,398; 2004: $0; 2005: -$7,404; 2006: $0.
Biggest contracts:
$4,551,522 with Air Force for Maintenance, Repair or Alteration of Real Property -- Family Housing Facilities. Taking place in SC. Signed on 2000-09-30. Completion date: 2002-02-21.
$408,476 with Army for Construction of Structures and Facilities -- Family Housing Facilities. Taking place in GA. Signed on 2001-09-26. Completion date: 2002-09-30.
$209,604, same as above.Signed on 2002-09-30. Completion date: 2002-09-30.
$169,467 with Air Force for Maintenance, Repair or Alteration of Real Property -- Family Housing Facilities. Taking place in SC. Signed on 2000-09-30. Completion date: 2001-03-21.
MILL LAWN (13420 207TH ST; small business) : $471,691 in 64 contractsfrom 2002 to 2006
Contracts for Landscaping/Groundskeeping Services by U.S. Army Corps of Engineers - civil program financing only, Army Signed by year:2000: $0; 2001: $0; 2002: $131,580; 2003: $55,481; 2004: $155,274; 2005: $116,424; 2006: $12,932.
Biggest contracts:
$72,727 with U.S. Army Corps of Engineers - civil program financing only for Landscaping/Groundskeeping Services. Signed on 2002-10-04. Completion date: 2002-09-30.
$14,141, same as above.Signed on 2004-05-25. Completion date: 2004-05-18.
$14,141 with Army for Landscaping/Groundskeeping Services. Signed on 2004-05-25. Completion date: 2004-05-18.
$8,397 with U.S. Army Corps of Engineers - civil program financing only for Landscaping/Groundskeeping Services. Signed on 2004-09-17. Completion date: 2004-09-21.
LANKFORD ENTERPRISES, INC (20635 S METCALF; small business)
$29,150 with Air Force for Maintenance, Repair or Alteration of Real Property -- Recreational Buildings. Signed on 2002-09-18. Completion date: 2002-10-18.
INTEGRATED CONTROL SYSTEMS, IN (6909 W 202 TERRACE; small business)
$26,500 with Army for Scales and Balances. Signed on 2001-09-26. Completion date: 2002-01-18.
Top industries in this zip code by the number of employees in 2005:
Construction: Water and Sewer Line and Related Structures Construction (100-249 employees: 1 establishment, 5-9 employees: 2 establishments)
Construction: Poured Concrete Foundation and Structure Contractors (20-49: 2, 5-9: 2)
Administrative and Support and Waste Management and Remediation Services: Landscaping Services (20-49: 1, 10-19: 1, 1-4: 4)
Construction: Site Preparation Contractors (10-19: 2, 5-9: 1, 1-4: 3)
Other Services (except Public Administration): Religious Organizations (20-49: 1, 5-9: 1, 1-4: 1)
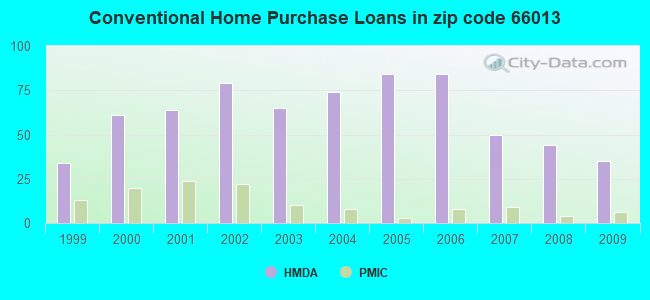
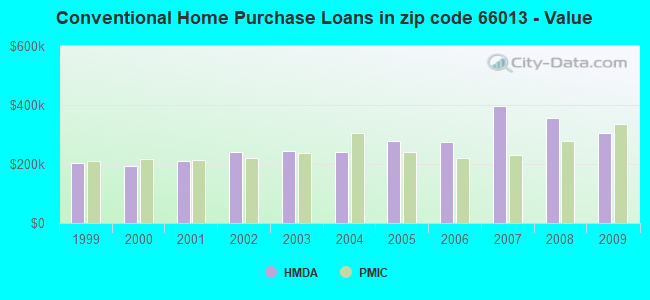
Detailed PMIC statistics for the following Tracts:0538.02
2002 - 2018 National Fire Incident Reporting System (NFIRS) incidents
According to the data from the years 2002 - 2018 the average number of fires per year is 13. The highest number of fires - 26 took place in 2012, and the least - 4 in 2003. The data has a growing trend.
When looking into fire subcategories, the most incidents belonged to: Outside Fires (62.6%), and Structure Fires (22.4%).
Fire incident types reported to NFIRS in Zip Code 66013

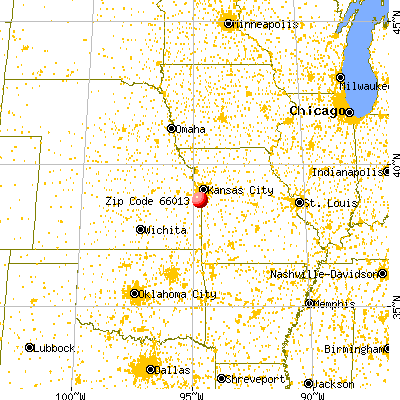


 Nearest zip codes: 66085, 66221, 66062, 66223, 66083, 66224.
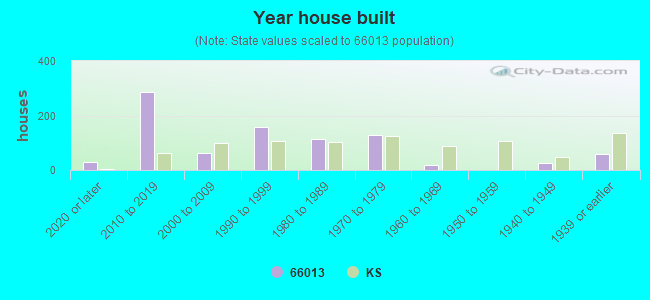


 According to the data from the years 2002 - 2018 the average number of fires per year is 13. The highest number of fires - 26 took place in 2012, and the least - 4 in 2003. The data has a growing trend.
 When looking into fire subcategories, the most incidents belonged to: Outside Fires (62.6%), and Structure Fires (22.4%).