Estimated zip code population in 2022: 341 Zip code population in 2010: 353 Zip code population in 2000: 409
March 2022 cost of living index in zip code 64167: 75.2 (low, U.S. average is 100)
Land area: 1.4 sq. mi. Water area: 0.0 sq. mi.
Population density: 249 people per square mile
(very low).
OSM Map
General Map
Google Map
MSN Map
OSM Map
General Map
Google Map
MSN Map
OSM Map
General Map
Google Map
MSN Map
OSM Map
General Map
Google Map
MSN Map
Please wait while loading the map...
Real estate property taxes paid for housing units in 2022:
This zip code:
1.0% ($5,986)
Missouri:
0.8% ($1,810)
Median real estate property taxes paid for housing units with mortgages in 2022: $6,276 (2.4%) Median real estate property taxes paid for housing units with no mortgage in 2022: $5,165 (2.8%)
Business Search- 14 Million verified businesses
Males: 148
(43.5%)
Females: 193
(56.5%)
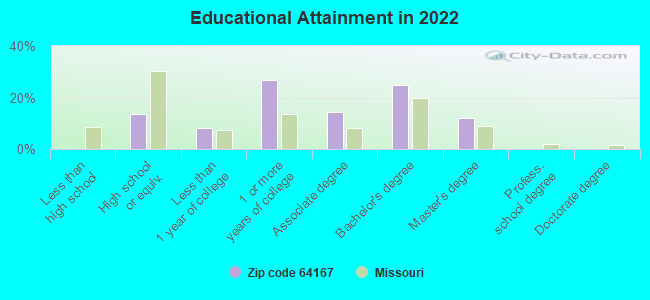
For population 25 years and over in 64167:
High school or higher: 100.0%
Bachelor's degree or higher: 37.1%
Graduate or professional degree: 12.2%
Mean travel time to work (commute): 37.4 minutes
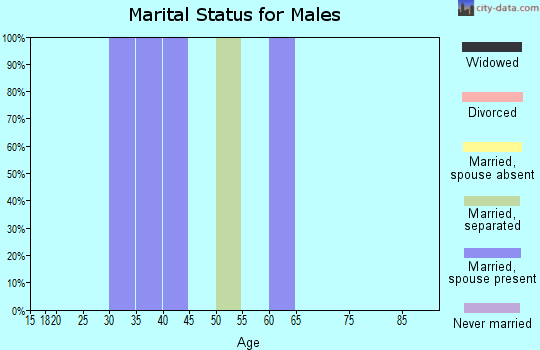
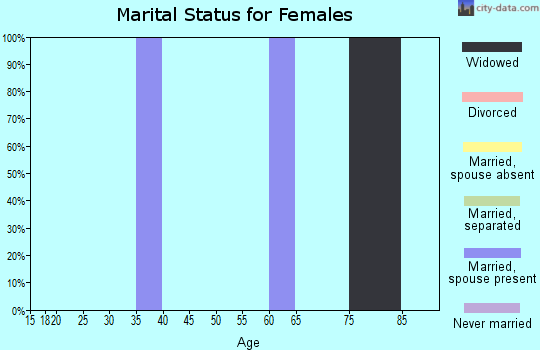
For population 15 years and over in 64167:
Never married: 19.8%
Now married: 67.4%
Separated: 0.0%
Widowed: 5.8%
Divorced: 6.9%
Zip code 64167 compared to state average:
Median household income significantly above state average.
Median house value significantly above state average.
Unemployed percentage significantly below state average.
Black race population percentage significantly below state average.
Hispanic race population percentage significantly below state average.
Median age significantly above state average.
Renting percentage significantly below state average.
Length of stay since moving in significantly above state average.
Number of rooms per house significantly above state average.
Number of college students significantly below state average.
Estimated median house/condo value in 2022: $606,026
64167:
$606,026
Missouri:
$221,200
Median resident age:
This zip code:
56.6 years
Missouri median age:
39.1 years
Average household size:
This zip code:
2.6 people
Missouri:
2.4 people
Averages for the 2020 tax year for zip code 64167, filed in 2021:
Average Adjusted Gross Income (AGI) in 2020: $120,928 (Individual Income Tax Returns)
Here:
$120,928
State:
$68,151
Salary/wage: $105,060 (reported on 83.3% of returns)
Here:
$105,060
State:
$56,131
(% of AGI for various income ranges: 2400.0% for AGIs below $25k, 6350.0% for AGIs $50k-75k, 13712.5% for AGIs $100k-200k)
Taxable interest for individuals: $900 (reported on 55.6% of returns)
This zip code:
$900
Missouri:
$1,586
(% of AGI for various income ranges: 73.3% for AGIs $50k-75k, 102.5% for AGIs $100k-200k)
Ordinary dividends: $1,580 (reported on 27.8% of returns)
Here:
$1,580
State:
$10,947
(% of AGI for various income ranges: 55.0% for AGIs below $25k, 142.5% for AGIs $100k-200k)
Net capital gain/loss in AGI: +$18,800 (reported on 22.2% of returns)
Here:
+$18,800
State:
+$18,453
(% of AGI for various income ranges: 1880.0% for AGIs $100k-200k)
Profit/loss from business: +$6,233 (reported on 16.7% of returns)
Here:
+$6,233
State:
+$12,260
(% of AGI for various income ranges: 467.5% for AGIs below $25k)
Total itemized deductions: $41,700 (reported on 11.1% of returns)
Here:
$41,700
State:
$36,651
(% of AGI for various income ranges: 2085.0% for AGIs $100k-200k)
Taxes paid: $11,000 (reported on 11.1% of returns)
64167:
$11,000
State:
$7,608
(% of AGI for various income ranges: 550.0% for AGIs $100k-200k)
Percentage of individuals using paid preparers for their 2020 taxes: 94.4%
Here:
94%
State:
93%
(% for various income ranges: 83.3% for AGIs below $25k, 100.0% for AGIs $50k-75k, 100.0% for AGIs $100k-200k, 100.0% for AGIs over 200k)
Averages for the 2012 tax year for zip code 64167, filed in 2013:
Average Adjusted Gross Income (AGI) in 2012: $93,140 (Individual Income Tax Returns)
Here:
$93,140
State:
$55,896
Salary/wage: $74,571 (reported on 93.3% of returns)
Here:
$74,571
State:
$46,205
(% of AGI for various income ranges: 92.6% for AGIs below $25k, 170.5% for AGIs $25k-50k, 76.4% for AGIs $100k-200k)
Taxable interest for individuals: $457 (reported on 46.7% of returns)
This zip code:
$457
Missouri:
$1,559
Ordinary dividends: $667 (reported on 20.0% of returns)
Here:
$667
State:
$7,410
Total itemized deductions: $25,244 (19% of AGI, reported on 60.0% of returns)
Here:
$25,244
State:
$22,730
Here:
18.9% of AGI
State:
19.2% of AGI
(% of AGI for various income ranges: 40.6% for AGIs $25k-50k, 16.8% for AGIs $100k-200k)
Charity contributions: $3,386 (reported on 46.7% of returns)
Here:
$3,386
State:
$4,745
(% of AGI for various income ranges: 2.9% for AGIs $25k-50k, 1.9% for AGIs $100k-200k)
Taxes paid: $11,422 (reported on 60.0% of returns)
64167:
$11,422
State:
$8,399
Percentage of individuals using paid preparers for their 2012 taxes: 60.0%
Here:
60%
State:
55%
Averages for the 2004 tax year for zip code 64167, filed in 2005:
Average Adjusted Gross Income (AGI) in 2004: $77,681 (Individual Income Tax Returns)
Here:
$77,681
State:
$44,591
Salary/wage: $73,767 (reported on 85.9% of returns)
Here:
$73,767
State:
$38,941
(% of AGI for various income ranges: 84.3% for AGIs below $10k, 77.7% for AGIs $25k-50k, 71.4% for AGIs $50k-75k, 77.8% for AGIs $75k-100k, 85.9% for AGIs over 100k)
Taxable interest for individuals: $594 (reported on 71.1% of returns)
This zip code:
$594
Missouri:
$1,801
(% of AGI for various income ranges: 3.5% for AGIs below $10k, 1.2% for AGIs $50k-75k, 0.3% for AGIs $75k-100k, 0.4% for AGIs over 100k)
Taxable dividends: $926 (reported on 40.0% of returns)
Here:
$926
State:
$3,677
(% of AGI for various income ranges: 1.1% for AGIs $75k-100k, 0.4% for AGIs over 100k)
Profit/loss from business: +$3,038 (reported on 19.3% of returns)
Here:
+$3,038
State:
+$9,793
Total itemized deductions: $22,471 (21% of AGI, reported on 64.4% of returns)
Here:
$22,471
State:
$18,261
Here:
20.8% of AGI
State:
20.5% of AGI
(% of AGI for various income ranges: 27.0% for AGIs $50k-75k, 23.2% for AGIs $75k-100k, 17.3% for AGIs over 100k)
Charity contributions deductions: $3,200 (3% of AGI, reported on 59.3% of returns)
Here:
$3,200
State:
$3,665
Here:
3.0% of AGI
State:
3.9% of AGI
(% of AGI for various income ranges: 1.7% for AGIs $50k-75k, 4.5% for AGIs $75k-100k, 2.1% for AGIs over 100k)
Total tax: $11,816 (reported on 84.4% of returns)
64167:
$11,816
State:
$6,999
(% of AGI for various income ranges: 3.0% for AGIs below $10k, 7.8% for AGIs $25k-50k, 9.5% for AGIs $50k-75k, 9.3% for AGIs $75k-100k, 15.9% for AGIs over 100k)
Percentage of individuals using paid preparers for their 2004 taxes: 65.9%
Here:
66%
State:
62%
(% for various income ranges: 50.0% for AGIs below $10k, 75.0% for AGIs $25k-50k, 75.0% for AGIs $50k-75k, 73.1% for AGIs $75k-100k, 64.1% for AGIs over 100k)
Household received Food Stamps/SNAP in the past 12 months: 0 Household did not receive Food Stamps/SNAP in the past 12 months: 133
Women who did not have a birth in the past 12 months: 72 (40 now married, 31 unmarried)
Housing units in zip code 64167 with a mortgage: 95 Median monthly owner costs for units with a mortgage: $1,614 Median monthly owner costs for units without a mortgage: $1,009
Residents with income below the poverty level in 2022:
This zip code:
4.0%
Whole state:
13.2%
Residents with income below 50% of the poverty level in 2022:
This zip code:
4.0%
Whole state:
6.8%
Median number of rooms in houses and condos:
Here:
9.8
State:
6.4
Notable locations in this zip code not listed on our city pages
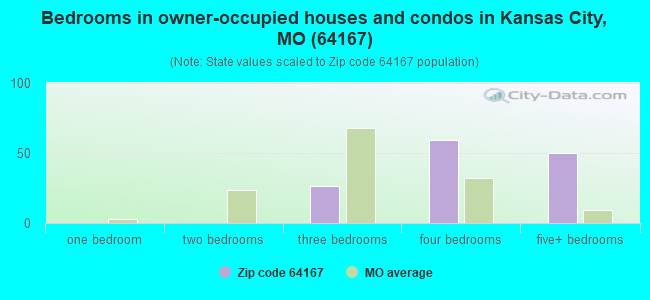
Size of family households: 46 2-persons, 57 3-persons, 10 5-persons
Size of nonfamily households: 19 1-person
35 married couples with children.
0 single-parent households ().
99.4% of residents of 64167 zip code speak English at home.
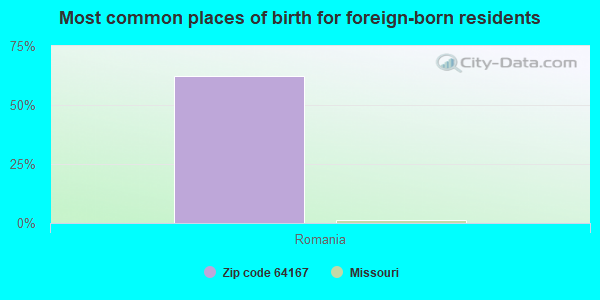
Foreign born population: 16 (4.9%) (100.0% of them are naturalized citizens)
This zip code:
4.9%
Whole state:
4.1%
62%Romania
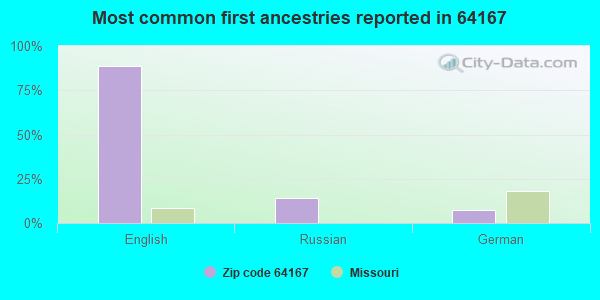
89%English
14%Russian
8%German
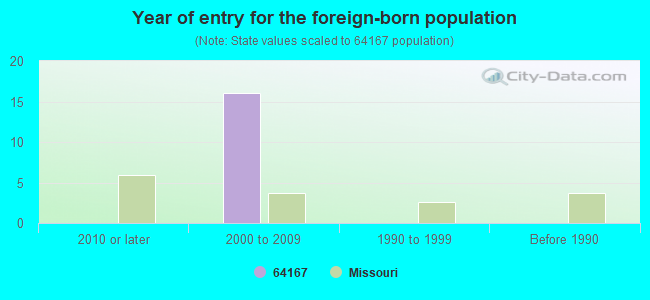
Year of entry for the foreign-born population
02010 or later
162000 to 2009
01990 to 1999
0Before 1990
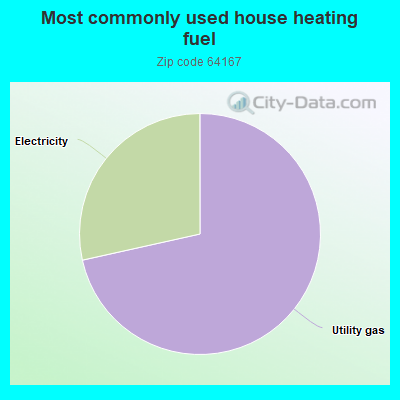
72.3%Utility gas
28.8%Electricity
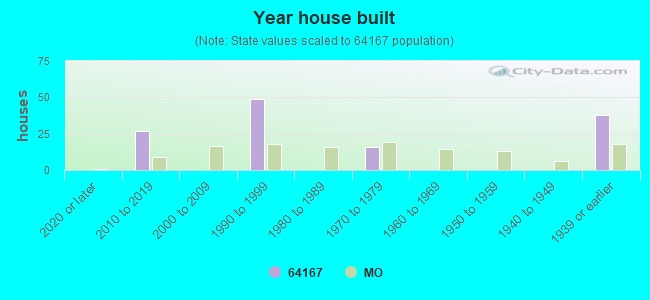
Population in 1990: 244. Population change in the 1990s: +165 (+67.6%).
Place of birth for U.S.-born residents:
This state: 245
Midwest: 67
South: 10
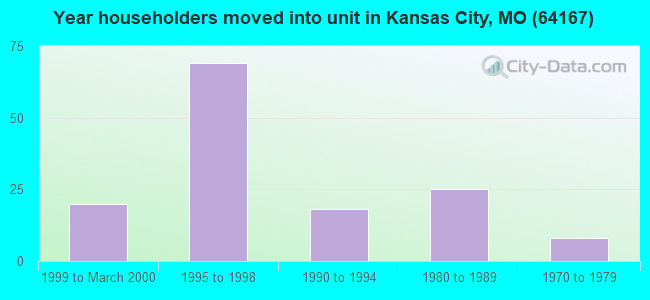
28% of the 64167 zip code residents lived in the same house 5 years ago. Out of people who lived in different houses, 48% lived in this county. Out of people who lived in different counties, 50% lived in Missouri.
96% of the 64167 zip code residents lived in the same house 1 year ago. Out of people who lived in different houses, 117% moved from different county within same state.
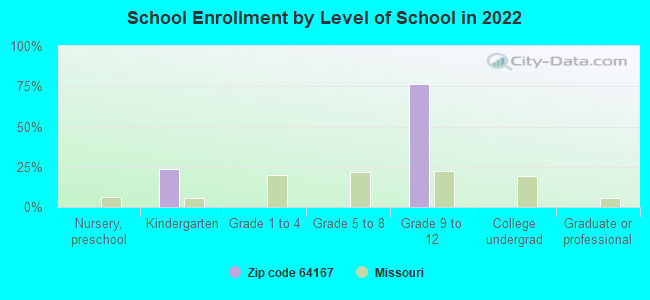
Students in private schools in grades 9 to 12 (high school):
Here:
0.0%
Missouri:
13.9%
Top industries in this zip code by the number of employees in 2005:
Construction: New Single-Family Housing Construction (except Operative Builders) (5-9 employees: 1 establishment, 1-4 employees: 2 establishments)
Construction: Painting and Wall Covering Contractors (5-9: 1)
Other Services (except Public Administration): Religious Organizations (5-9: 1)
Home Mortgage Disclosure Act Aggregated Statistics For Year 2009 (Based on 2 partial tracts)
A) FHA, FSA/RHS & VA Home Purchase Loans
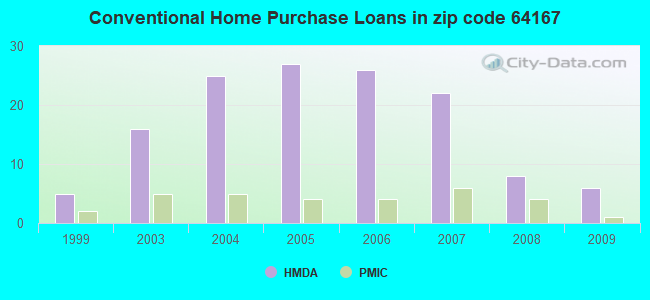
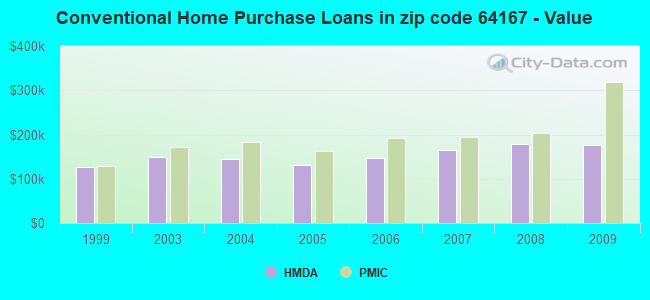
B) Conventional Home Purchase Loans
C) Refinancings
D) Home Improvement Loans
F) Non-occupant Loans on < 5 Family Dwellings (A B C & D)
Number
Average Value
Number
Average Value
Number
Average Value
Number
Average Value
Number
Average Value
LOANS ORIGINATED
8
$161,614
6
$176,392
31
$179,898
1
$81,220
1
$126,290
APPLICATIONS APPROVED, NOT ACCEPTED
0
$0
0
$0
3
$175,777
0
$0
0
$0
APPLICATIONS DENIED
0
$0
0
$0
8
$193,635
0
$0
0
$0
APPLICATIONS WITHDRAWN
1
$114,140
1
$137,300
7
$185,284
0
$0
0
$0
FILES CLOSED FOR INCOMPLETENESS
0
$0
0
$0
1
$261,950
0
$0
0
$0
Aggregated Statistics For Year 2008 (Based on 2 partial tracts)
A) FHA, FSA/RHS & VA Home Purchase Loans
B) Conventional Home Purchase Loans
C) Refinancings
D) Home Improvement Loans
F) Non-occupant Loans on < 5 Family Dwellings (A B C & D)
Number
Average Value
Number
Average Value
Number
Average Value
Number
Average Value
Number
Average Value
LOANS ORIGINATED
5
$161,104
8
$179,224
15
$186,767
1
$79,080
1
$183,160
APPLICATIONS APPROVED, NOT ACCEPTED
0
$0
1
$163,940
2
$184,685
0
$0
0
$0
APPLICATIONS DENIED
0
$0
0
$0
7
$192,043
1
$75,050
0
$0
APPLICATIONS WITHDRAWN
0
$0
1
$183,760
4
$158,102
0
$0
0
$0
FILES CLOSED FOR INCOMPLETENESS
0
$0
0
$0
1
$114,940
0
$0
0
$0
Aggregated Statistics For Year 2007 (Based on 2 partial tracts)
A) FHA, FSA/RHS & VA Home Purchase Loans
B) Conventional Home Purchase Loans
C) Refinancings
D) Home Improvement Loans
F) Non-occupant Loans on < 5 Family Dwellings (A B C & D)
Number
Average Value
Number
Average Value
Number
Average Value
Number
Average Value
Number
Average Value
LOANS ORIGINATED
2
$145,215
22
$163,869
15
$176,525
2
$54,230
2
$140,810
APPLICATIONS APPROVED, NOT ACCEPTED
0
$0
3
$148,737
4
$152,762
0
$0
0
$0
APPLICATIONS DENIED
0
$0
2
$227,140
8
$180,792
2
$46,760
1
$90,340
APPLICATIONS WITHDRAWN
0
$0
2
$135,130
5
$161,342
0
$0
0
$0
FILES CLOSED FOR INCOMPLETENESS
0
$0
1
$117,680
1
$248,750
0
$0
0
$0
Aggregated Statistics For Year 2006 (Based on 2 partial tracts)
A) FHA, FSA/RHS & VA Home Purchase Loans
B) Conventional Home Purchase Loans
C) Refinancings
D) Home Improvement Loans
F) Non-occupant Loans on < 5 Family Dwellings (A B C & D)
Number
Average Value
Number
Average Value
Number
Average Value
Number
Average Value
Number
Average Value
LOANS ORIGINATED
2
$136,600
26
$145,810
16
$149,272
3
$63,280
2
$146,860
APPLICATIONS APPROVED, NOT ACCEPTED
0
$0
3
$140,783
4
$164,750
1
$32,470
0
$0
APPLICATIONS DENIED
0
$0
4
$120,828
10
$152,039
1
$75,850
0
$0
APPLICATIONS WITHDRAWN
0
$0
3
$128,633
7
$169,363
1
$50,750
1
$55,030
FILES CLOSED FOR INCOMPLETENESS
0
$0
1
$69,470
2
$106,250
0
$0
0
$0
Aggregated Statistics For Year 2005 (Based on 2 partial tracts)
A) FHA, FSA/RHS & VA Home Purchase Loans
B) Conventional Home Purchase Loans
C) Refinancings
D) Home Improvement Loans
F) Non-occupant Loans on < 5 Family Dwellings (A B C & D)
Number
Average Value
Number
Average Value
Number
Average Value
Number
Average Value
Number
Average Value
LOANS ORIGINATED
2
$187,645
27
$131,902
20
$154,975
2
$69,120
3
$108,863
APPLICATIONS APPROVED, NOT ACCEPTED
0
$0
4
$116,345
3
$153,483
0
$0
0
$0
APPLICATIONS DENIED
0
$0
3
$126,277
8
$157,050
2
$28,710
0
$0
APPLICATIONS WITHDRAWN
0
$0
2
$162,645
8
$147,359
1
$72,960
1
$75,800
FILES CLOSED FOR INCOMPLETENESS
0
$0
1
$121,410
1
$241,330
0
$0
0
$0
Aggregated Statistics For Year 2004 (Based on 2 partial tracts)
A) FHA, FSA/RHS & VA Home Purchase Loans
B) Conventional Home Purchase Loans
C) Refinancings
D) Home Improvement Loans
F) Non-occupant Loans on < 5 Family Dwellings (A B C & D)
Number
Average Value
Number
Average Value
Number
Average Value
Number
Average Value
Number
Average Value
LOANS ORIGINATED
3
$138,693
25
$144,000
23
$158,819
1
$58,760
1
$98,400
APPLICATIONS APPROVED, NOT ACCEPTED
0
$0
2
$183,615
2
$185,705
0
$0
0
$0
APPLICATIONS DENIED
0
$0
2
$182,020
7
$147,500
1
$85,950
0
$0
APPLICATIONS WITHDRAWN
0
$0
3
$124,817
6
$149,558
0
$0
0
$0
FILES CLOSED FOR INCOMPLETENESS
0
$0
1
$149,100
2
$150,795
0
$0
0
$0
Aggregated Statistics For Year 2003 (Based on 2 partial tracts)
A) FHA, FSA/RHS & VA Home Purchase Loans
B) Conventional Home Purchase Loans
C) Refinancings
D) Home Improvement Loans
F) Non-occupant Loans on < 5 Family Dwellings (A B C & D)
Number
Average Value
Number
Average Value
Number
Average Value
Number
Average Value
Number
Average Value
LOANS ORIGINATED
3
$131,140
16
$148,482
50
$147,747
1
$27,890
1
$157,570
APPLICATIONS APPROVED, NOT ACCEPTED
0
$0
1
$163,990
5
$142,736
0
$0
0
$0
APPLICATIONS DENIED
0
$0
1
$211,900
8
$162,498
1
$16,140
0
$0
APPLICATIONS WITHDRAWN
0
$0
2
$165,135
7
$169,007
0
$0
0
$0
FILES CLOSED FOR INCOMPLETENESS
0
$0
1
$123,550
2
$116,705
0
$0
0
$0
Aggregated Statistics For Year 1999 (Based on 1 partial tract)
A) FHA, FSA/RHS & VA Home Purchase Loans
B) Conventional Home Purchase Loans
C) Refinancings
D) Home Improvement Loans
F) Non-occupant Loans on < 5 Family Dwellings (A B C & D)


 Nearest zip codes: 64166, 64157, 64156, 64158, 64165, 64089.