Estimated zip code population in 2022: 2,773 Zip code population in 2010: 2,809 Zip code population in 2000: 2,721
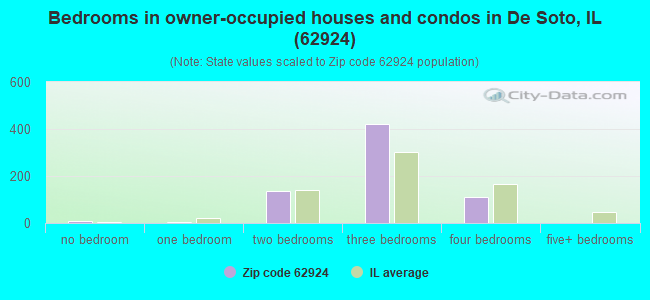
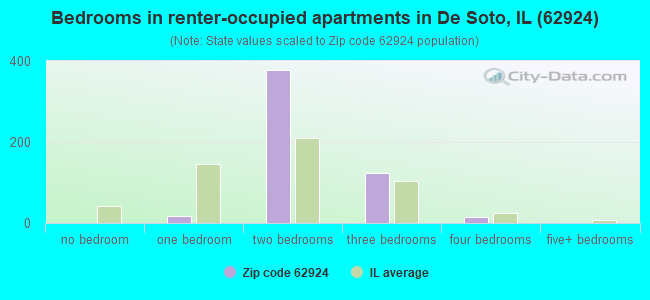
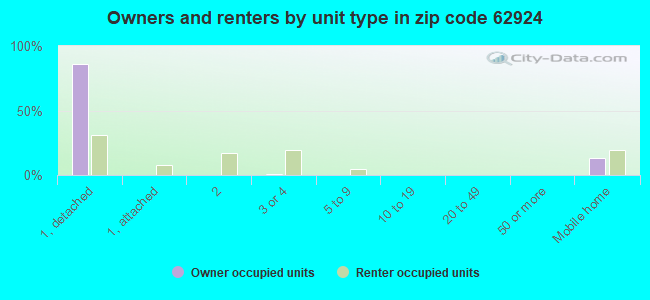
Houses and condos: 1,336 Renter-occupied apartments: 537
% of renters here:
44%
State:
33%
March 2022 cost of living index in zip code 62924: 84.4 (less than average, U.S. average is 100)
Land area: 42.4 sq. mi. Water area: 1.3 sq. mi.
Population density: 65 people per square mile
(very low).
OSM Map
General Map
Google Map
MSN Map
OSM Map
General Map
Google Map
MSN Map
OSM Map
General Map
Google Map
MSN Map
OSM Map
General Map
Google Map
MSN Map
Please wait while loading the map...
Real estate property taxes paid for housing units in 2022:
This zip code:
1.9% ($1,877)
Illinois:
2.0% ($4,912)
Median real estate property taxes paid for housing units with mortgages in 2022: $2,398 (2.3%) Median real estate property taxes paid for housing units with no mortgage in 2022: $1,676 (1.7%)
Business Search- 14 Million verified businesses
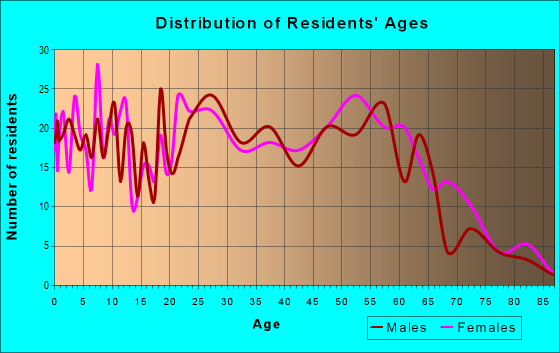
Males: 1,256
(45.3%)
Females: 1,517
(54.7%)
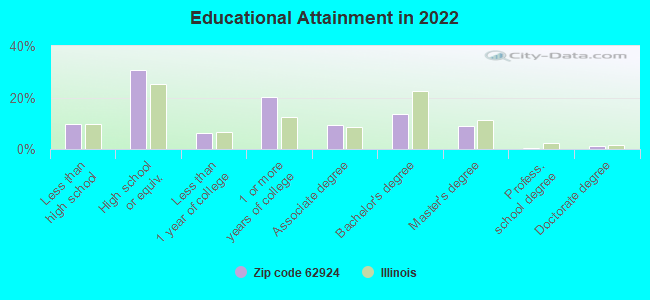
For population 25 years and over in 62924:
High school or higher: 88.8%
Bachelor's degree or higher: 23.6%
Graduate or professional degree: 10.3%
Unemployed: 4.8%
Mean travel time to work (commute): 20.1 minutes
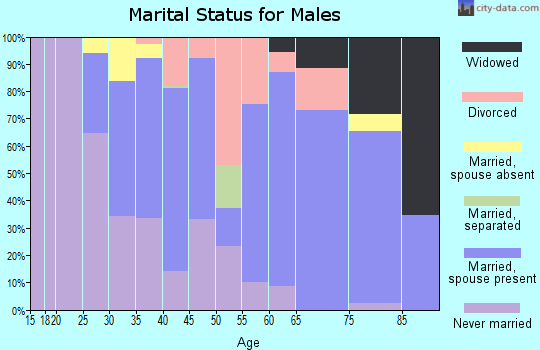
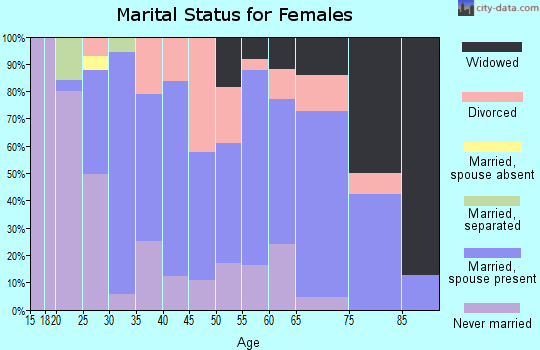
For population 15 years and over in 62924:
Never married: 29.0%
Now married: 44.8%
Separated: 3.2%
Widowed: 5.3%
Divorced: 17.8%
Zip code 62924 compared to state average:
Median house value significantly below state average.
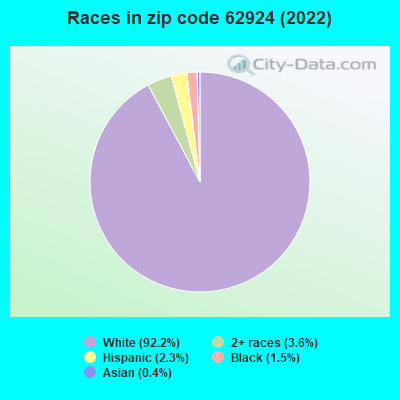
Black race population percentage significantly below state average.
Hispanic race population percentage significantly below state average.
Foreign-born population percentage significantly below state average.
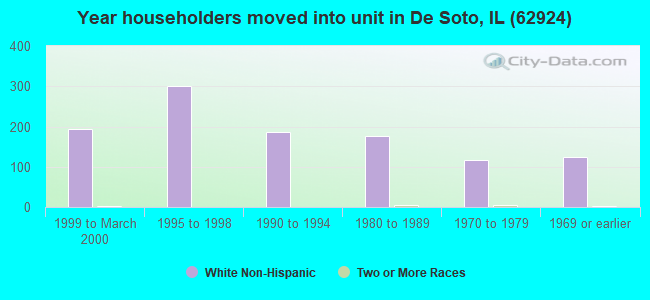
Length of stay since moving in significantly above state average.
Percentage of population with a bachelor's degree or higher below state average.
Averages for the 2020 tax year for zip code 62924, filed in 2021:
Average Adjusted Gross Income (AGI) in 2020: $49,141 (Individual Income Tax Returns)
Here:
$49,141
State:
$82,626
Salary/wage: $40,430 (reported on 80.3% of returns)
Here:
$40,430
State:
$66,640
(% of AGI for various income ranges: 1073.6% for AGIs below $25k, 3151.0% for AGIs $25k-50k, 5688.7% for AGIs $50k-75k, 8257.1% for AGIs $75k-100k, 15381.2% for AGIs $100k-200k)
Taxable interest for individuals: $546 (reported on 28.7% of returns)
This zip code:
$546
Illinois:
$2,376
(% of AGI for various income ranges: 9.7% for AGIs below $25k, 5.5% for AGIs $25k-50k, 33.3% for AGIs $50k-75k, 37.1% for AGIs $75k-100k, 80.0% for AGIs $100k-200k)
Ordinary dividends: $3,538 (reported on 13.1% of returns)
Here:
$3,538
State:
$9,061
(% of AGI for various income ranges: 14.4% for AGIs below $25k, 11.7% for AGIs $25k-50k, 59.3% for AGIs $50k-75k, 117.1% for AGIs $75k-100k, 386.2% for AGIs $100k-200k)
Net capital gain/loss in AGI: +$3,821 (reported on 11.5% of returns)
Here:
+$3,821
State:
+$31,684
(% of AGI for various income ranges: 5.6% for AGIs below $25k, 73.3% for AGIs $50k-75k, 515.0% for AGIs $100k-200k)
Profit/loss from business: +$10,594 (reported on 14.8% of returns)
Here:
+$10,594
State:
+$12,175
(% of AGI for various income ranges: 85.8% for AGIs below $25k, 105.9% for AGIs $25k-50k, 143.3% for AGIs $50k-75k, 410.0% for AGIs $75k-100k, 986.3% for AGIs $100k-200k)
Taxable individual retirement arrangement distribution: $12,240 (reported on 8.2% of returns)
62924:
$12,240
Illinois:
$21,613
(% of AGI for various income ranges: 66.4% for AGIs below $25k, 125.3% for AGIs $50k-75k, 1138.6% for AGIs $75k-100k)
Total itemized deductions: $24,533 (reported on 2.5% of returns)
Here:
$24,533
State:
$34,948
(% of AGI for various income ranges: 1051.4% for AGIs $75k-100k)
Charity contributions: $8,650 (reported on 1.6% of returns)
Here:
$8,650
State:
$13,122
(% of AGI for various income ranges: 115.3% for AGIs $50k-75k)
Taxes paid: $5,700 (reported on 2.5% of returns)
62924:
$5,700
State:
$8,563
(% of AGI for various income ranges: 114.0% for AGIs $50k-75k)
Earned income credit: $2,250 (reported on 19.7% of returns)
Here:
$2,250
State:
$2,311
(% of AGI for various income ranges: 102.2% for AGIs below $25k, 59.3% for AGIs $25k-50k)
Percentage of individuals using paid preparers for their 2020 taxes: 93.4%
Here:
93%
State:
93%
(% for various income ranges: 93.2% for AGIs below $25k, 97.1% for AGIs $25k-50k, 90.0% for AGIs $50k-75k, 81.8% for AGIs $75k-100k, 100.0% for AGIs $100k-200k)
Averages for the 2012 tax year for zip code 62924, filed in 2013:
Average Adjusted Gross Income (AGI) in 2012: $41,298 (Individual Income Tax Returns)
Here:
$41,298
State:
$68,058
Salary/wage: $36,336 (reported on 84.7% of returns)
Here:
$36,336
State:
$55,396
(% of AGI for various income ranges: 79.3% for AGIs below $25k, 80.0% for AGIs $25k-50k, 76.4% for AGIs $50k-75k, 73.4% for AGIs $75k-100k, 64.6% for AGIs $100k-200k)
Taxable interest for individuals: $773 (reported on 26.6% of returns)
This zip code:
$773
Illinois:
$1,969
(% of AGI for various income ranges: 0.7% for AGIs below $25k, 0.5% for AGIs $25k-50k, 0.4% for AGIs $50k-75k, 0.6% for AGIs $75k-100k, 0.3% for AGIs $100k-200k)
Ordinary dividends: $1,759 (reported on 13.7% of returns)
Here:
$1,759
State:
$7,786
(% of AGI for various income ranges: 0.3% for AGIs below $25k, 0.4% for AGIs $25k-50k, 0.9% for AGIs $50k-75k, 0.7% for AGIs $75k-100k, 0.6% for AGIs $100k-200k)
Net capital gain/loss in AGI: +$786 (reported on 5.6% of returns)
Here:
+$786
State:
+$22,183
Profit/loss from business: +$9,856 (reported on 14.5% of returns)
Here:
+$9,856
State:
+$12,903
(% of AGI for various income ranges: 6.8% for AGIs below $25k, 3.0% for AGIs $25k-50k, 2.0% for AGIs $50k-75k, 7.9% for AGIs $75k-100k)
Taxable individual retirement arrangement distribution: $10,625 (reported on 6.5% of returns)
62924:
$10,625
Illinois:
$17,929
Total itemized deductions: $15,855 (21% of AGI, reported on 17.7% of returns)
Here:
$15,855
State:
$26,433
Here:
20.6% of AGI
State:
19.2% of AGI
(% of AGI for various income ranges: 4.1% for AGIs below $25k, 5.5% for AGIs $25k-50k, 7.8% for AGIs $50k-75k, 7.1% for AGIs $75k-100k, 8.7% for AGIs $100k-200k)
Charity contributions: $3,487 (reported on 12.1% of returns)
Here:
$3,487
State:
$4,525
(% of AGI for various income ranges: 0.9% for AGIs $25k-50k, 1.3% for AGIs $50k-75k, 1.2% for AGIs $75k-100k, 1.3% for AGIs $100k-200k)
Taxes paid: $5,459 (reported on 17.7% of returns)
62924:
$5,459
State:
$11,968
(% of AGI for various income ranges: 0.5% for AGIs below $25k, 1.5% for AGIs $25k-50k, 2.4% for AGIs $50k-75k, 2.5% for AGIs $75k-100k, 4.2% for AGIs $100k-200k)
Earned income credit: $2,230 (reported on 24.2% of returns)
Here:
$2,230
State:
$2,349
(% of AGI for various income ranges: 8.0% for AGIs below $25k, 1.1% for AGIs $25k-50k)
Percentage of individuals using paid preparers for their 2012 taxes: 50.8%
Here:
51%
State:
57%
(% for various income ranges: 43.4% for AGIs below $25k, 52.9% for AGIs $25k-50k, 50.0% for AGIs $50k-75k, 63.6% for AGIs $75k-100k, 75.0% for AGIs $100k-200k)
Averages for the 2004 tax year for zip code 62924, filed in 2005:
Average Adjusted Gross Income (AGI) in 2004: $31,700 (Individual Income Tax Returns)
Here:
$31,700
State:
$54,625
Salary/wage: $30,293 (reported on 86.4% of returns)
Here:
$30,293
State:
$46,811
(% of AGI for various income ranges: 99.7% for AGIs below $10k, 77.5% for AGIs $10k-25k, 84.5% for AGIs $25k-50k, 86.2% for AGIs $50k-75k, 81.7% for AGIs $75k-100k, 69.0% for AGIs over 100k)
Taxable interest for individuals: $1,102 (reported on 36.1% of returns)
This zip code:
$1,102
Illinois:
$2,101
(% of AGI for various income ranges: 5.9% for AGIs below $10k, 1.7% for AGIs $10k-25k, 1.1% for AGIs $25k-50k, 1.0% for AGIs $50k-75k, 0.9% for AGIs $75k-100k, 0.9% for AGIs over 100k)
Taxable dividends: $961 (reported on 17.7% of returns)
Here:
$961
State:
$4,306
(% of AGI for various income ranges: 1.5% for AGIs below $10k, 0.9% for AGIs $10k-25k, 0.5% for AGIs $25k-50k, 0.2% for AGIs $50k-75k, 0.9% for AGIs $75k-100k, 0.0% for AGIs over 100k)
Net capital gain/loss: +$1,353 (reported on 11.4% of returns)
Here:
+$1,353
State:
+$17,321
(% of AGI for various income ranges: 1.2% for AGIs below $10k, 0.2% for AGIs $10k-25k, -0.0% for AGIs $25k-50k, 0.0% for AGIs $50k-75k, 2.6% for AGIs $75k-100k, 0.1% for AGIs over 100k)
Profit/loss from business: +$3,785 (reported on 15.2% of returns)
Here:
+$3,785
State:
+$11,771
(% of AGI for various income ranges: 5.6% for AGIs below $10k, 3.2% for AGIs $10k-25k, 1.7% for AGIs $25k-50k, 1.7% for AGIs $50k-75k, 1.2% for AGIs $75k-100k)
Profit/loss from farming: +$667 (reported on 1.5% of returns)
Here:
+$667
State:
+$2,327
IRA payment deduction: $2,000 (reported on 1.3% of returns)
62924:
$2,000
Illinois:
$3,087
Total itemized deductions: $14,870 (25% of AGI, reported on 15.8% of returns)
Here:
$14,870
State:
$20,239
Here:
25.2% of AGI
State:
19.5% of AGI
(% of AGI for various income ranges: 4.2% for AGIs $10k-25k, 6.3% for AGIs $25k-50k, 8.4% for AGIs $50k-75k, 10.2% for AGIs $75k-100k, 11.0% for AGIs over 100k)
Charity contributions deductions: $2,613 (4% of AGI, reported on 11.7% of returns)
Here:
$2,613
State:
$3,719
Here:
4.2% of AGI
State:
3.4% of AGI
(% of AGI for various income ranges: 0.7% for AGIs $10k-25k, 0.7% for AGIs $25k-50k, 1.0% for AGIs $50k-75k, 1.3% for AGIs $75k-100k, 2.1% for AGIs over 100k)
Total tax: $3,582 (reported on 71.0% of returns)
62924:
$3,582
State:
$9,882
(% of AGI for various income ranges: 1.8% for AGIs below $10k, 4.0% for AGIs $10k-25k, 6.7% for AGIs $25k-50k, 8.7% for AGIs $50k-75k, 9.9% for AGIs $75k-100k, 15.8% for AGIs over 100k)
Earned income credit: $1,761 (reported on 21.2% of returns)
Here:
$1,761
State:
$1,788
Percentage of individuals using paid preparers for their 2004 taxes: 59.5%
Here:
59%
State:
61%
(% for various income ranges: 54.4% for AGIs below $10k, 62.6% for AGIs $10k-25k, 58.1% for AGIs $25k-50k, 60.5% for AGIs $50k-75k, 63.2% for AGIs $75k-100k, 77.8% for AGIs over 100k)
Household received Food Stamps/SNAP in the past 12 months: 226 Household did not receive Food Stamps/SNAP in the past 12 months: 1,000
Women who had a birth in the past 12 months: 18 (10 now married, 7 unmarried) Women who did not have a birth in the past 12 months: 606 (225 now married, 381 unmarried)
Housing units in zip code 62924 with a mortgage: 289 (32 second mortgage, 13 both second mortgage and home equity loan) Houses without a mortgage: 22
Median monthly owner costs for units with a mortgage: $1,011 Median monthly owner costs for units without a mortgage: $498
Residents with income below the poverty level in 2022:
This zip code:
13.1%
Whole state:
11.9%
Residents with income below 50% of the poverty level in 2022:
This zip code:
4.8%
Whole state:
5.7%
Median number of rooms in houses and condos:
Here:
5.5
State:
6.4
Median number of rooms in apartments:
Here:
4.7
State:
4.1
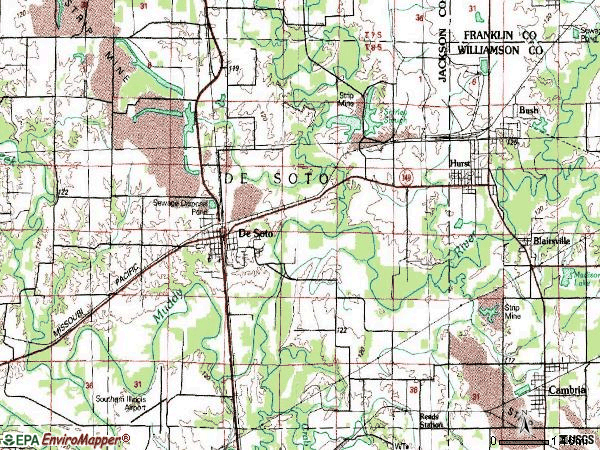
Notable locations in this zip code not listed on our city pages
Notable locations in zip code 62924: Southern Illinois Regional Landfill (A), Bush Volunteer Fire Department (B), Desoto Township Fire Protection District (C). Display/hide their locations on the map
Cemeteries: Beasley Cemetery (1), Indian Hill Cemetery (2), Howard Cemetery (3), De Soto Cemetery (4), Central-Crews Cemetery (5). Display/hide their locations on the map
In group quarters: 77 (-1 institutionalized population)
Size of family households: 432 2-persons, 175 3-persons, 125 4-persons, 41 5-persons, 17 6-persons, 4 7-or-more-persons
Size of nonfamily households: 344 1-person, 81 2-persons
257 married couples with children.
392 single-parent households (130 men, 262 women).
98.2% of residents of 62924 zip code speak English at home.
0.6% of residents speak Spanish at home (60% very well, 40% well).
0.3% of residents speak other Indo-European language at home (11% very well, 89% not well).
0.1% of residents speak Asian or Pacific Island language at home (100% very well).
0.2% of residents speak other language at home (80% very well, 20% well).
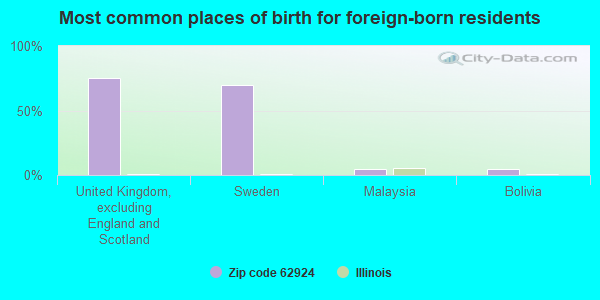
Foreign born population: 20 (0.7%) (25.2% of them are naturalized citizens)
This zip code:
0.7%
Whole state:
14.4%
75%United Kingdom, excluding England and Scotland
70%Sweden
5%Malaysia
5%Bolivia
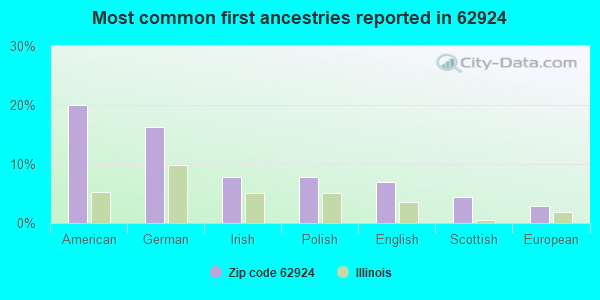
20%American
16%German
8%Irish
8%Polish
7%English
4%Scottish
3%European
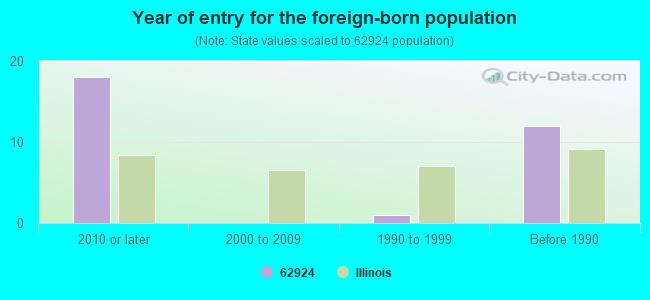
Year of entry for the foreign-born population
182010 or later
02000 to 2009
11990 to 1999
12Before 1990
Facilities with environmental interests located in this zip code:
CONSOLIDATION COAL CO (RR 1 BURNING STAR # 5 in DESOTO, IL)
STATE MASTER (Illinois EPA Project) - AIR PROGRAM STATE MASTER (Illinois EPA Project) - SOLID WASTE PROGRAM, HAZARDOUS WASTE PROGRAM AIR MINOR (AIRS/AFS) National Pollutant Discharge Elimination System NON-MAJOR (Tracking pollutant discharge elimination systems) - permit Business SIC classification: BITUMINOUS COAL AND LIGNITE SURFACE MINING Alternative names: CONSOLIDATION COAL CO BURNING STAR NO 5, CONSOLIDATION COAL-BS5, CONSOLIDATION COAL CO BURNING STAR NO 5
DESOTO ELEMENTARY SCHOOL (311 HURST RD in DESOTO, IL)
(National Center for Education Statistics) - STATE ID-3003908602001 Organizations: DESOTO CONS SCHOOL DISTRICT 86 (SCHOOL DISTRICT)
DESOTO SEWAGE TREATMENT PLANT (ROUTE 1 in DE SOTO, IL)
National Pollutant Discharge Elimination System NON-MAJOR (Tracking pollutant discharge elimination systems) - permit National Pollutant Discharge Elimination System NON-MAJOR (Tracking pollutant discharge elimination systems) - permit Business SIC classification: SEWERAGE SYSTEMS Alternative names: DESOTO STP, DESOTO STP, VILLAGE OF, DESOTO, VILLAGE OF
Housing units lacking complete plumbing facilities: 3.9% Housing units lacking complete kitchen facilities: 1.6%
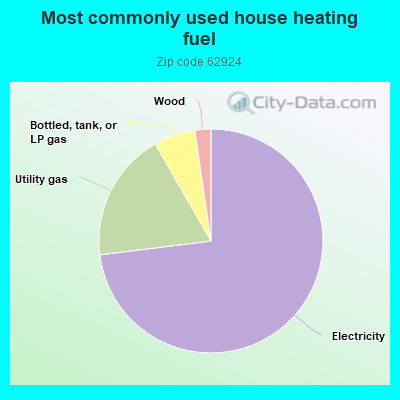
73.1%Electricity
18.7%Utility gas
6.0%Bottled, tank, or LP gas
2.3%Wood
Population in 1990: 2,073. Population change in the 1990s: +648 (+31.3%).
Place of birth for U.S.-born residents:
This state: 2,254
Northeast: 33
Midwest: 224
South: 124
West: 96
59% of the 62924 zip code residents lived in the same house 5 years ago. Out of people who lived in different houses, 53% lived in this county. Out of people who lived in different counties, 50% lived in Illinois.
91% of the 62924 zip code residents lived in the same house 1 year ago. Out of people who lived in different houses, 68% moved from this county. Out of people who lived in different houses, 22% moved from different county within same state. Out of people who lived in different houses, 8% moved from different state.
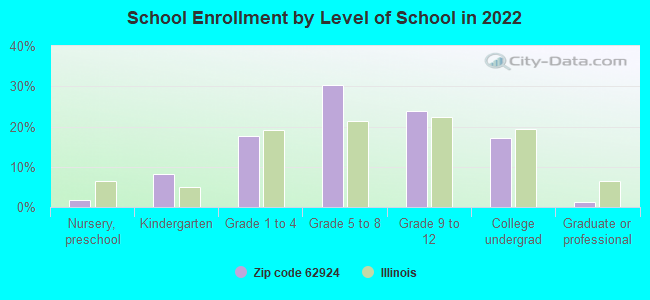
Private vs. public school enrollment:
Students in private schools in grades 1 to 8 (elementary and middle school): 48
Here:
14.9%
Illinois:
13.3%
Students in private schools in grades 9 to 12 (high school): 22
Here:
14.2%
Illinois:
9.9%
Students in private undergraduate colleges: 8
Here:
7.3%
Illinois:
27.4%
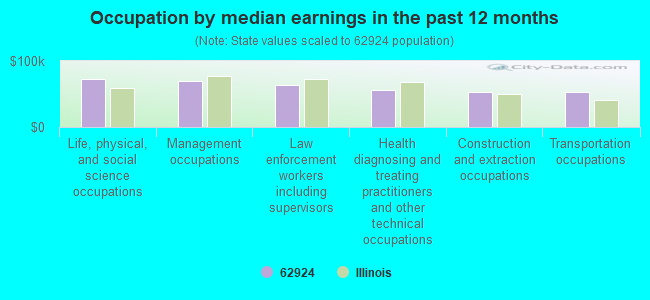
Occupation by median earnings in the past 12 months ($)
72,239Life, physical, and social science occupations
69,525Management occupations
64,222Law enforcement workers including supervisors
56,729Health diagnosing and treating practitioners and other technical occupations
53,240Construction and extraction occupations
52,685Transportation occupations
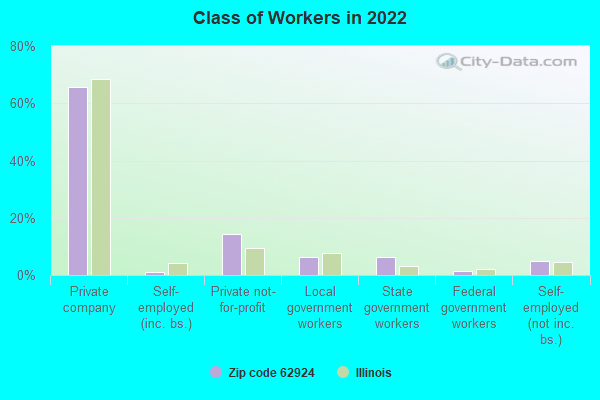
Top industries in this zip code by the number of employees in 2005:
Health Care and Social Assistance: Residential Mental Retardation Facilities (20-49 employees: 1 establishment, 10-19 employees: 3 establishments)
Administrative and Support and Waste Management and Remediation Services: Solid Waste Collection (20-49: 1, 10-19: 1)
Accommodation and Food Services: Full-Service Restaurants (10-19: 1, 5-9: 1)
Administrative and Support and Waste Management and Remediation Services: Solid Waste Landfill (10-19: 1)
Health Care and Social Assistance: Offices of Physicians (except Mental Health Specialists) (5-9: 1)
Finance and Insurance: Commercial Banking (5-9: 1)
Wholesale Trade: Industrial and Personal Service Paper Merchant Wholesalers (5-9: 1)
Other Services (except Public Administration): Religious Organizations (1-4: 2)
People in group quarters in 2010:
61 people in group homes intended for adults
People in group quarters in 2000:
5 people in nursing homes
Fatal accident statistics in 2010:
Fatal accident count: 2
Vehicles involved in fatal accidents: 3
Fatal accidents caused by drunken drivers: 1
Fatalities: 2
Persons involved in fatal accidents: 4
Pedestrians involved in fatal accidents: 1
2002 - 2018 National Fire Incident Reporting System (NFIRS) incidents
Based on the data from the years 2002 - 2018 the average number of fires per year is 10. The highest number of reported fires - 25 took place in 2010, and the least - 1 in 2005. The data has a decreasing trend.
When looking into fire subcategories, the most incidents belonged to: Outside Fires (41.7%), and Structure Fires (35.6%).
Fire incident types reported to NFIRS in Zip Code 62924
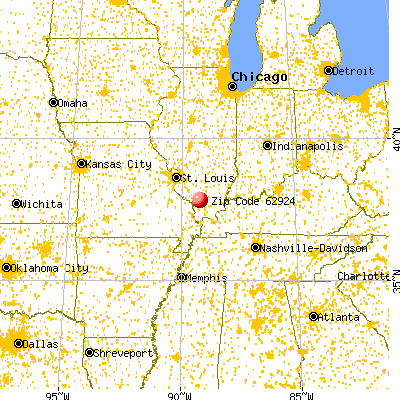


 Nearest zip codes: 62949, 62932, 62901, 62915, 62983, 62918.


 Based on the data from the years 2002 - 2018 the average number of fires per year is 10. The highest number of reported fires - 25 took place in 2010, and the least - 1 in 2005. The data has a decreasing trend.
 When looking into fire subcategories, the most incidents belonged to: Outside Fires (41.7%), and Structure Fires (35.6%).