Estimated zip code population in 2022: 3,296 Zip code population in 2010: 2,981 Zip code population in 2000: 3,235
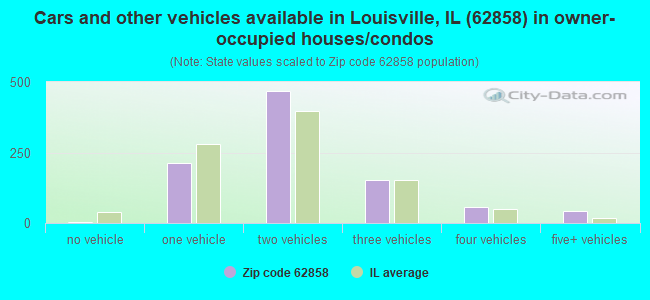
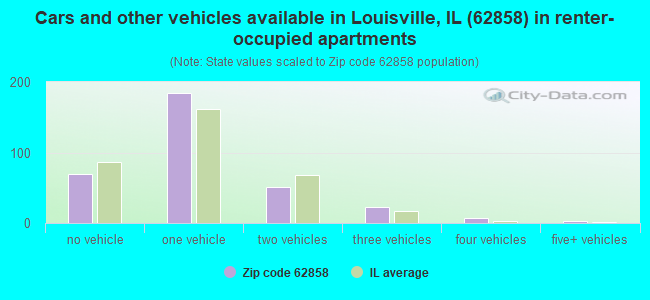
Houses and condos: 1,356 Renter-occupied apartments: 337
% of renters here:
26%
State:
33%
March 2022 cost of living index in zip code 62858: 83.5 (less than average, U.S. average is 100)
Land area: 154.1 sq. mi. Water area: 0.3 sq. mi.
Population density: 21 people per square mile
(very low).
OSM Map
General Map
Google Map
MSN Map
OSM Map
General Map
Google Map
MSN Map
OSM Map
General Map
Google Map
MSN Map
OSM Map
General Map
Google Map
MSN Map
Please wait while loading the map...
Real estate property taxes paid for housing units in 2022:
This zip code:
1.5% ($1,546)
Illinois:
2.0% ($4,912)
Median real estate property taxes paid for housing units with mortgages in 2022: $1,909 (1.8%) Median real estate property taxes paid for housing units with no mortgage in 2022: $808 (0.8%)
Business Search- 14 Million verified businesses
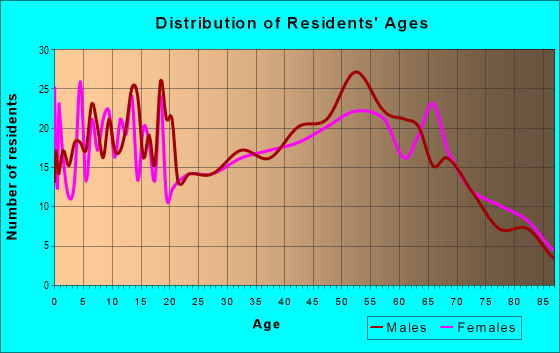
Males: 1,725
(52.3%)
Females: 1,571
(47.7%)
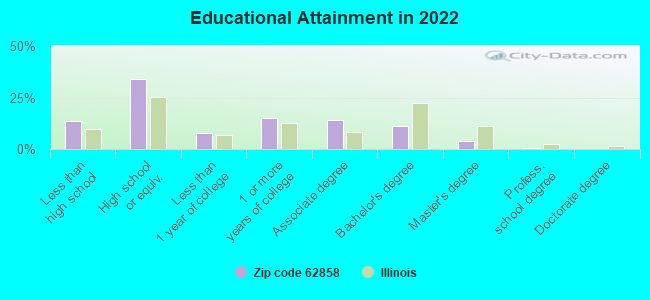
For population 25 years and over in 62858:
High school or higher: 84.4%
Bachelor's degree or higher: 15.3%
Graduate or professional degree: 4.4%
Unemployed: 6.5%
Mean travel time to work (commute): 25.0 minutes
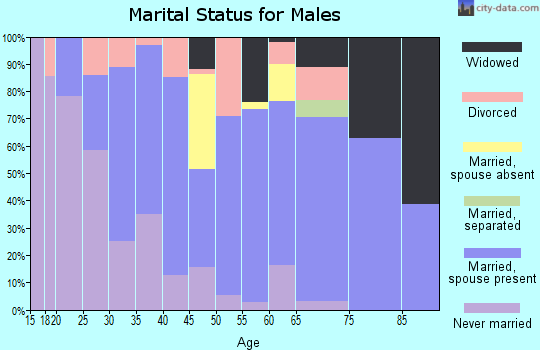
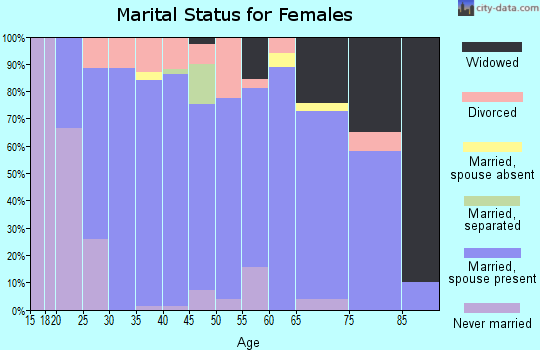
For population 15 years and over in 62858:
Never married: 29.0%
Now married: 48.4%
Separated: 1.4%
Widowed: 5.2%
Divorced: 16.0%
Zip code 62858 compared to state average:
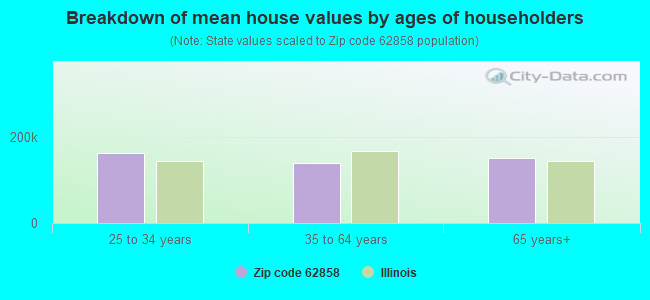
Median house value significantly below state average.
Black race population percentage significantly below state average.
Hispanic race population percentage significantly below state average.
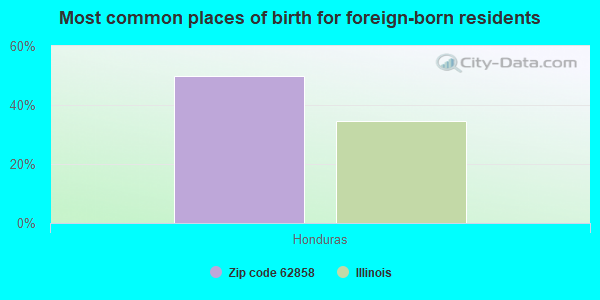
Foreign-born population percentage significantly below state average.
Length of stay since moving in significantly above state average.
Number of college students significantly below state average.
Percentage of population with a bachelor's degree or higher significantly below state average.
Averages for the 2020 tax year for zip code 62858, filed in 2021:
Average Adjusted Gross Income (AGI) in 2020: $54,884 (Individual Income Tax Returns)
Here:
$54,884
State:
$82,626
Salary/wage: $44,301 (reported on 81.5% of returns)
Here:
$44,301
State:
$66,640
(% of AGI for various income ranges: 1291.8% for AGIs below $25k, 3398.8% for AGIs $25k-50k, 6231.2% for AGIs $50k-75k, 8373.0% for AGIs $75k-100k, 13330.0% for AGIs $100k-200k)
Taxable interest for individuals: $900 (reported on 45.2% of returns)
This zip code:
$900
Illinois:
$2,376
(% of AGI for various income ranges: 10.0% for AGIs below $25k, 43.8% for AGIs $25k-50k, 29.4% for AGIs $50k-75k, 37.0% for AGIs $75k-100k, 131.0% for AGIs $100k-200k)
Ordinary dividends: $2,612 (reported on 18.5% of returns)
Here:
$2,612
State:
$9,061
(% of AGI for various income ranges: 12.4% for AGIs below $25k, 35.4% for AGIs $25k-50k, 57.5% for AGIs $50k-75k, 65.0% for AGIs $75k-100k, 362.0% for AGIs $100k-200k)
Net capital gain/loss in AGI: +$6,073 (reported on 16.3% of returns)
Here:
+$6,073
State:
+$31,684
(% of AGI for various income ranges: 11.2% for AGIs below $25k, 53.5% for AGIs $25k-50k, 48.1% for AGIs $50k-75k, 75.0% for AGIs $75k-100k, 1007.0% for AGIs $100k-200k)
Profit/loss from business: +$7,250 (reported on 14.8% of returns)
Here:
+$7,250
State:
+$12,175
(% of AGI for various income ranges: 85.0% for AGIs below $25k, 70.8% for AGIs $25k-50k, 273.8% for AGIs $50k-75k, 200.0% for AGIs $75k-100k, 339.0% for AGIs $100k-200k)
Taxable individual retirement arrangement distribution: $12,215 (reported on 9.6% of returns)
62858:
$12,215
Illinois:
$21,613
(% of AGI for various income ranges: 54.7% for AGIs below $25k, 96.5% for AGIs $25k-50k, 282.5% for AGIs $50k-75k, 699.0% for AGIs $100k-200k)
Total itemized deductions: $33,200 (reported on 3.0% of returns)
Here:
$33,200
State:
$34,948
(% of AGI for various income ranges: 1328.0% for AGIs $100k-200k)
Charity contributions: $12,675 (reported on 3.0% of returns)
Here:
$12,675
State:
$13,122
(% of AGI for various income ranges: 507.0% for AGIs $100k-200k)
Taxes paid: $6,750 (reported on 3.0% of returns)
62858:
$6,750
State:
$8,563
(% of AGI for various income ranges: 270.0% for AGIs $100k-200k)
Earned income credit: $2,290 (reported on 15.6% of returns)
Here:
$2,290
State:
$2,311
(% of AGI for various income ranges: 82.6% for AGIs below $25k, 76.9% for AGIs $25k-50k)
Percentage of individuals using paid preparers for their 2020 taxes: 95.6%
Here:
96%
State:
93%
(% for various income ranges: 95.7% for AGIs below $25k, 96.9% for AGIs $25k-50k, 95.5% for AGIs $50k-75k, 92.9% for AGIs $75k-100k, 94.1% for AGIs $100k-200k, 100.0% for AGIs over 200k)
Averages for the 2012 tax year for zip code 62858, filed in 2013:
Average Adjusted Gross Income (AGI) in 2012: $44,518 (Individual Income Tax Returns)
Here:
$44,518
State:
$68,058
Salary/wage: $37,266 (reported on 81.7% of returns)
Here:
$37,266
State:
$55,396
(% of AGI for various income ranges: 69.7% for AGIs below $25k, 74.2% for AGIs $25k-50k, 73.8% for AGIs $50k-75k, 72.4% for AGIs $75k-100k, 56.9% for AGIs $100k-200k)
Taxable interest for individuals: $1,275 (reported on 45.8% of returns)
This zip code:
$1,275
Illinois:
$1,969
(% of AGI for various income ranges: 2.0% for AGIs below $25k, 1.1% for AGIs $25k-50k, 0.9% for AGIs $50k-75k, 2.4% for AGIs $75k-100k, 0.8% for AGIs $100k-200k)
Ordinary dividends: $1,974 (reported on 14.5% of returns)
Here:
$1,974
State:
$7,786
(% of AGI for various income ranges: 0.2% for AGIs below $25k, 0.5% for AGIs $25k-50k, 1.0% for AGIs $50k-75k, 0.2% for AGIs $75k-100k, 0.9% for AGIs $100k-200k)
Net capital gain/loss in AGI: +$4,044 (reported on 12.2% of returns)
Here:
+$4,044
State:
+$22,183
(% of AGI for various income ranges: 0.9% for AGIs below $25k, 1.0% for AGIs $25k-50k, 0.3% for AGIs $50k-75k, 2.6% for AGIs $100k-200k)
Profit/loss from business: +$7,008 (reported on 18.3% of returns)
Here:
+$7,008
State:
+$12,903
(% of AGI for various income ranges: 7.4% for AGIs below $25k, 2.2% for AGIs $25k-50k, 3.9% for AGIs $50k-75k, 1.5% for AGIs $75k-100k, 1.6% for AGIs $100k-200k)
Taxable individual retirement arrangement distribution: $8,021 (reported on 10.7% of returns)
62858:
$8,021
Illinois:
$17,929
(% of AGI for various income ranges: 1.8% for AGIs below $25k, 2.8% for AGIs $25k-50k, 1.8% for AGIs $50k-75k, 4.5% for AGIs $75k-100k)
Total itemized deductions: $19,450 (22% of AGI, reported on 16.8% of returns)
Here:
$19,450
State:
$26,433
Here:
22.0% of AGI
State:
19.2% of AGI
(% of AGI for various income ranges: 7.8% for AGIs $25k-50k, 6.3% for AGIs $50k-75k, 8.3% for AGIs $75k-100k, 10.1% for AGIs $100k-200k)
Charity contributions: $4,967 (reported on 11.5% of returns)
Here:
$4,967
State:
$4,525
(% of AGI for various income ranges: 1.4% for AGIs $25k-50k, 0.8% for AGIs $50k-75k, 1.4% for AGIs $75k-100k, 2.0% for AGIs $100k-200k)
Taxes paid: $5,927 (reported on 16.8% of returns)
62858:
$5,927
State:
$11,968
(% of AGI for various income ranges: 1.5% for AGIs $25k-50k, 1.6% for AGIs $50k-75k, 2.7% for AGIs $75k-100k, 3.8% for AGIs $100k-200k)
Earned income credit: $2,096 (reported on 18.3% of returns)
Here:
$2,096
State:
$2,349
(% of AGI for various income ranges: 5.4% for AGIs below $25k, 1.2% for AGIs $25k-50k)
Percentage of individuals using paid preparers for their 2012 taxes: 77.1%
Here:
77%
State:
57%
(% for various income ranges: 71.7% for AGIs below $25k, 76.5% for AGIs $25k-50k, 81.8% for AGIs $50k-75k, 81.8% for AGIs $75k-100k, 90.9% for AGIs $100k-200k)
Averages for the 2004 tax year for zip code 62858, filed in 2005:
Average Adjusted Gross Income (AGI) in 2004: $32,948 (Individual Income Tax Returns)
Here:
$32,948
State:
$54,625
Salary/wage: $29,746 (reported on 81.7% of returns)
Here:
$29,746
State:
$46,811
(% of AGI for various income ranges: 133.9% for AGIs below $10k, 71.1% for AGIs $10k-25k, 74.7% for AGIs $25k-50k, 81.9% for AGIs $50k-75k, 75.9% for AGIs $75k-100k, 42.3% for AGIs over 100k)
Taxable interest for individuals: $1,654 (reported on 49.2% of returns)
This zip code:
$1,654
Illinois:
$2,101
(% of AGI for various income ranges: 12.5% for AGIs below $10k, 5.4% for AGIs $10k-25k, 2.3% for AGIs $25k-50k, 1.4% for AGIs $50k-75k, 1.1% for AGIs $75k-100k, 2.0% for AGIs over 100k)
Taxable dividends: $1,037 (reported on 20.9% of returns)
Here:
$1,037
State:
$4,306
(% of AGI for various income ranges: 2.4% for AGIs below $10k, 0.7% for AGIs $10k-25k, 0.9% for AGIs $25k-50k, 0.5% for AGIs $50k-75k, 0.2% for AGIs $75k-100k, 0.5% for AGIs over 100k)
Net capital gain/loss: +$1,365 (reported on 14.7% of returns)
Here:
+$1,365
State:
+$17,321
(% of AGI for various income ranges: 1.0% for AGIs below $10k, 0.9% for AGIs $10k-25k, 0.8% for AGIs $25k-50k, 0.3% for AGIs $50k-75k, 0.0% for AGIs $75k-100k, 1.0% for AGIs over 100k)
Profit/loss from business: +$6,562 (reported on 19.1% of returns)
Here:
+$6,562
State:
+$11,771
(% of AGI for various income ranges: 15.1% for AGIs below $10k, 3.1% for AGIs $10k-25k, 5.0% for AGIs $25k-50k, 3.0% for AGIs $50k-75k, 5.3% for AGIs $75k-100k)
IRA payment deduction: $3,419 (reported on 3.3% of returns)
62858:
$3,419
Illinois:
$3,087
Total itemized deductions: $15,133 (26% of AGI, reported on 13.3% of returns)
Here:
$15,133
State:
$20,239
Here:
25.6% of AGI
State:
19.5% of AGI
(% of AGI for various income ranges: 7.3% for AGIs $10k-25k, 4.1% for AGIs $25k-50k, 7.0% for AGIs $50k-75k, 7.1% for AGIs $75k-100k, 8.1% for AGIs over 100k)
Charity contributions deductions: $3,742 (6% of AGI, reported on 10.1% of returns)
Here:
$3,742
State:
$3,719
Here:
5.8% of AGI
State:
3.4% of AGI
(% of AGI for various income ranges: 0.7% for AGIs $10k-25k, 0.7% for AGIs $25k-50k, 1.3% for AGIs $50k-75k, 1.5% for AGIs $75k-100k, 2.3% for AGIs over 100k)
Total tax: $3,993 (reported on 73.2% of returns)
62858:
$3,993
State:
$9,882
(% of AGI for various income ranges: 4.6% for AGIs below $10k, 3.6% for AGIs $10k-25k, 6.5% for AGIs $25k-50k, 8.5% for AGIs $50k-75k, 11.5% for AGIs $75k-100k, 20.6% for AGIs over 100k)
Earned income credit: $1,530 (reported on 16.6% of returns)
Here:
$1,530
State:
$1,788
Percentage of individuals using paid preparers for their 2004 taxes: 73.9%
Here:
74%
State:
61%
(% for various income ranges: 68.1% for AGIs below $10k, 73.3% for AGIs $10k-25k, 76.5% for AGIs $25k-50k, 77.6% for AGIs $50k-75k, 76.9% for AGIs $75k-100k, 71.9% for AGIs over 100k)
Likely homosexual households (counted as self-reported same-sex unmarried-partner households)
Lesbian couples: 0.0% of all households
Gay men: 0.4% of all households
Household received Food Stamps/SNAP in the past 12 months: 271 Household did not receive Food Stamps/SNAP in the past 12 months: 1,019
Women who had a birth in the past 12 months: 86 (86 now married, 0 unmarried) Women who did not have a birth in the past 12 months: 615 (234 now married, 381 unmarried)
Housing units in zip code 62858 with a mortgage: 438 (15 second mortgage, 16 both second mortgage and home equity loan) Median monthly owner costs for units with a mortgage: $1,093 Median monthly owner costs for units without a mortgage: $483
Residents with income below the poverty level in 2022:
This zip code:
20.6%
Whole state:
11.9%
Residents with income below 50% of the poverty level in 2022:
This zip code:
10.8%
Whole state:
5.7%
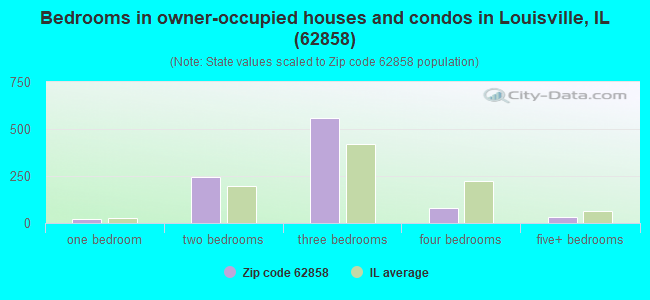
Median number of rooms in houses and condos:
Here:
6.5
State:
6.4
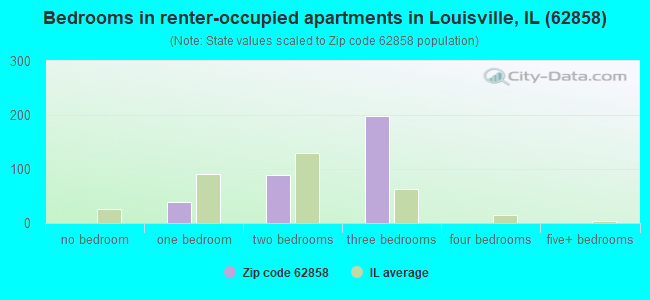
Median number of rooms in apartments:
Here:
4.8
State:
4.1
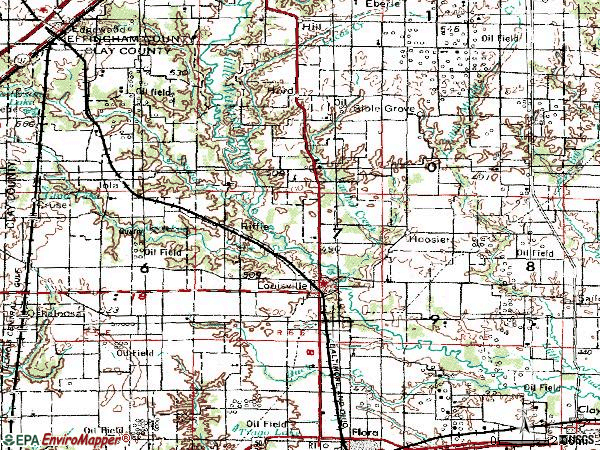
Notable locations in this zip code not listed on our city pages
Notable locations in zip code 62858: Louisville City Hall (A), Hoosier Town Hall (B), Clay County Courthouse (C), North Clay Fire Protection District (D). Display/hide their locations on the map
Churches in zip code 62858 include: Old Union Church (A), Bethel Church (B), Pleasant Hill Church (C), Red Brush Church (D), Saint Pauls Church (E), Shouse Chapel (F), Golden Church (G), Wabash Church (H), Hoosier Prairie Baptist Church (I). Display/hide their locations on the map
Cemeteries: Saint John Cemetery (1), Burke Cemetery (2), Lewis Cemetery (3), McKnight Cemetery (4), Old Union Cemetery (5), Riffle Cemetery (6), Old Louisville Cemetery (7). Display/hide their locations on the map
Creeks: Lucas Creek (A), Dismal Creek (B), Crooked Creek (C), Cottonwood Creek (D), Georgetown Creek (E), Panther Creek (F). Display/hide their locations on the map
In group quarters: 109 (-1 institutionalized population)
Size of family households: 390 2-persons, 155 3-persons, 166 4-persons, 127 5-persons, 14 6-persons, 3 7-or-more-persons
Size of nonfamily households: 356 1-person, 59 2-persons
398 married couples with children.
465 single-parent households (82 men, 383 women).
98.4% of residents of 62858 zip code speak English at home.
0.6% of residents speak Spanish at home (100% very well).
0.7% of residents speak other Indo-European language at home (55% very well, 45% not well).
Foreign born population: 3 (0.1%) (0.0% of them are naturalized citizens)
:
0.1%
Whole state:
14.4%
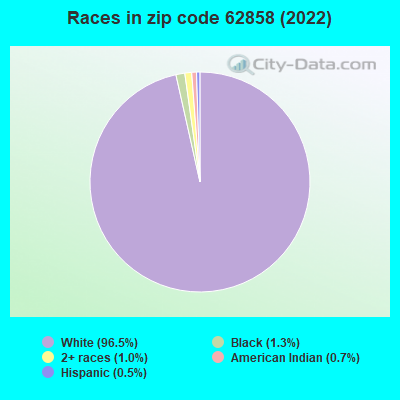
50%Honduras
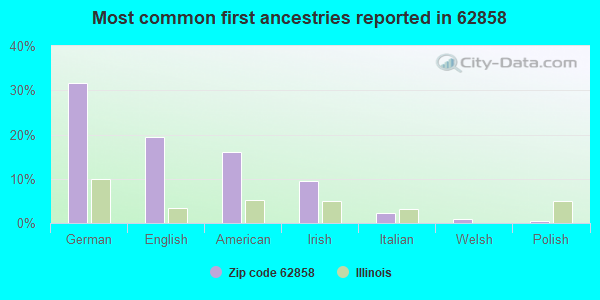
32%German
19%English
16%American
10%Irish
2%Italian
1%Welsh
0%Polish
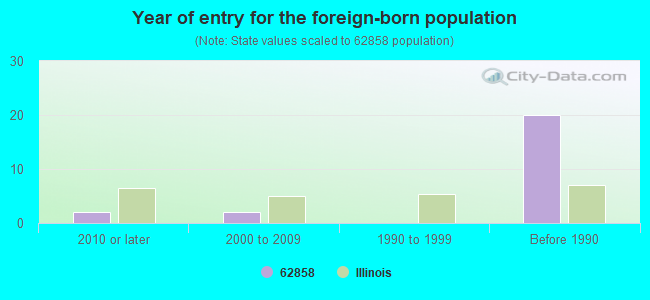
Year of entry for the foreign-born population
22010 or later
22000 to 2009
01990 to 1999
20Before 1990
Major facilities with environmental interests located in this zip code:
COX TRUCKING (RR #1/5 MI W KINMUNDY RD/TURN in LOUISVILLE, IL)
STATE MASTER (Illinois EPA Project) - National Pollutant Discharge Elimination System Permit National Pollutant Discharge Elimination System NON-MAJOR (Tracking pollutant discharge elimination systems) - permit
ILLINOIS VALLEY PAVING CO (RURAL in LOUISVILLE, IL)
STATE MASTER (Illinois EPA Project) - AIR PROGRAM AIR MINOR (AIRS/AFS) Business SIC classification: NONCLASSIFIABLE ESTABLISHMENTS
LOUISVILLE SEED HOUSE (925 CHESTNUT in LOUISVILLE, IL)
STATE MASTER (Illinois EPA Project) - AIR PROGRAM AIR MINOR (AIRS/AFS) Business SIC classification: NONCLASSIFIABLE ESTABLISHMENTS Alternative names: BILL IKEMIRE
LOUISVILLE STP (SOUTH MAIN STREET in LOUISVILLE, IL)
STATE MASTER (Illinois EPA Project) - National Pollutant Discharge Elimination System Permit National Pollutant Discharge Elimination System NON-MAJOR (Tracking pollutant discharge elimination systems) - permit Business SIC classification: SEWERAGE SYSTEMS Alternative names: LOUISVILLE STP, VILLAG EOF, LOUISVILLE STP, VILLAGE OF
MARATHON PIPE LINE CO - BIBLE GROVE STAT (RURAL in BIBLE GROVE, IL)
STATE MASTER (Illinois EPA Project) - AIR PROGRAM AIR MINOR (AIRS/AFS) Business SIC classification: REFINED PETROLEUM PIPELINES
OIL TECHNOLOGY GROUP/ILLINOIS BASIN (RURAL in BIBLE GROVE, IL)
STATE MASTER (Illinois EPA Project) - AIR PROGRAM AIR MINOR (AIRS/AFS) Business SIC classification: PETROLEUM BULK STATIONS AND TERMINALS
NORTH CLAY COMMUNITY HIGH SCHOOL (P O BOX 220 in LOUISVILLE, IL)
(Geographic Names Information System) (National Center for Education Statistics) - STATE ID-1201302500001 Organizations: NORTH CLAY C U SCHOOL DISTRICT 25 (SCHOOL DISTRICT)
NORTH CLAY ELEM/JR HIGH SCH (PO BOX 279 in LOUISVILLE, IL)
(National Center for Education Statistics) - STATE ID-1201302502004 Organizations: NORTH CLAY C U SCHOOL DISTRICT 25 (SCHOOL DISTRICT)
SAFE SCHOOL ROE 12 CLAY COUNTY (231 S MAIN ST in LOUISVILLE, IL)
(National Center for Education Statistics) - STATE ID-1200000009302 Organizations: CLAY/CWFORD/JSPER/LWRNCE/RHLAND (SCHOOL DISTRICT)
JONES?ROBERT G. (RR 1- 1/4 MI ON KINMUNDY BLKTP in LOUISVILLE, IL)
National Pollutant Discharge Elimination System NON-MAJOR (Tracking pollutant discharge elimination systems) - permit Alternative names: JONES, ROBERT G.
KINCAID OIL INC (PO BOX 141 in LOUISVILLE, IL)
AIR MINOR (AIRS/AFS) CRITERIA AND HAZARDOUS AIR POLLUTANT INVENTORY (Inventory of air pollution sources) Business SIC classification: PETROLEUM BULK STATIONS AND TERMINALS
LEWIS TRUCKING SERVICE, INC. (RR 4 BOX 268 in LOUISVILLE, IL)
National Pollutant Discharge Elimination System NON-MAJOR (Tracking pollutant discharge elimination systems) - permit
ASHLAND PIPE LINE CO (LEONARD STAT CO-RD 1450N in HOOSIER TWP, IL)
AIR MINOR (AIRS/AFS) Business SIC classification: PETROLEUM BULK STATIONS AND TERMINALS
Housing units lacking complete plumbing facilities: 3.3% Housing units lacking complete kitchen facilities: 2.9%
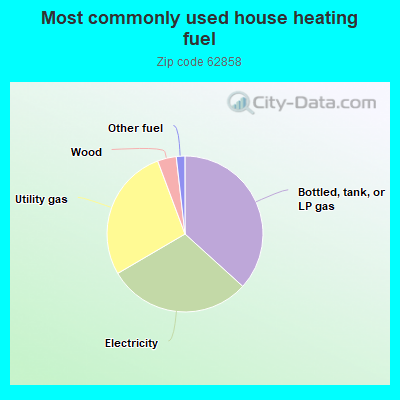
36.8%Bottled, tank, or LP gas
29.9%Electricity
27.8%Utility gas
3.9%Wood
1.8%Other fuel
Population in 1990: 3,688.
Place of birth for U.S.-born residents:
This state: 2,860
Northeast: 1
Midwest: 136
South: 113
West: 144
67% of the 62858 zip code residents lived in the same house 5 years ago. Out of people who lived in different houses, 55% lived in this county. Out of people who lived in different counties, 50% lived in Illinois.
86% of the 62858 zip code residents lived in the same house 1 year ago. Out of people who lived in different houses, 56% moved from this county. Out of people who lived in different houses, 36% moved from different county within same state. Out of people who lived in different houses, 8% moved from different state. Out of people who lived in different houses, 0% moved from abroad.
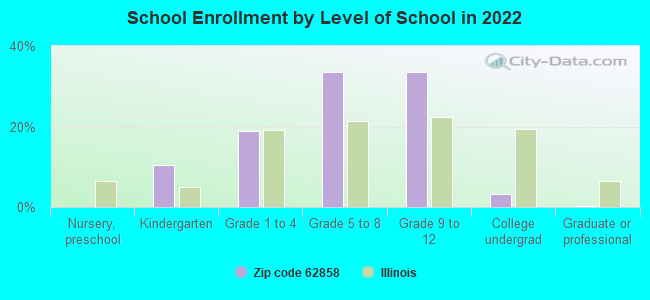
Private vs. public school enrollment:
Students in private schools in grades 1 to 8 (elementary and middle school): 115
Here:
29.5%
Illinois:
13.3%
Students in private schools in grades 9 to 12 (high school): 64
Here:
25.9%
Illinois:
9.9%
Students in private undergraduate colleges: 3
Here:
15.3%
Illinois:
27.4%
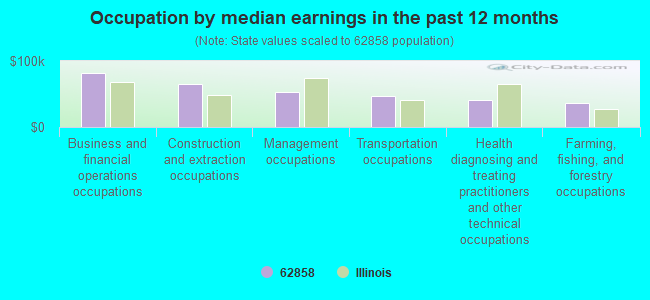
Occupation by median earnings in the past 12 months ($)
82,296Business and financial operations occupations
64,562Construction and extraction occupations
52,972Management occupations
46,450Transportation occupations
41,012Health diagnosing and treating practitioners and other technical occupations
36,975Farming, fishing, and forestry occupations
Top industries in this zip code by the number of employees in 2005:
Health Care and Social Assistance: Nursing Care Facilities (10-19: 2)
Other Services (except Public Administration): Religious Organizations (5-9: 2, 1-4: 1)
Other Services (except Public Administration): Funeral Homes and Funeral Services (10-19: 1)
Accommodation and Food Services: Drinking Places (Alcoholic Beverages) (10-19: 1)
People in group quarters in 2010:
46 people in nursing facilities/skilled-nursing facilities
33 people in group homes intended for adults
6 people in local jails and other municipal confinement facilities
People in group quarters in 2000:
73 people in homes for the mentally ill
16 people in homes for the mentally retarded
8 people in homes or halfway houses for drug/alcohol abuse
Fatal accident statistics in 2011:
Fatal accident count: 2
Vehicles involved in fatal accidents: 3
Fatal accidents caused by drunken drivers: 1
Fatalities: 2
Persons involved in fatal accidents: 4
Pedestrians involved in fatal accidents: 0
Fatal accident statistics in 2010:
Fatal accident count: 1
Vehicles involved in fatal accidents: 1
Fatal accidents caused by drunken drivers: 0
Fatalities: 1
Persons involved in fatal accidents: 2
Pedestrians involved in fatal accidents: 0
2002 - 2018 National Fire Incident Reporting System (NFIRS) incidents
Based on the data from the years 2002 - 2018 the average number of fires per year is 22. The highest number of reported fire incidents - 42 took place in 2007, and the least - 7 in 2003. The data has a rising trend.
When looking into fire subcategories, the most incidents belonged to: Outside Fires (50.3%), and Structure Fires (27.2%).
Fire incident types reported to NFIRS in Zip Code 62858


 Nearest zip codes: 62879, 62839, 62434, 62426, 62424, 62443.
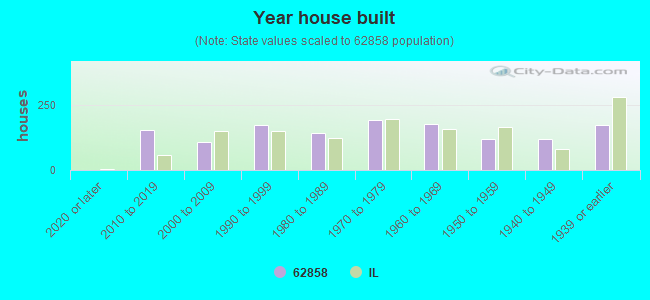


 Based on the data from the years 2002 - 2018 the average number of fires per year is 22. The highest number of reported fire incidents - 42 took place in 2007, and the least - 7 in 2003. The data has a rising trend.
 When looking into fire subcategories, the most incidents belonged to: Outside Fires (50.3%), and Structure Fires (27.2%).