Estimated zip code population in 2022: 1,921 Zip code population in 2010: 1,702 Zip code population in 2000: 1,904
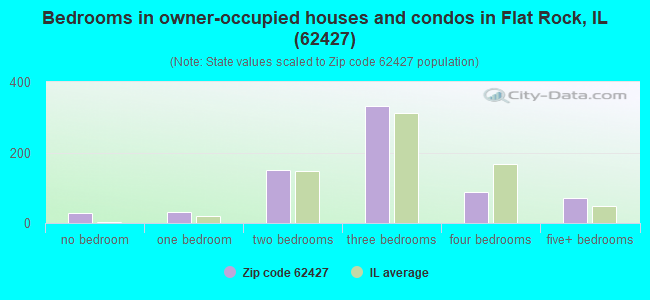
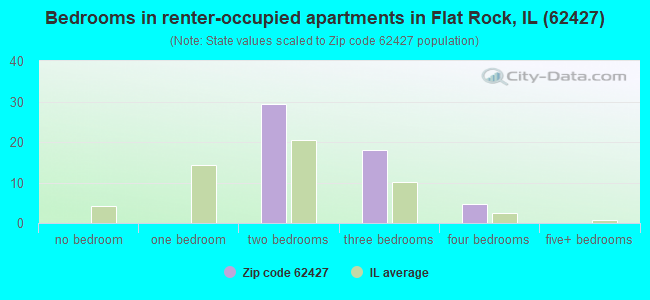
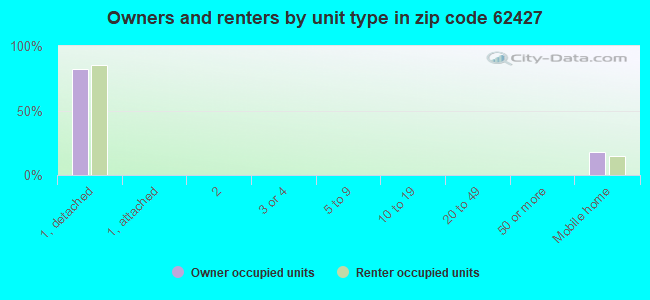
Houses and condos: 760 Renter-occupied apartments: 53
% of renters here:
7%
State:
33%
March 2022 cost of living index in zip code 62427: 82.9 (low, U.S. average is 100)
Land area: 88.8 sq. mi. Water area: 0.4 sq. mi.
Population density: 22 people per square mile
(very low).
OSM Map
General Map
Google Map
MSN Map
OSM Map
General Map
Google Map
MSN Map
OSM Map
General Map
Google Map
MSN Map
OSM Map
General Map
Google Map
MSN Map
Please wait while loading the map...
Real estate property taxes paid for housing units in 2022:
This zip code:
1.3% ($1,244)
Illinois:
2.0% ($4,912)
Median real estate property taxes paid for housing units with mortgages in 2022: $2,026 (1.0%) Median real estate property taxes paid for housing units with no mortgage in 2022: $809 (1.1%)
Business Search- 14 Million verified businesses
Males: 862
(44.9%)
Females: 1,058
(55.1%)
For population 25 years and over in 62427:
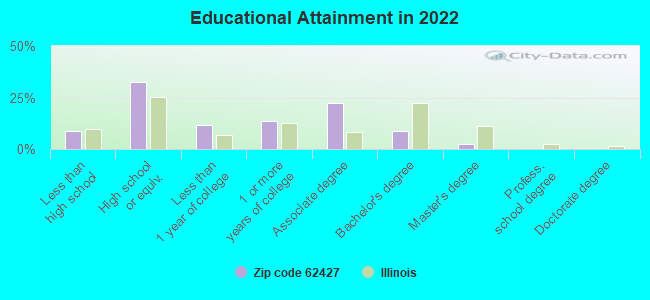
High school or higher: 89.4%
Bachelor's degree or higher: 11.0%
Graduate or professional degree: 2.2%
Unemployed: 9.8%
Mean travel time to work (commute): 20.3 minutes
For population 15 years and over in 62427:
Never married: 24.1%
Now married: 64.4%
Separated: 0.6%
Widowed: 7.3%
Divorced: 3.6%
Zip code 62427 compared to state average:
Median house value significantly below state average.
Unemployed percentage above state average.
Black race population percentage significantly below state average.
Hispanic race population percentage significantly below state average.
Foreign-born population percentage significantly below state average.
Renting percentage significantly below state average.
Length of stay since moving in significantly above state average.
Number of college students below state average.
Percentage of population with a bachelor's degree or higher significantly below state average.
Averages for the 2020 tax year for zip code 62427, filed in 2021:
Average Adjusted Gross Income (AGI) in 2020: $61,185 (Individual Income Tax Returns)
Here:
$61,185
State:
$82,626
Salary/wage: $50,809 (reported on 75.7% of returns)
Here:
$50,809
State:
$66,640
(% of AGI for various income ranges: 1060.7% for AGIs below $25k, 3622.7% for AGIs $25k-50k, 6600.0% for AGIs $50k-75k, 8196.0% for AGIs $75k-100k, 17698.8% for AGIs $100k-200k)
Taxable interest for individuals: $503 (reported on 39.2% of returns)
This zip code:
$503
Illinois:
$2,376
(% of AGI for various income ranges: 12.7% for AGIs below $25k, 23.6% for AGIs $25k-50k, 38.6% for AGIs $50k-75k, 26.0% for AGIs $75k-100k, 76.2% for AGIs $100k-200k)
Ordinary dividends: $2,229 (reported on 23.0% of returns)
Here:
$2,229
State:
$9,061
(% of AGI for various income ranges: 65.3% for AGIs below $25k, 56.4% for AGIs $25k-50k, 62.9% for AGIs $50k-75k, 218.8% for AGIs $100k-200k)
Net capital gain/loss in AGI: +$3,800 (reported on 17.6% of returns)
Here:
+$3,800
State:
+$31,684
(% of AGI for various income ranges: 19.3% for AGIs below $25k, 36.4% for AGIs $25k-50k, 75.7% for AGIs $50k-75k, 465.0% for AGIs $100k-200k)
Profit/loss from business: +$9,569 (reported on 17.6% of returns)
Here:
+$9,569
State:
+$12,175
(% of AGI for various income ranges: 85.3% for AGIs below $25k, 317.3% for AGIs $25k-50k, 615.7% for AGIs $50k-75k, 420.0% for AGIs $100k-200k)
Taxable individual retirement arrangement distribution: $17,260 (reported on 13.5% of returns)
62427:
$17,260
Illinois:
$21,613
(% of AGI for various income ranges: 246.7% for AGIs below $25k, 827.1% for AGIs $50k-75k, 971.2% for AGIs $100k-200k)
Earned income credit: $1,630 (reported on 13.5% of returns)
Here:
$1,630
State:
$2,311
(% of AGI for various income ranges: 71.3% for AGIs below $25k, 50.9% for AGIs $25k-50k)
Percentage of individuals using paid preparers for their 2020 taxes: 91.9%
Here:
92%
State:
93%
(% for various income ranges: 92.0% for AGIs below $25k, 93.3% for AGIs $25k-50k, 91.7% for AGIs $50k-75k, 85.7% for AGIs $75k-100k, 107.7% for AGIs $100k-200k, 0.0% for AGIs over 200k)
Averages for the 2012 tax year for zip code 62427, filed in 2013:
Average Adjusted Gross Income (AGI) in 2012: $47,841 (Individual Income Tax Returns)
Here:
$47,841
State:
$68,058
Salary/wage: $42,468 (reported on 76.9% of returns)
Here:
$42,468
State:
$55,396
(% of AGI for various income ranges: 61.7% for AGIs below $25k, 68.4% for AGIs $25k-50k, 70.1% for AGIs $50k-75k, 74.2% for AGIs $75k-100k, 65.9% for AGIs $100k-200k)
Taxable interest for individuals: $494 (reported on 41.0% of returns)
This zip code:
$494
Illinois:
$1,969
(% of AGI for various income ranges: 0.8% for AGIs below $25k, 0.4% for AGIs $25k-50k, 0.5% for AGIs $50k-75k, 0.2% for AGIs $75k-100k, 0.4% for AGIs $100k-200k)
Ordinary dividends: $1,362 (reported on 20.5% of returns)
Here:
$1,362
State:
$7,786
(% of AGI for various income ranges: 1.1% for AGIs below $25k, 0.6% for AGIs $25k-50k, 0.5% for AGIs $50k-75k, 0.3% for AGIs $75k-100k, 0.6% for AGIs $100k-200k)
Net capital gain/loss in AGI: +$1,100 (reported on 14.1% of returns)
Here:
+$1,100
State:
+$22,183
(% of AGI for various income ranges: 0.6% for AGIs $75k-100k, 0.7% for AGIs $100k-200k)
Profit/loss from business: +$11,479 (reported on 17.9% of returns)
Here:
+$11,479
State:
+$12,903
(% of AGI for various income ranges: 6.3% for AGIs below $25k, 13.3% for AGIs $25k-50k, 7.1% for AGIs $75k-100k)
Taxable individual retirement arrangement distribution: $11,230 (reported on 12.8% of returns)
62427:
$11,230
Illinois:
$17,929
(% of AGI for various income ranges: 6.5% for AGIs below $25k, 6.5% for AGIs $25k-50k, 6.6% for AGIs $75k-100k)
Total itemized deductions: $18,850 (18% of AGI, reported on 15.4% of returns)
Here:
$18,850
State:
$26,433
Here:
17.9% of AGI
State:
19.2% of AGI
(% of AGI for various income ranges: 10.2% for AGIs below $25k, 6.2% for AGIs $50k-75k, 5.9% for AGIs $75k-100k, 8.1% for AGIs $100k-200k)
Charity contributions: $5,467 (reported on 7.7% of returns)
Here:
$5,467
State:
$4,525
Taxes paid: $6,575 (reported on 15.4% of returns)
62427:
$6,575
State:
$11,968
(% of AGI for various income ranges: 1.5% for AGIs below $25k, 1.6% for AGIs $50k-75k, 2.0% for AGIs $75k-100k, 3.7% for AGIs $100k-200k)
Earned income credit: $1,727 (reported on 14.1% of returns)
Here:
$1,727
State:
$2,349
(% of AGI for various income ranges: 4.1% for AGIs below $25k, 0.6% for AGIs $25k-50k)
Percentage of individuals using paid preparers for their 2012 taxes: 70.5%
Here:
71%
State:
57%
(% for various income ranges: 64.5% for AGIs below $25k, 68.4% for AGIs $25k-50k, 81.8% for AGIs $50k-75k, 75.0% for AGIs $75k-100k, 77.8% for AGIs $100k-200k)
Averages for the 2004 tax year for zip code 62427, filed in 2005:
Average Adjusted Gross Income (AGI) in 2004: $35,703 (Individual Income Tax Returns)
Here:
$35,703
State:
$54,625
Salary/wage: $32,653 (reported on 79.5% of returns)
Here:
$32,653
State:
$46,811
(% of AGI for various income ranges: 77.3% for AGIs below $10k, 61.3% for AGIs $10k-25k, 76.9% for AGIs $25k-50k, 77.0% for AGIs $50k-75k, 76.9% for AGIs $75k-100k, 57.7% for AGIs over 100k)
Taxable interest for individuals: $1,066 (reported on 49.3% of returns)
This zip code:
$1,066
Illinois:
$2,101
(% of AGI for various income ranges: 4.1% for AGIs below $10k, 3.0% for AGIs $10k-25k, 1.6% for AGIs $25k-50k, 1.3% for AGIs $50k-75k, 0.5% for AGIs $75k-100k, 0.8% for AGIs over 100k)
Taxable dividends: $1,463 (reported on 26.9% of returns)
Here:
$1,463
State:
$4,306
(% of AGI for various income ranges: 1.4% for AGIs below $10k, 1.3% for AGIs $10k-25k, 0.9% for AGIs $25k-50k, 0.6% for AGIs $50k-75k, 0.6% for AGIs $75k-100k, 3.2% for AGIs over 100k)
Net capital gain/loss: +$4,010 (reported on 13.4% of returns)
Here:
+$4,010
State:
+$17,321
(% of AGI for various income ranges: 0.3% for AGIs below $10k, 0.5% for AGIs $10k-25k, 0.7% for AGIs $25k-50k, 1.5% for AGIs $50k-75k, -0.0% for AGIs $75k-100k, 6.4% for AGIs over 100k)
Profit/loss from business: +$8,339 (reported on 14.7% of returns)
Here:
+$8,339
State:
+$11,771
(% of AGI for various income ranges: 11.3% for AGIs below $10k, 5.7% for AGIs $10k-25k, 1.9% for AGIs $25k-50k, 4.1% for AGIs $50k-75k, 4.7% for AGIs $75k-100k)
Profit/loss from farming: +$2,493 (reported on 9.1% of returns)
Here:
+$2,493
State:
+$2,327
(% of AGI for various income ranges: -3.1% for AGIs below $10k, 1.7% for AGIs $10k-25k, 0.2% for AGIs $25k-50k, 1.4% for AGIs $50k-75k, 0.4% for AGIs $75k-100k)
IRA payment deduction: $1,900 (reported on 1.3% of returns)
62427:
$1,900
Illinois:
$3,087
Total itemized deductions: $14,772 (21% of AGI, reported on 13.3% of returns)
Here:
$14,772
State:
$20,239
Here:
21.4% of AGI
State:
19.5% of AGI
(% of AGI for various income ranges: 7.3% for AGIs $25k-50k, 5.3% for AGIs $50k-75k, 5.3% for AGIs $75k-100k, 8.0% for AGIs over 100k)
Charity contributions deductions: $3,121 (4% of AGI, reported on 8.7% of returns)
Here:
$3,121
State:
$3,719
Here:
4.3% of AGI
State:
3.4% of AGI
(% of AGI for various income ranges: 0.4% for AGIs $25k-50k, 0.9% for AGIs $50k-75k, 1.3% for AGIs $75k-100k, 1.4% for AGIs over 100k)
Total tax: $4,127 (reported on 75.2% of returns)
62427:
$4,127
State:
$9,882
(% of AGI for various income ranges: 2.6% for AGIs below $10k, 4.1% for AGIs $10k-25k, 6.2% for AGIs $25k-50k, 9.1% for AGIs $50k-75k, 10.5% for AGIs $75k-100k, 16.5% for AGIs over 100k)
Earned income credit: $1,684 (reported on 12.5% of returns)
Here:
$1,684
State:
$1,788
Percentage of individuals using paid preparers for their 2004 taxes: 73.6%
Here:
74%
State:
61%
(% for various income ranges: 69.7% for AGIs below $10k, 68.3% for AGIs $10k-25k, 76.6% for AGIs $25k-50k, 79.1% for AGIs $50k-75k, 80.0% for AGIs $75k-100k, 70.8% for AGIs over 100k)
Likely homosexual households (counted as self-reported same-sex unmarried-partner households)
Lesbian couples: 3.0% of all households
Gay men: 0.0% of all households
Household received Food Stamps/SNAP in the past 12 months: 104 Household did not receive Food Stamps/SNAP in the past 12 months: 639
Women who had a birth in the past 12 months: 8 (0 now married, 7 unmarried) Women who did not have a birth in the past 12 months: 360 (234 now married, 123 unmarried)
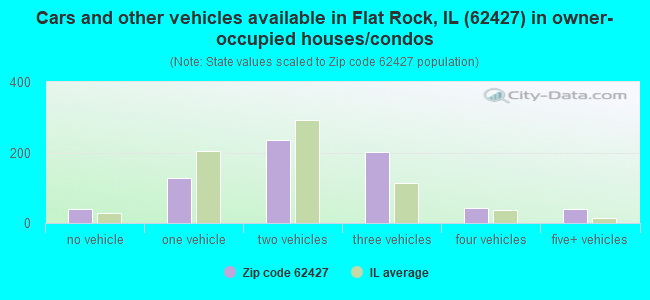
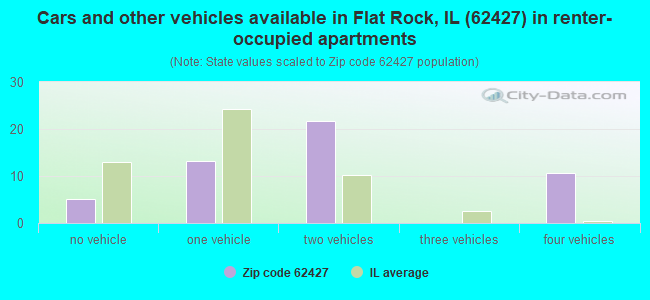
Housing units in zip code 62427 with a mortgage: 250 (27 second mortgage, 21 both second mortgage and home equity loan) Median monthly owner costs for units with a mortgage: $1,158 Median monthly owner costs for units without a mortgage: $445
Residents with income below the poverty level in 2022:
This zip code:
19.4%
Whole state:
11.9%
Residents with income below 50% of the poverty level in 2022:
This zip code:
11.2%
Whole state:
5.7%
Median number of rooms in houses and condos:
Here:
6.5
State:
6.4
Median number of rooms in apartments:
Here:
5.4
State:
4.1
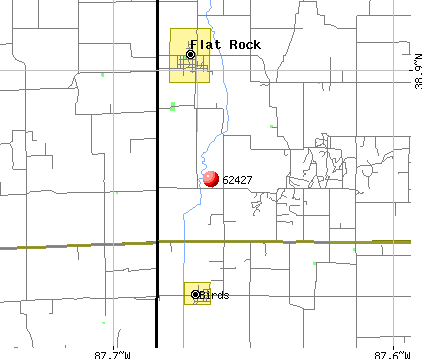
Notable locations in this zip code not listed on our city pages
Notable locations in zip code 62427: Shaws Landing (A), M and J Farms (B), Newell Farms (C), Shady Lane Fish Farm (D), Flat Rock Area Fire Protection District (E). Display/hide their locations on the map
Churches in zip code 62427 include: Canaan Primitive Baptist Church (A), East Pinkstaff Church (B), Union Church (C), Green Hill Church (D). Display/hide their locations on the map
Cemeteries: Allen Cemetery (1), Allison Cemetery (2), Baker Cemetery (3), Bartmess Cemetery (4), Cecedar Cemetery (5), Jones Cemetery (6), Johnson Cemetery (7). Display/hide their locations on the map
Size of family households: 262 2-persons, 75 3-persons, 86 4-persons, 101 5-persons, 4 7-or-more-persons
Size of nonfamily households: 200 1-person, 2 2-persons, 4 3-persons
411 married couples with children.
12 single-parent households (9 men, 3 women).
94.1% of residents of 62427 zip code speak English at home.
0.4% of residents speak Spanish at home (100% very well).
5.2% of residents speak other Indo-European language at home (87% very well, 13% well).
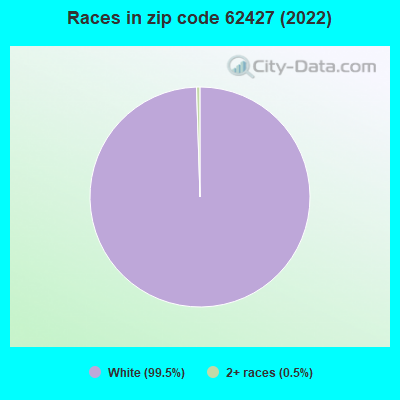
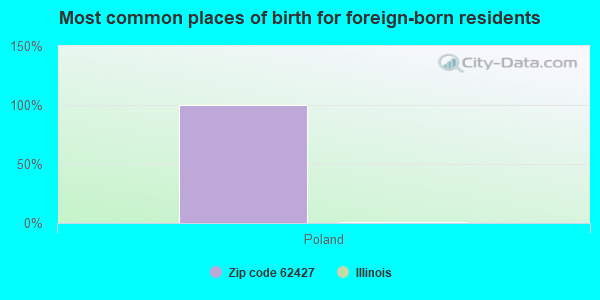
Foreign born population: 8 (0.4%) (100.0% of them are naturalized citizens)
This zip code:
0.4%
Whole state:
14.4%
100%Poland
29%American
26%English
19%German
8%Irish
2%European
1%Norwegian
1%Romanian
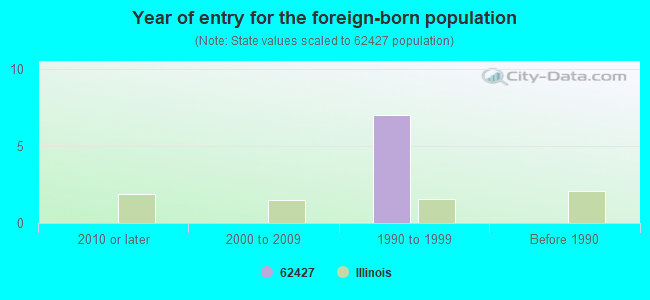
Year of entry for the foreign-born population
02010 or later
02000 to 2009
71990 to 1999
0Before 1990
Facilities with environmental interests located in this zip code:
MONT EAGLE MILLS INC (MAIN AND MILLS STS in FLAT ROCK, IL)
STATE MASTER (Illinois EPA Project) - AIR PROGRAM AIR MINOR (AIRS/AFS) ENFORCEMENT/COMPLIANCE ACTIVITY (Integrated Compliance Information System) CRITERIA AND HAZARDOUS AIR POLLUTANT INVENTORY (Inventory of air pollution sources) Business SIC classification: CROP PREPARATION SERVICES FOR MARKET, EXCEPT COTTON GINNING Alternative names: MONT EAGLE MILLS INC - FLAT ROCK PLANT, REINBOLD & SONS, INC., REINBOLD & SONS INCORPORATED FLAT ROCK PLANT
HAROLD BRINKLEY (RURAL ROUTE in HEATHSVILLE, IL)
STATE MASTER (Illinois EPA Project) - AIR PROGRAM AIR MINOR (AIRS/AFS) Business SIC classification: NONCLASSIFIABLE ESTABLISHMENTS Alternative names: HAROLD BURGENER/HAROLD BRINKLEY
MARATHON PIPE LINE CO-MONTGOMERY TWP STA (RURAL in HEATHSVILLE, IL)
STATE MASTER (Illinois EPA Project) - AIR PROGRAM AIR MINOR (AIRS/AFS) Business SIC classification: REFINED PETROLEUM PIPELINES
REINBOLD & SONS INC (MAIN ST in FLAT ROCK, IL)
STATE MASTER (Illinois EPA Project) - AIR PROGRAM AIR MINOR (AIRS/AFS) Business SIC classification: FARM SUPPLIES
REINBOLD AND SONS INC (PO BOX 188 MAIN & MILL ST in FLAT ROCK, IL)
COMPLIANCE ACTIVITY (Tracking inspections of insecticide, fungicide, and rodenticide, and toxic substances)
RICH-LAW SVC CO (RR # 1 in FLAT ROCK, IL)
COMPLIANCE ACTIVITY (Tracking inspections of insecticide, fungicide, and rodenticide, and toxic substances)
Housing units lacking complete plumbing facilities: 2.8% Housing units lacking complete kitchen facilities: 1.2%
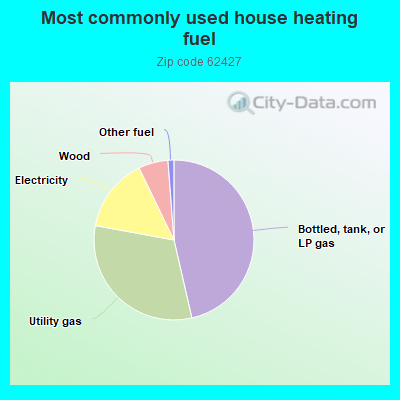
46.6%Bottled, tank, or LP gas
31.6%Utility gas
15.0%Electricity
6.0%Wood
1.2%Other fuel
Population in 1990: 2,173.
Place of birth for U.S.-born residents:
This state: 1,110
Northeast: 2
Midwest: 693
South: 88
West: 20
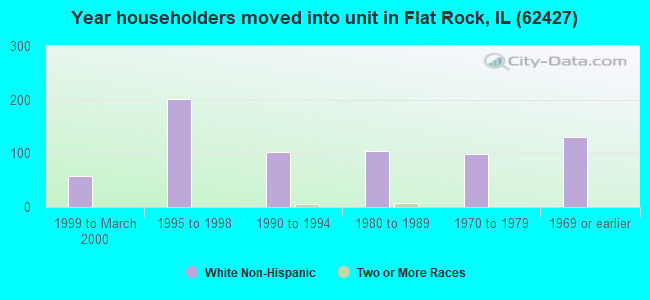
57% of the 62427 zip code residents lived in the same house 5 years ago. Out of people who lived in different houses, 68% lived in this county. Out of people who lived in different counties, 50% lived in Illinois.
91% of the 62427 zip code residents lived in the same house 1 year ago. Out of people who lived in different houses, 15% moved from this county. Out of people who lived in different houses, 1% moved from different county within same state. Out of people who lived in different houses, 93% moved from different state.
Private vs. public school enrollment:
Students in private schools in grades 1 to 8 (elementary and middle school): 19
Here:
9.3%
Illinois:
13.3%
Students in private schools in grades 9 to 12 (high school):
Here:
0.0%
Illinois:
9.9%
Students in private undergraduate colleges:
Here:
0.0%
Illinois:
27.4%
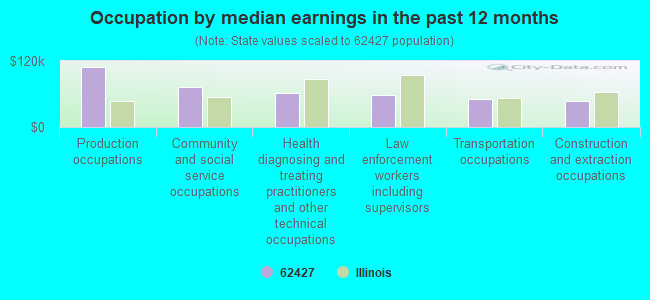
Occupation by median earnings in the past 12 months ($)
109,614Production occupations
72,990Community and social service occupations
61,317Health diagnosing and treating practitioners and other technical occupations
58,770Law enforcement workers including supervisors
50,904Transportation occupations
47,584Construction and extraction occupations
Top industries in this zip code by the number of employees in 2005:
Other Services (except Public Administration): Religious Organizations (1-4: 3)
Mining: Support Activities for Oil and Gas Operations (1-4: 2)
Wholesale Trade: Grain and Field Bean Merchant Wholesalers (1-4: 1)
Other Services (except Public Administration): Civic and Social Organizations (1-4: 1)
Mining: Crude Petroleum and Natural Gas Extraction (1-4: 1)
Construction: New Single-Family Housing Construction (except Operative Builders) (1-4: 1)
Fatal accident statistics in 2014:
Fatal accident count: 2
Vehicles involved in fatal accidents: 3
Fatal accidents caused by drunken drivers: 0
Fatalities: 2
Persons involved in fatal accidents: 4
Pedestrians involved in fatal accidents: 0
Fatal accident statistics in 2011:
Fatal accident count: 1
Vehicles involved in fatal accidents: 2
Fatal accidents caused by drunken drivers: 0
Fatalities: 1
Persons involved in fatal accidents: 5
Pedestrians involved in fatal accidents: 0
2002 - 2018 National Fire Incident Reporting System (NFIRS) incidents
According to the data from the years 2002 - 2018 the average number of fires per year is 16. The highest number of reported fire incidents - 40 took place in 2009, and the least - 6 in 2002. The data has a constant trend.
When looking into fire subcategories, the most reports belonged to: Outside Fires (52.2%), and Structure Fires (28.4%).
Fire incident types reported to NFIRS in Zip Code 62427

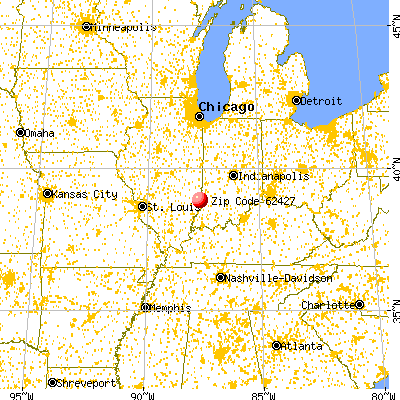


 Nearest zip codes: 62451, 62439, 62454, 62417, 47561, 47861.
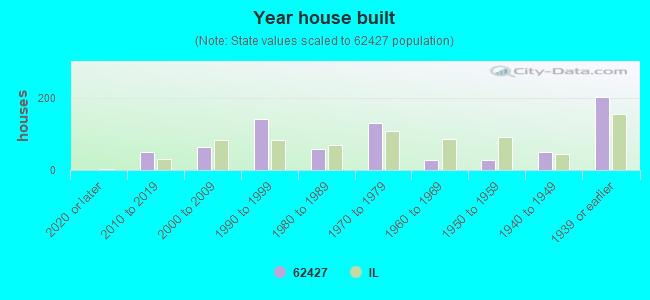


 According to the data from the years 2002 - 2018 the average number of fires per year is 16. The highest number of reported fire incidents - 40 took place in 2009, and the least - 6 in 2002. The data has a constant trend.
 When looking into fire subcategories, the most reports belonged to: Outside Fires (52.2%), and Structure Fires (28.4%).