Estimated zip code population in 2022: 4,025 Zip code population in 2010: 4,759 Zip code population in 2000: 4,983
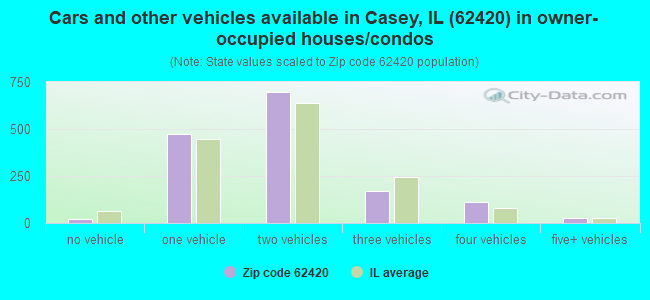
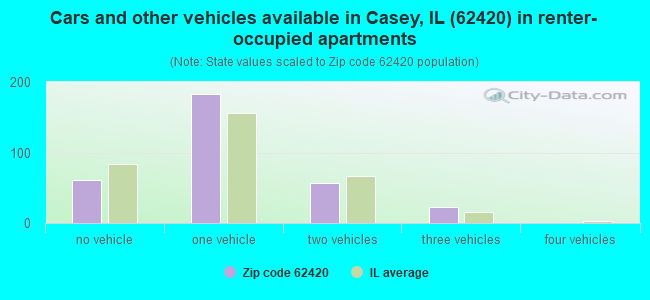
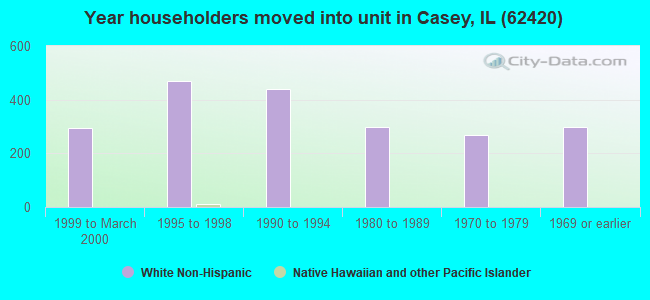
Houses and condos: 2,074 Renter-occupied apartments: 324
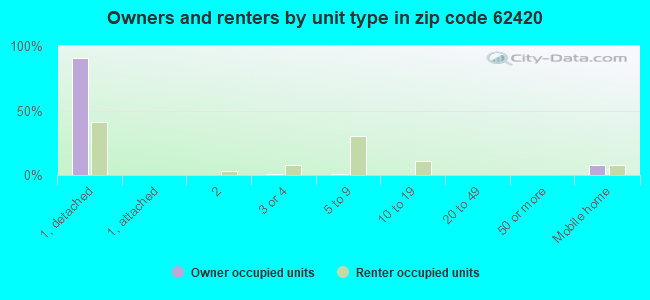
% of renters here:
18%
State:
33%
March 2022 cost of living index in zip code 62420: 75.1 (low, U.S. average is 100)
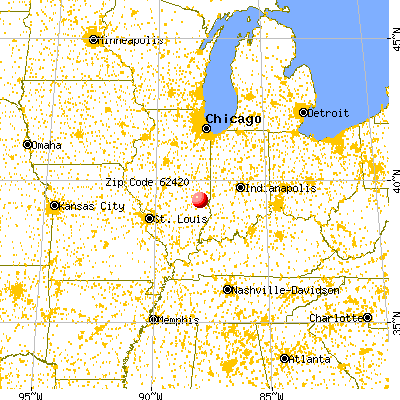
Land area: 123.0 sq. mi. Water area: 0.2 sq. mi.
Population density: 33 people per square mile
(very low).
OSM Map
General Map
Google Map
MSN Map
OSM Map
General Map
Google Map
MSN Map
OSM Map
General Map
Google Map
MSN Map
OSM Map
General Map
Google Map
MSN Map
Please wait while loading the map...
Real estate property taxes paid for housing units in 2022:
This zip code:
1.9% ($2,174)
Illinois:
2.0% ($4,912)
Median real estate property taxes paid for housing units with mortgages in 2022: $2,128 (1.9%) Median real estate property taxes paid for housing units with no mortgage in 2022: $2,244 (2.0%)
Averages for the 2020 tax year for zip code 62420, filed in 2021:
Average Adjusted Gross Income (AGI) in 2020: $56,018 (Individual Income Tax Returns)
Here:
$56,018
State:
$82,626
Salary/wage: $42,762 (reported on 81.2% of returns)
Here:
$42,762
State:
$66,640
(% of AGI for various income ranges: 1105.7% for AGIs below $25k, 3452.1% for AGIs $25k-50k, 6175.0% for AGIs $50k-75k, 8316.9% for AGIs $75k-100k, 14585.4% for AGIs $100k-200k)
Taxable interest for individuals: $1,548 (reported on 38.1% of returns)
This zip code:
$1,548
Illinois:
$2,376
(% of AGI for various income ranges: 16.9% for AGIs below $25k, 32.9% for AGIs $25k-50k, 78.2% for AGIs $50k-75k, 127.5% for AGIs $75k-100k, 294.6% for AGIs $100k-200k)
Ordinary dividends: $3,114 (reported on 18.3% of returns)
Here:
$3,114
State:
$9,061
(% of AGI for various income ranges: 25.1% for AGIs below $25k, 34.7% for AGIs $25k-50k, 48.2% for AGIs $50k-75k, 91.9% for AGIs $75k-100k, 332.3% for AGIs $100k-200k)
Net capital gain/loss in AGI: +$7,400 (reported on 16.8% of returns)
Here:
+$7,400
State:
+$31,684
(% of AGI for various income ranges: 6.3% for AGIs below $25k, 53.2% for AGIs $25k-50k, 64.1% for AGIs $50k-75k, 133.1% for AGIs $75k-100k, 711.5% for AGIs $100k-200k)
Profit/loss from business: +$8,938 (reported on 14.7% of returns)
Here:
+$8,938
State:
+$12,175
(% of AGI for various income ranges: 58.8% for AGIs below $25k, 68.2% for AGIs $25k-50k, 285.9% for AGIs $50k-75k, 333.1% for AGIs $75k-100k, 670.0% for AGIs $100k-200k)
Taxable individual retirement arrangement distribution: $12,148 (reported on 10.7% of returns)
62420:
$12,148
Illinois:
$21,613
(% of AGI for various income ranges: 54.3% for AGIs below $25k, 114.7% for AGIs $25k-50k, 165.5% for AGIs $50k-75k, 260.6% for AGIs $75k-100k, 813.1% for AGIs $100k-200k)
Total itemized deductions: $33,000 (reported on 3.0% of returns)
Here:
$33,000
State:
$34,948
(% of AGI for various income ranges: 233.7% for AGIs $25k-50k, 840.0% for AGIs $100k-200k)
Charity contributions: $15,875 (reported on 2.0% of returns)
Here:
$15,875
State:
$13,122
(% of AGI for various income ranges: 488.5% for AGIs $100k-200k)
Taxes paid: $5,700 (reported on 3.0% of returns)
62420:
$5,700
State:
$8,563
(% of AGI for various income ranges: 30.3% for AGIs $25k-50k, 174.6% for AGIs $100k-200k)
Earned income credit: $2,106 (reported on 15.7% of returns)
Here:
$2,106
State:
$2,311
(% of AGI for various income ranges: 86.5% for AGIs below $25k, 55.8% for AGIs $25k-50k)
Percentage of individuals using paid preparers for their 2020 taxes: 91.4%
Here:
91%
State:
93%
(% for various income ranges: 89.9% for AGIs below $25k, 93.5% for AGIs $25k-50k, 90.6% for AGIs $50k-75k, 91.3% for AGIs $75k-100k, 95.7% for AGIs $100k-200k, 75.0% for AGIs over 200k)
Averages for the 2012 tax year for zip code 62420, filed in 2013:
Average Adjusted Gross Income (AGI) in 2012: $47,816 (Individual Income Tax Returns)
Here:
$47,816
State:
$68,058
Salary/wage: $37,418 (reported on 82.1% of returns)
Here:
$37,418
State:
$55,396
(% of AGI for various income ranges: 72.2% for AGIs below $25k, 75.0% for AGIs $25k-50k, 75.1% for AGIs $50k-75k, 68.1% for AGIs $75k-100k, 57.4% for AGIs $100k-200k, 32.7% for AGIs over 200k)
Taxable interest for individuals: $1,488 (reported on 39.6% of returns)
This zip code:
$1,488
Illinois:
$1,969
(% of AGI for various income ranges: 1.5% for AGIs below $25k, 1.1% for AGIs $25k-50k, 0.6% for AGIs $50k-75k, 1.1% for AGIs $75k-100k, 1.3% for AGIs $100k-200k, 2.4% for AGIs over 200k)
Ordinary dividends: $2,640 (reported on 16.9% of returns)
Here:
$2,640
State:
$7,786
(% of AGI for various income ranges: 1.2% for AGIs below $25k, 0.9% for AGIs $25k-50k, 0.4% for AGIs $50k-75k, 0.5% for AGIs $75k-100k, 1.7% for AGIs $100k-200k, 1.0% for AGIs over 200k)
Net capital gain/loss in AGI: +$4,974 (reported on 13.0% of returns)
Here:
+$4,974
State:
+$22,183
(% of AGI for various income ranges: 7.7% for AGIs below $25k, 0.8% for AGIs $25k-50k, 1.0% for AGIs $75k-100k, 1.0% for AGIs $100k-200k, 6.1% for AGIs over 200k)
Profit/loss from business: +$12,697 (reported on 15.5% of returns)
Here:
+$12,697
State:
+$12,903
(% of AGI for various income ranges: 3.8% for AGIs below $25k, 2.8% for AGIs $25k-50k, 2.6% for AGIs $50k-75k, 1.6% for AGIs $75k-100k, 11.8% for AGIs $100k-200k)
Taxable individual retirement arrangement distribution: $9,200 (reported on 11.6% of returns)
62420:
$9,200
Illinois:
$17,929
(% of AGI for various income ranges: 2.4% for AGIs below $25k, 2.2% for AGIs $25k-50k, 2.0% for AGIs $50k-75k, 3.2% for AGIs $75k-100k, 3.1% for AGIs $100k-200k)
Total itemized deductions: $21,259 (20% of AGI, reported on 17.9% of returns)
Here:
$21,259
State:
$26,433
Here:
20.2% of AGI
State:
19.2% of AGI
(% of AGI for various income ranges: 4.5% for AGIs below $25k, 5.2% for AGIs $25k-50k, 6.9% for AGIs $50k-75k, 5.9% for AGIs $75k-100k, 11.2% for AGIs $100k-200k, 13.4% for AGIs over 200k)
Charity contributions: $5,452 (reported on 13.0% of returns)
Here:
$5,452
State:
$4,525
(% of AGI for various income ranges: 0.7% for AGIs $25k-50k, 1.0% for AGIs $50k-75k, 1.4% for AGIs $75k-100k, 3.1% for AGIs $100k-200k, 2.1% for AGIs over 200k)
Taxes paid: $7,254 (reported on 17.9% of returns)
62420:
$7,254
State:
$11,968
(% of AGI for various income ranges: 0.7% for AGIs below $25k, 1.1% for AGIs $25k-50k, 2.1% for AGIs $50k-75k, 2.1% for AGIs $75k-100k, 5.1% for AGIs $100k-200k, 4.6% for AGIs over 200k)
Earned income credit: $2,171 (reported on 18.4% of returns)
Here:
$2,171
State:
$2,349
(% of AGI for various income ranges: 6.1% for AGIs below $25k, 1.3% for AGIs $25k-50k)
Percentage of individuals using paid preparers for their 2012 taxes: 63.8%
Here:
64%
State:
57%
(% for various income ranges: 57.1% for AGIs below $25k, 62.7% for AGIs $25k-50k, 67.6% for AGIs $50k-75k, 73.7% for AGIs $75k-100k, 80.0% for AGIs $100k-200k, 75.0% for AGIs over 200k)
Averages for the 2004 tax year for zip code 62420, filed in 2005:
Average Adjusted Gross Income (AGI) in 2004: $34,488 (Individual Income Tax Returns)
Here:
$34,488
State:
$54,625
Salary/wage: $28,950 (reported on 82.0% of returns)
Here:
$28,950
State:
$46,811
(% of AGI for various income ranges: 116.8% for AGIs below $10k, 73.1% for AGIs $10k-25k, 78.7% for AGIs $25k-50k, 78.1% for AGIs $50k-75k, 65.0% for AGIs $75k-100k, 40.6% for AGIs over 100k)
Taxable interest for individuals: $1,874 (reported on 47.1% of returns)
This zip code:
$1,874
Illinois:
$2,101
(% of AGI for various income ranges: 12.2% for AGIs below $10k, 3.4% for AGIs $10k-25k, 1.6% for AGIs $25k-50k, 1.8% for AGIs $50k-75k, 2.6% for AGIs $75k-100k, 3.3% for AGIs over 100k)
Taxable dividends: $3,042 (reported on 20.7% of returns)
Here:
$3,042
State:
$4,306
(% of AGI for various income ranges: 3.6% for AGIs below $10k, 1.5% for AGIs $10k-25k, 0.7% for AGIs $25k-50k, 1.5% for AGIs $50k-75k, 2.0% for AGIs $75k-100k, 3.5% for AGIs over 100k)
Net capital gain/loss: +$9,000 (reported on 16.2% of returns)
Here:
+$9,000
State:
+$17,321
(% of AGI for various income ranges: 1.0% for AGIs below $10k, -0.2% for AGIs $10k-25k, 0.5% for AGIs $25k-50k, 0.9% for AGIs $50k-75k, 0.5% for AGIs $75k-100k, 18.5% for AGIs over 100k)
Profit/loss from business: +$10,389 (reported on 17.5% of returns)
Here:
+$10,389
State:
+$11,771
(% of AGI for various income ranges: 7.4% for AGIs below $10k, 4.9% for AGIs $10k-25k, 3.3% for AGIs $25k-50k, 3.2% for AGIs $50k-75k, 3.9% for AGIs $75k-100k, 11.1% for AGIs over 100k)
Profit/loss from farming: +$6,072 (reported on 6.3% of returns)
Here:
+$6,072
State:
+$2,327
(% of AGI for various income ranges: -2.0% for AGIs below $10k, 0.7% for AGIs $10k-25k, 0.9% for AGIs $25k-50k, 2.3% for AGIs $50k-75k, 4.4% for AGIs $75k-100k, -1.6% for AGIs over 100k)
IRA payment deduction: $2,950 (reported on 2.7% of returns)
62420:
$2,950
Illinois:
$3,087
(% of AGI for various income ranges: 0.2% for AGIs $10k-25k, 0.3% for AGIs $25k-50k, 0.2% for AGIs $50k-75k, 0.6% for AGIs $75k-100k)
Self-employed pension: $10,444 (reported on 0.8% of returns)
Here:
$10,444
Illinois:
$16,965
Total itemized deductions: $15,773 (21% of AGI, reported on 17.1% of returns)
Here:
$15,773
State:
$20,239
Here:
21.0% of AGI
State:
19.5% of AGI
(% of AGI for various income ranges: 6.7% for AGIs below $10k, 6.1% for AGIs $10k-25k, 6.4% for AGIs $25k-50k, 8.7% for AGIs $50k-75k, 11.1% for AGIs $75k-100k, 7.9% for AGIs over 100k)
Charity contributions deductions: $4,620 (6% of AGI, reported on 13.7% of returns)
Here:
$4,620
State:
$3,719
Here:
5.6% of AGI
State:
3.4% of AGI
(% of AGI for various income ranges: 0.7% for AGIs $10k-25k, 1.3% for AGIs $25k-50k, 1.7% for AGIs $50k-75k, 2.6% for AGIs $75k-100k, 3.1% for AGIs over 100k)
Total tax: $4,893 (reported on 70.3% of returns)
62420:
$4,893
State:
$9,882
(% of AGI for various income ranges: 3.9% for AGIs below $10k, 4.2% for AGIs $10k-25k, 6.7% for AGIs $25k-50k, 8.7% for AGIs $50k-75k, 11.1% for AGIs $75k-100k, 19.3% for AGIs over 100k)
Earned income credit: $1,676 (reported on 17.3% of returns)
Here:
$1,676
State:
$1,788
Percentage of individuals using paid preparers for their 2004 taxes: 67.9%
Here:
68%
State:
61%
(% for various income ranges: 57.0% for AGIs below $10k, 67.8% for AGIs $10k-25k, 71.2% for AGIs $25k-50k, 75.3% for AGIs $50k-75k, 73.6% for AGIs $75k-100k, 83.7% for AGIs over 100k)
Likely homosexual households (counted as self-reported same-sex unmarried-partner households)
Lesbian couples: 0.0% of all households
Gay men: 0.4% of all households
Household received Food Stamps/SNAP in the past 12 months: 236 Household did not receive Food Stamps/SNAP in the past 12 months: 1,579
Women who had a birth in the past 12 months: 64 (38 now married, 26 unmarried) Women who did not have a birth in the past 12 months: 741 (378 now married, 360 unmarried)
Housing units in zip code 62420 with a mortgage: 935 (59 second mortgage, 16 both second mortgage and home equity loan) Houses without a mortgage: 34
Median monthly owner costs for units with a mortgage: $1,148 Median monthly owner costs for units without a mortgage: $538
Residents with income below the poverty level in 2022:
This zip code:
10.1%
Whole state:
11.9%
Residents with income below 50% of the poverty level in 2022:
This zip code:
5.1%
Whole state:
5.7%
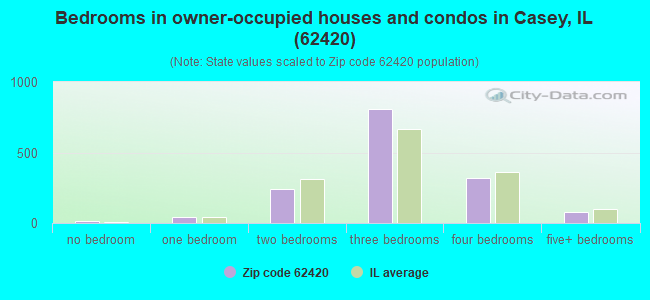
Median number of rooms in houses and condos:
Here:
6.7
State:
6.4
Median number of rooms in apartments:
Here:
4.2
State:
4.1
Notable locations in this zip code not listed on our city pages
Notable locations in zip code 62420: Casey Country Club (A), Casey Township Library (B), Casey City Building (C), Martinsville Fire Protection District Station 2 (D), Casey Fire Department (E), Clark County Ambulance Service (F). Display/hide their locations on the map
Churches in zip code 62420 include: Olive Church (A), Restitution Church (B), Walnut Chapel (C), Macedonia Baptist Church (D), Casey Church of Christ (E), Casey Cumberland Presbyterian Church (F), Casey First Church of the Nazarene (G), Central Southern Baptist Church (H), Community Christian Church (I). Display/hide their locations on the map
Cemeteries: Brandenburg Cemetery (1), Washington Cemetery (2), Baughman Cemetery (3), Washington Cemetery (4), Cumberland Baptist Cemetery (5), Union Cemetery (6), Restitution Cemetery (7). Display/hide their locations on the map
Streams, rivers, and creeks: Mount Branch (A), Chivler Creek (B), Birch Creek (C), East Branch Hurricane Creek (D), West Branch Hurricane Creek (E), Ruffner Creek (F), Turkey Run (G), Quarry Branch (H). Display/hide their locations on the map
In group quarters: 106 (-1 institutionalized population)
Size of family households: 518 2-persons, 282 3-persons, 253 4-persons, 57 5-persons
Size of nonfamily households: 654 1-person, 55 2-persons
642 married couples with children.
210 single-parent households (28 men, 182 women).
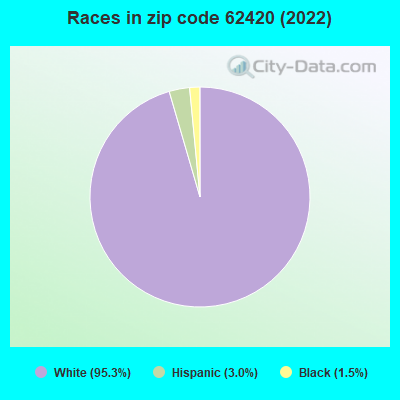
98.6% of residents of 62420 zip code speak English at home.
0.8% of residents speak Spanish at home (61% very well, 39% well).
0.3% of residents speak other Indo-European language at home (70% very well, 30% not at all).
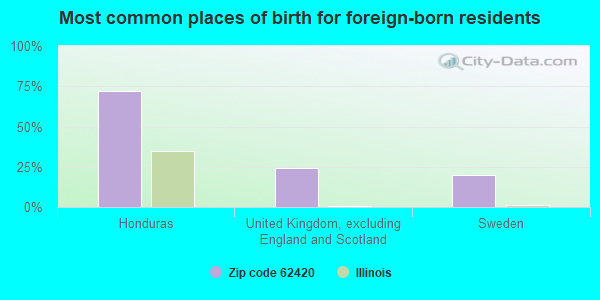
Foreign born population: 25 (0.6%) (100.0% of them are naturalized citizens)
This zip code:
0.6%
Whole state:
14.4%
72%Honduras
24%United Kingdom, excluding England and Scotland
20%Sweden
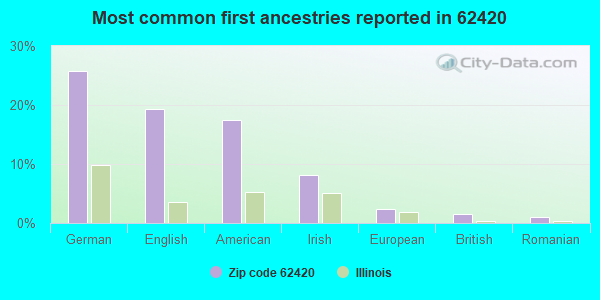
26%German
19%English
17%American
8%Irish
2%European
2%British
1%Romanian
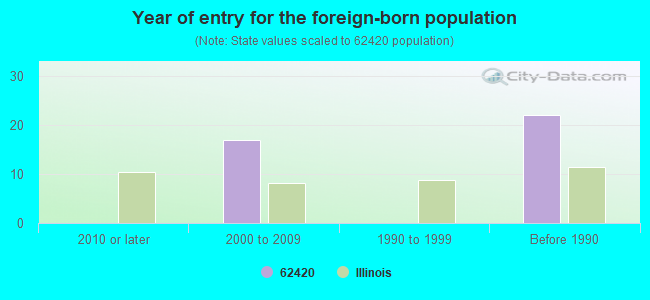
Year of entry for the foreign-born population
02010 or later
172000 to 2009
01990 to 1999
22Before 1990
Major facilities with environmental interests located in this zip code:
BOLIN ENTERPRISES INC (1614 E MAIN in CASEY, IL)
STATE MASTER (Illinois EPA Project) - HAZARDOUS WASTE PROGRAM National Pollutant Discharge Elimination System NON-MAJOR (Tracking pollutant discharge elimination systems) - permit Conditionally Exempt Small Quantity Generators, less than 100 kg/month of hazardous waste (Resource Conservation and Recovery Act (tracking hazardous waste)) Organizations: BOLIN ENTERPRISES, INC. (CONTACT/OWNER)
, BOLIN EVERT (CONTACT/OWNER)
PETTY CO INC (EAST ROUTE 40 in CASEY, IL)
STATE MASTER (Illinois EPA Project) - HAZARDOUS WASTE PROGRAM, AIR PROGRAM AIR MINOR (AIRS/AFS) Small Quantity Generators, between 100 kg and 1000 kg of hazardous waste/month (Resource Conservation and Recovery Act (tracking hazardous waste)) - notification Business SIC classification: COMMERCIAL PRINTING, LITHOGRAPHIC Organizations: WHALING GA (CONTACT/OWNER)
Alternative names: PETTY CO ILLINOIS INSERTS DIV
KWIK MIX CO (601 WEST MAIN ST in CASEY, IL)
STATE MASTER (Illinois EPA Project) - AIR PROGRAM AIR MINOR (AIRS/AFS) CRITERIA AND HAZARDOUS AIR POLLUTANT INVENTORY (Inventory of air pollution sources) Business SIC classification: READY-MIXED CONCRETE
MID-ILLINOIS QUARRY (R. R. 2 in CASEY, IL)
STATE MASTER (Illinois EPA Project) - AIR PROGRAM AIR MINOR (AIRS/AFS) CRITERIA AND HAZARDOUS AIR POLLUTANT INVENTORY (Inventory of air pollution sources) Business SIC and NAICS classification: CRUSHED AND BROKEN LIMESTONE Alternative names: VULCAN CONSTRUCTION MATERIALS,LP
MURPHY, LELAND (701 S.W. 3RD in CASEY, IL)
STATE MASTER (Illinois EPA Project) - National Pollutant Discharge Elimination System Permit National Pollutant Discharge Elimination System NON-MAJOR (Tracking pollutant discharge elimination systems) - permit Organizations: MURPHY?LELAND (CONTACT/OWNER)
Alternative names: MURPHY?LELAND, MURPHY?LELAND
CITY OF CASEY (201 S CENTRAL in CASEY, IL)
STATE MASTER (Illinois EPA Project) - AIR PROGRAM, SOLID WASTE PROGRAM AIR MINOR (AIRS/AFS) CRITERIA AND HAZARDOUS AIR POLLUTANT INVENTORY (Inventory of air pollution sources) Business SIC classification: ELECTRIC SERVICES
AMERICAN RESOURCES CO (511 W MAIN ST in CASEY, IL)
STATE MASTER (Illinois EPA Project) - AIR PROGRAM AIR MINOR (AIRS/AFS) Business SIC classification: CONVERTED PAPER AND PAPERBOARD PRODUCTS Alternative names: AMERICAN RESOURCES COMPANY WEST PLANT
ASTEC M PACK (CR 950 NORTH in CASEY, IL)
STATE MASTER (Illinois EPA Project) - AIR PROGRAM AIR MINOR (AIRS/AFS) Business SIC classification: ASPHALT PAVING MIXTURES AND BLOCKS
HARDWAY OIL CO (S.W. FOURTH & W. ALBANY in CASEY, IL)
STATE MASTER (Illinois EPA Project) - AIR PROGRAM AIR MINOR (AIRS/AFS) Business SIC classification: PETROLEUM BULK STATIONS AND TERMINALS
HUTTONS PARTS & SERVICE INC (10 NE 1ST ST in CASEY, IL)
STATE MASTER (Illinois EPA Project) - HAZARDOUS WASTE PROGRAM Small Quantity Generators, between 100 kg and 1000 kg of hazardous waste/month (Resource Conservation and Recovery Act (tracking hazardous waste)) - notification Organizations: HENSIEK DAVE (CONTACT/OWNER)
MANN BROTHERS INC (R.R. 2 in CASEY, IL)
STATE MASTER (Illinois EPA Project) - AIR PROGRAM AIR MINOR (AIRS/AFS) Business SIC classification: NONCLASSIFIABLE ESTABLISHMENTS
MARATHON PIPELINE CO (RURAL in CASEY, IL)
STATE MASTER (Illinois EPA Project) - AIR PROGRAM AIR MINOR (AIRS/AFS) Business SIC classification: REFINED PETROLEUM PIPELINES Alternative names: MARATHON PIPE LINE CO-CASEY STATION
BODYSHOP THE (6 SE 3RD ST in CASEY, IL)
STATE MASTER (Illinois EPA Project) - HAZARDOUS WASTE PROGRAM Small Quantity Generators, between 100 kg and 1000 kg of hazardous waste/month (Resource Conservation and Recovery Act (tracking hazardous waste)) - notification Organizations: WEIR JIM (CONTACT/OWNER)
Alternative names: TBW INC THE BODY SHOP
Housing units lacking complete plumbing facilities: 4.4% Housing units lacking complete kitchen facilities: 5.5%
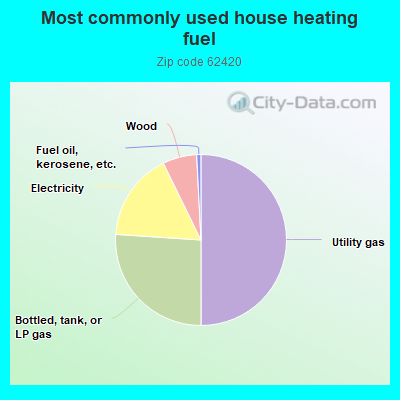
49.7%Utility gas
25.9%Bottled, tank, or LP gas
16.6%Electricity
6.4%Wood
0.8%Fuel oil, kerosene, etc.
Population in 1990: 5,300.
Place of birth for U.S.-born residents:
This state: 2,141
Northeast: 13
Midwest: 1,588
South: 188
West: 62
67% of the 62420 zip code residents lived in the same house 5 years ago. Out of people who lived in different houses, 40% lived in this county. Out of people who lived in different counties, 50% lived in Illinois.
90% of the 62420 zip code residents lived in the same house 1 year ago. Out of people who lived in different houses, 36% moved from this county. Out of people who lived in different houses, 66% moved from different county within same state. Out of people who lived in different houses, 1% moved from different state.
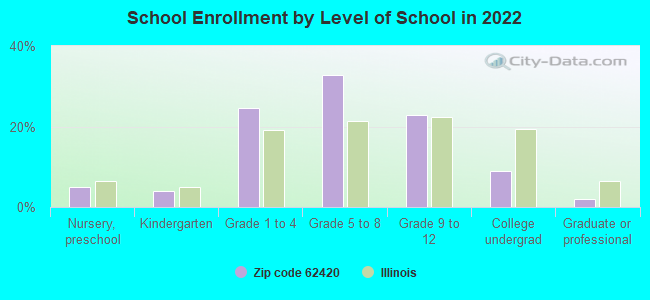
Private vs. public school enrollment:
Students in private schools in grades 1 to 8 (elementary and middle school): 68
Here:
15.1%
Illinois:
13.3%
Students in private schools in grades 9 to 12 (high school):
Here:
0.0%
Illinois:
9.9%
Students in private undergraduate colleges: 13
Here:
18.7%
Illinois:
27.4%
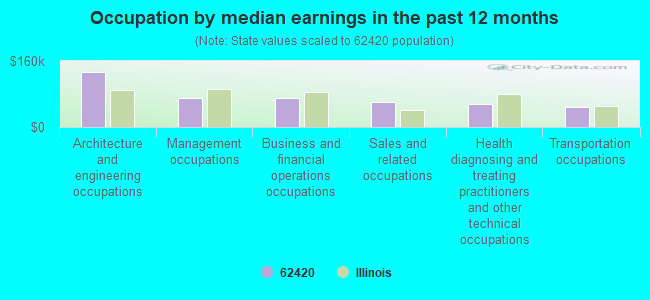
Occupation by median earnings in the past 12 months ($)
132,503Architecture and engineering occupations
70,717Management occupations
69,875Business and financial operations occupations
61,021Sales and related occupations
54,900Health diagnosing and treating practitioners and other technical occupations
49,065Transportation occupations
Top industries in this zip code by the number of employees in 2005:
Health Care and Social Assistance: Nursing Care Facilities (50-99: 1)
Other Services (except Public Administration): Religious Organizations (20-49: 1, 5-9: 1, 1-4: 5)
Wholesale Trade: Farm and Garden Machinery and Equipment Merchant Wholesalers (20-49: 1, 10-19: 1)
People in group quarters in 2010:
124 people in nursing facilities/skilled-nursing facilities
People in group quarters in 2000:
130 people in nursing homes
6 people in other noninstitutional group quarters
Fatal accident statistics in 2014:
Fatal accident count: 1
Vehicles involved in fatal accidents: 1
Fatal accidents caused by drunken drivers: 0
Fatalities: 1
Persons involved in fatal accidents: 2
Pedestrians involved in fatal accidents: 0
Fatal accident statistics in 2010:
Fatal accident count: 1
Vehicles involved in fatal accidents: 2
Fatal accidents caused by drunken drivers: 0
Fatalities: 1
Persons involved in fatal accidents: 3
Pedestrians involved in fatal accidents: 0
2002 - 2018 National Fire Incident Reporting System (NFIRS) incidents
According to the data from the years 2002 - 2018 the average number of fires per year is 16. The highest number of reported fire incidents - 24 took place in 2009, and the least - 6 in 2002. The data has a growing trend.
When looking into fire subcategories, the most incidents belonged to: Outside Fires (37.0%), and Structure Fires (35.2%).
Fire incident types reported to NFIRS in Zip Code 62420


 Nearest zip codes: 62474, 62428, 62442, 62481, 62432, 62413.


 According to the data from the years 2002 - 2018 the average number of fires per year is 16. The highest number of reported fire incidents - 24 took place in 2009, and the least - 6 in 2002. The data has a growing trend.
 When looking into fire subcategories, the most incidents belonged to: Outside Fires (37.0%), and Structure Fires (35.2%).