Estimated zip code population in 2022: 1,429 Zip code population in 2010: 1,599 Zip code population in 2000: 923
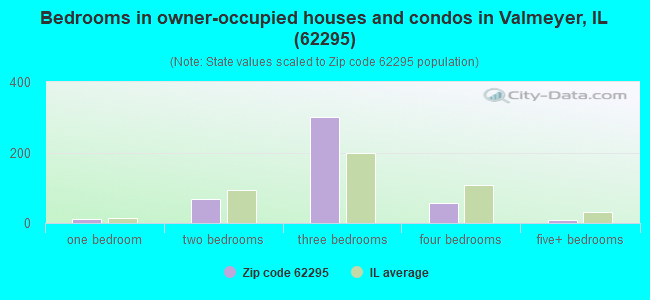
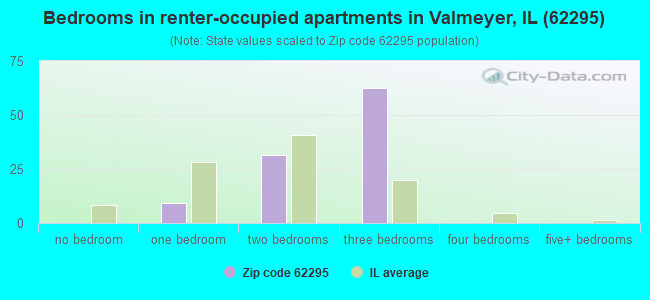
Houses and condos: 571 Renter-occupied apartments: 106
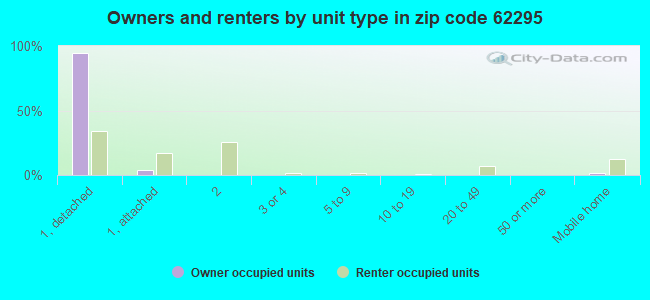
% of renters here:
19%
State:
33%
March 2022 cost of living index in zip code 62295: 95.3 (near average, U.S. average is 100)
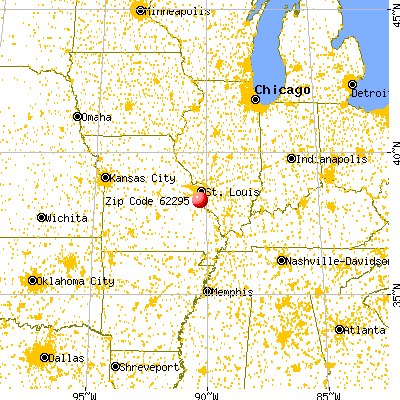
Land area: 68.0 sq. mi. Water area: 6.6 sq. mi.
Population density: 21 people per square mile
(very low).
OSM Map
General Map
Google Map
MSN Map
OSM Map
General Map
Google Map
MSN Map
OSM Map
General Map
Google Map
MSN Map
OSM Map
General Map
Google Map
MSN Map
Please wait while loading the map...
Real estate property taxes paid for housing units in 2022:
This zip code:
1.8% ($3,389)
Illinois:
2.0% ($4,912)
Median real estate property taxes paid for housing units with mortgages in 2022: $3,382 (1.7%) Median real estate property taxes paid for housing units with no mortgage in 2022: $3,264 (1.9%)
Business Search- 14 Million verified businesses
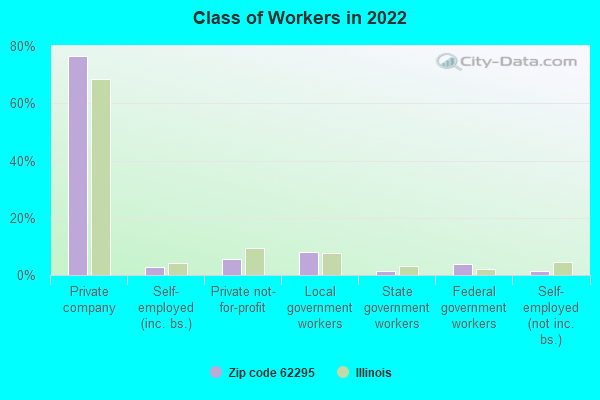
Males: 668
(46.8%)
Females: 760
(53.2%)
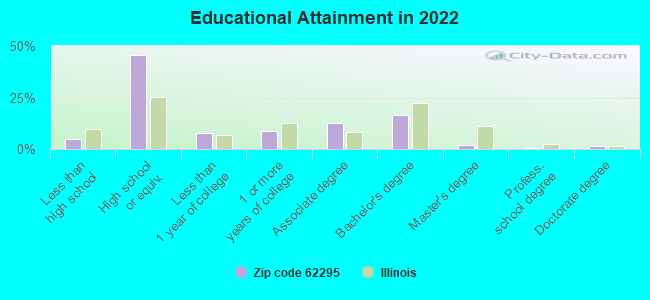
For population 25 years and over in 62295:
High school or higher: 94.3%
Bachelor's degree or higher: 20.1%
Graduate or professional degree: 3.6%
Unemployed: 1.5%
Mean travel time to work (commute): 29.6 minutes
For population 15 years and over in 62295:
Never married: 24.5%
Now married: 56.2%
Separated: 1.2%
Widowed: 7.2%
Divorced: 10.8%
Zip code 62295 compared to state average:
Unemployed percentage significantly below state average.
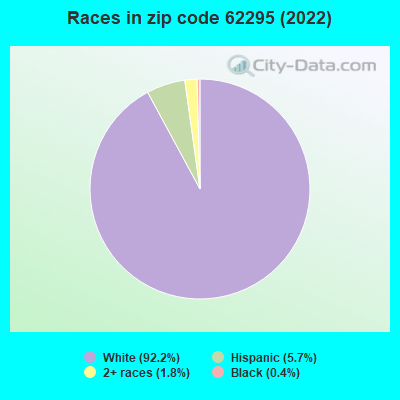
Black race population percentage significantly below state average.
Hispanic race population percentage significantly below state average.
Median age above state average.
Foreign-born population percentage significantly below state average.
Renting percentage below state average.
Length of stay since moving in significantly above state average.
House age significantly below state average.
Number of college students below state average.
Percentage of population with a bachelor's degree or higher below state average.
Estimated median house/condo value in 2022: $189,200
62295:
$189,200
Illinois:
$251,600
According to our research of Illinois and other state lists, there were 2 registered sex offenders living in 62295 zip code as of May 28, 2024. The ratio of all residents to sex offenders in zip code 62295 is 717 to 1. The ratio of registered sex offenders to all residents in this zip code is near the state average.
Median resident age:
This zip code:
44.8 years
Illinois median age:
39.1 years
Average household size:
This zip code:
2.6 people
Illinois:
2.4 people
Averages for the 2020 tax year for zip code 62295, filed in 2021:
Average Adjusted Gross Income (AGI) in 2020: $67,693 (Individual Income Tax Returns)
Here:
$67,693
State:
$82,626
Salary/wage: $61,898 (reported on 85.9% of returns)
Here:
$61,898
State:
$66,640
(% of AGI for various income ranges: 1138.5% for AGIs below $25k, 3671.0% for AGIs $25k-50k, 6973.8% for AGIs $50k-75k, 8591.7% for AGIs $75k-100k, 19884.5% for AGIs $100k-200k)
Taxable interest for individuals: $418 (reported on 39.4% of returns)
This zip code:
$418
Illinois:
$2,376
(% of AGI for various income ranges: 15.4% for AGIs below $25k, 18.0% for AGIs $25k-50k, 28.7% for AGIs $50k-75k, 21.7% for AGIs $75k-100k, 39.1% for AGIs $100k-200k)
Ordinary dividends: $1,500 (reported on 16.9% of returns)
Here:
$1,500
State:
$9,061
(% of AGI for various income ranges: 20.8% for AGIs below $25k, 43.0% for AGIs $25k-50k, 47.5% for AGIs $50k-75k, 65.5% for AGIs $100k-200k)
Net capital gain/loss in AGI: +$3,060 (reported on 14.1% of returns)
Here:
+$3,060
State:
+$31,684
(% of AGI for various income ranges: 40.8% for AGIs below $25k, 16.2% for AGIs $50k-75k, 218.2% for AGIs $100k-200k)
Profit/loss from business: +$5,878 (reported on 12.7% of returns)
Here:
+$5,878
State:
+$12,175
(% of AGI for various income ranges: 113.8% for AGIs below $25k, 26.0% for AGIs $25k-50k, 322.7% for AGIs $100k-200k)
Taxable individual retirement arrangement distribution: $11,860 (reported on 7.0% of returns)
62295:
$11,860
Illinois:
$21,613
(% of AGI for various income ranges: 160.0% for AGIs below $25k, 481.2% for AGIs $50k-75k)
Total itemized deductions: $16,500 (reported on 4.2% of returns)
Here:
$16,500
State:
$34,948
(% of AGI for various income ranges: 618.8% for AGIs $50k-75k)
Taxes paid: $7,850 (reported on 2.8% of returns)
62295:
$7,850
State:
$8,563
(% of AGI for various income ranges: 196.2% for AGIs $50k-75k)
Earned income credit: $1,820 (reported on 7.0% of returns)
Here:
$1,820
State:
$2,311
(% of AGI for various income ranges: 70.0% for AGIs below $25k)
Percentage of individuals using paid preparers for their 2020 taxes: 94.4%
Here:
94%
State:
93%
(% for various income ranges: 90.0% for AGIs below $25k, 100.0% for AGIs $25k-50k, 91.7% for AGIs $50k-75k, 100.0% for AGIs $75k-100k, 94.7% for AGIs $100k-200k)
Averages for the 2012 tax year for zip code 62295, filed in 2013:
Average Adjusted Gross Income (AGI) in 2012: $55,323 (Individual Income Tax Returns)
Here:
$55,323
State:
$68,058
Salary/wage: $49,826 (reported on 87.1% of returns)
Here:
$49,826
State:
$55,396
(% of AGI for various income ranges: 71.7% for AGIs below $25k, 76.8% for AGIs $25k-50k, 82.2% for AGIs $50k-75k, 84.9% for AGIs $75k-100k, 74.3% for AGIs $100k-200k)
Taxable interest for individuals: $811 (reported on 38.6% of returns)
This zip code:
$811
Illinois:
$1,969
(% of AGI for various income ranges: 1.6% for AGIs below $25k, 0.4% for AGIs $25k-50k, 0.4% for AGIs $50k-75k, 0.6% for AGIs $75k-100k, 0.5% for AGIs $100k-200k)
Ordinary dividends: $1,007 (reported on 21.4% of returns)
Here:
$1,007
State:
$7,786
(% of AGI for various income ranges: 2.2% for AGIs below $25k, 0.4% for AGIs $25k-50k, 0.2% for AGIs $50k-75k, 0.2% for AGIs $75k-100k, 0.3% for AGIs $100k-200k)
Profit/loss from business: +$7,722 (reported on 12.9% of returns)
Here:
+$7,722
State:
+$12,903
(% of AGI for various income ranges: 18.3% for AGIs below $25k, 1.8% for AGIs $50k-75k, 1.3% for AGIs $75k-100k)
Taxable individual retirement arrangement distribution: $8,100 (reported on 8.6% of returns)
62295:
$8,100
Illinois:
$17,929
Total itemized deductions: $16,869 (19% of AGI, reported on 37.1% of returns)
Here:
$16,869
State:
$26,433
Here:
19.5% of AGI
State:
19.2% of AGI
(% of AGI for various income ranges: 15.4% for AGIs $25k-50k, 10.4% for AGIs $50k-75k, 11.8% for AGIs $75k-100k, 11.8% for AGIs $100k-200k)
Charity contributions: $1,463 (reported on 27.1% of returns)
Here:
$1,463
State:
$4,525
(% of AGI for various income ranges: 1.0% for AGIs $25k-50k, 0.7% for AGIs $50k-75k, 0.8% for AGIs $75k-100k, 0.7% for AGIs $100k-200k)
Taxes paid: $7,058 (reported on 37.1% of returns)
62295:
$7,058
State:
$11,968
(% of AGI for various income ranges: 3.7% for AGIs $25k-50k, 3.9% for AGIs $50k-75k, 5.2% for AGIs $75k-100k, 6.1% for AGIs $100k-200k)
Earned income credit: $1,862 (reported on 11.4% of returns)
Here:
$1,862
State:
$2,349
(% of AGI for various income ranges: 4.0% for AGIs below $25k, 1.0% for AGIs $25k-50k)
Percentage of individuals using paid preparers for their 2012 taxes: 62.9%
Here:
63%
State:
57%
(% for various income ranges: 57.1% for AGIs below $25k, 66.7% for AGIs $25k-50k, 61.5% for AGIs $50k-75k, 60.0% for AGIs $75k-100k, 72.7% for AGIs $100k-200k)
Averages for the 2004 tax year for zip code 62295, filed in 2005:
Average Adjusted Gross Income (AGI) in 2004: $45,576 (Individual Income Tax Returns)
Here:
$45,576
State:
$54,625
Salary/wage: $42,662 (reported on 91.3% of returns)
Here:
$42,662
State:
$46,811
(% of AGI for various income ranges: 102.0% for AGIs below $10k, 80.8% for AGIs $10k-25k, 81.8% for AGIs $25k-50k, 89.0% for AGIs $50k-75k, 87.2% for AGIs $75k-100k, 79.9% for AGIs over 100k)
Taxable interest for individuals: $848 (reported on 46.5% of returns)
This zip code:
$848
Illinois:
$2,101
(% of AGI for various income ranges: 3.4% for AGIs below $10k, 0.6% for AGIs $10k-25k, 1.3% for AGIs $25k-50k, 1.1% for AGIs $50k-75k, 0.3% for AGIs $75k-100k, 0.5% for AGIs over 100k)
Taxable dividends: $797 (reported on 25.2% of returns)
Here:
$797
State:
$4,306
(% of AGI for various income ranges: 5.4% for AGIs below $10k, 0.9% for AGIs $10k-25k, 0.8% for AGIs $25k-50k, 0.3% for AGIs $50k-75k, 0.1% for AGIs $75k-100k, 0.2% for AGIs over 100k)
Net capital gain/loss: +$1,354 (reported on 15.8% of returns)
Here:
+$1,354
State:
+$17,321
(% of AGI for various income ranges: 1.2% for AGIs below $10k, 0.1% for AGIs $10k-25k, 0.3% for AGIs $25k-50k, 0.5% for AGIs $50k-75k, 0.8% for AGIs $75k-100k)
Profit/loss from business: +$2,800 (reported on 13.2% of returns)
Here:
+$2,800
State:
+$11,771
(% of AGI for various income ranges: 31.9% for AGIs below $10k, 1.1% for AGIs $25k-50k, 0.5% for AGIs $50k-75k, -0.3% for AGIs $75k-100k)
Profit/loss from farming: +$1,818 (reported on 3.6% of returns)
Here:
+$1,818
State:
+$2,327
Total itemized deductions: $13,810 (21% of AGI, reported on 37.3% of returns)
Here:
$13,810
State:
$20,239
Here:
20.7% of AGI
State:
19.5% of AGI
(% of AGI for various income ranges: 12.5% for AGIs $25k-50k, 10.1% for AGIs $50k-75k, 13.4% for AGIs $75k-100k, 13.9% for AGIs over 100k)
Charity contributions deductions: $1,361 (2% of AGI, reported on 27.4% of returns)
Here:
$1,361
State:
$3,719
Here:
2.0% of AGI
State:
3.4% of AGI
(% of AGI for various income ranges: 0.9% for AGIs $25k-50k, 0.6% for AGIs $50k-75k, 0.8% for AGIs $75k-100k, 1.7% for AGIs over 100k)
Total tax: $4,767 (reported on 83.7% of returns)
62295:
$4,767
State:
$9,882
(% of AGI for various income ranges: 2.2% for AGIs below $10k, 5.4% for AGIs $10k-25k, 7.6% for AGIs $25k-50k, 8.1% for AGIs $50k-75k, 9.8% for AGIs $75k-100k, 12.8% for AGIs over 100k)
Earned income credit: $1,425 (reported on 6.6% of returns)
Here:
$1,425
State:
$1,788
Percentage of individuals using paid preparers for their 2004 taxes: 67.7%
Here:
68%
State:
61%
(% for various income ranges: 60.4% for AGIs below $10k, 70.9% for AGIs $10k-25k, 70.3% for AGIs $25k-50k, 71.1% for AGIs $50k-75k, 61.6% for AGIs $75k-100k, 67.9% for AGIs over 100k)
Household received Food Stamps/SNAP in the past 12 months: 46 Household did not receive Food Stamps/SNAP in the past 12 months: 500
Women who had a birth in the past 12 months: 7 (7 now married, 0 unmarried) Women who did not have a birth in the past 12 months: 336 (161 now married, 174 unmarried)
Housing units in zip code 62295 with a mortgage: 314 (31 second mortgage, 24 both second mortgage and home equity loan) Median monthly owner costs for units with a mortgage: $1,460 Median monthly owner costs for units without a mortgage: $653
Residents with income below the poverty level in 2022:
This zip code:
3.2%
Whole state:
11.9%
Residents with income below 50% of the poverty level in 2022:
This zip code:
0.8%
Whole state:
5.7%
Median number of rooms in houses and condos:
Here:
6.3
State:
6.4
Median number of rooms in apartments:
Here:
5.0
State:
4.1
Notable locations in this zip code not listed on our city pages
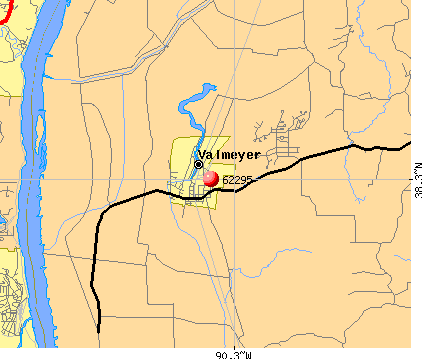
Notable locations in zip code 62295: Maeys (A), Leber Stock Farm (B), Kemper Landing (C), Harrisonville Landing (D), Valmeyer Fire Protection District (E). Display/hide their locations on the map
Size of family households: 170 2-persons, 112 3-persons, 103 4-persons, 22 5-persons
Size of nonfamily households: 115 1-person, 26 2-persons
202 married couples with children.
20 single-parent households (9 men, 11 women).
98.8% of residents of 62295 zip code speak English at home.
0.4% of residents speak Spanish at home (100% well).
0.1% of residents speak other Indo-European language at home (100% very well).
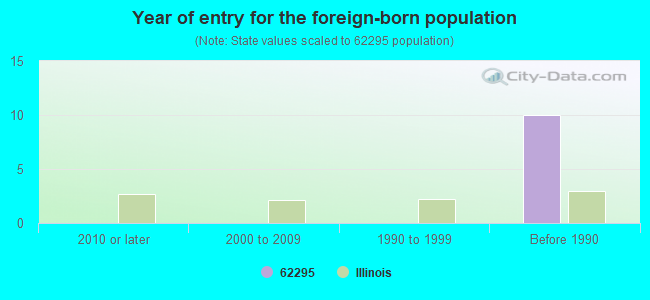
Foreign born population: 11 (0.8%) (100.0% of them are naturalized citizens)
This zip code:
0.8%
Whole state:
14.4%
45%Honduras
18%France
18%Germany
54%German
20%American
6%Irish
5%English
2%Polish
1%Dutch
1%Scottish
Year of entry for the foreign-born population
02010 or later
02000 to 2009
01990 to 1999
10Before 1990
Facilities with environmental interests located in this zip code:
MAR GRAPHICS (523 SOUTH MEYER AVENUE in VALMEYER, IL)
STATE MASTER (Illinois EPA Project) - HAZARDOUS WASTE PROGRAM, AIR PROGRAM AIR MINOR (AIRS/AFS) CRITERIA AND HAZARDOUS AIR POLLUTANT INVENTORY (Inventory of air pollution sources) Small Quantity Generators, between 100 kg and 1000 kg of hazardous waste/month (Resource Conservation and Recovery Act (tracking hazardous waste)) - notification Business SIC and NAICS classification: MANIFOLD BUSINESS FORMS Organizations: ROEVER RICHARD (CONTACT/OWNER)
AGRICO CHEMICAL CO (FULTZ RD in VALMEYER, IL)
STATE MASTER (Illinois EPA Project) - HAZARDOUS WASTE PROGRAM (Resource Conservation and Recovery Act (tracking hazardous waste))
COLUMBIA QUARRY COMPANY (800 QUARRY DR. in VALMEYER, IL)
STATE MASTER (Illinois EPA Project) - National Pollutant Discharge Elimination System Permit National Pollutant Discharge Elimination System NON-MAJOR (Tracking pollutant discharge elimination systems) - permit Alternative names: COLUMBIA QUARRY-VALMEYER
ROGER S REDI-MIX INC (S. MEYER AVE AND MAR CT in VALMEYER, IL)
STATE MASTER (Illinois EPA Project) - AIR PROGRAM AIR MINOR (AIRS/AFS) CRITERIA AND HAZARDOUS AIR POLLUTANT INVENTORY (Inventory of air pollution sources) Business SIC classification: READY-MIXED CONCRETE Business NAICS classification: READY-MIX CONCRETE MANUFACTURING. Alternative names: ROGER'S REDI-MIX, INC.-PLANT #9
COLUMBIA QUARRY CO (ILL ROUTE 156 in VALMEYER, IL)
STATE MASTER (Illinois EPA Project) - AIR PROGRAM AIR MINOR (AIRS/AFS) Business SIC classification: CRUSHED AND BROKEN LIMESTONE
GRACE W R & CO (HWY 156 NEAR WARNOCK in VALMEYER, IL)
(Resource Conservation and Recovery Act (tracking hazardous waste))
ILL BELL TEL CO VALMEYER (HARRISONVILLE TEL STA in VALMEYER, IL)
(Resource Conservation and Recovery Act (tracking hazardous waste)) Organizations: ILLINOIS BELL TELEPHONE CO (CONTACT/OWNER)
MONROE SERVICE CO (LAKE ST IN VALMEYER in VALMEYER, IL)
(Resource Conservation and Recovery Act (tracking hazardous waste)) Organizations: MONROE SERVICE COMPANY (CONTACT/OWNER)
MAR BUSINESS FARMS CO (1 MAR GRAPHICS DR in VALMEYER, IL)
(Resource Conservation and Recovery Act (tracking hazardous waste)) Organizations: ROEVER MYRON A (CONTACT/OWNER)
MONROE SERVICE CO FS (LAKE & MOREDOCK in VALMEYER, IL)
AIR MINOR (AIRS/AFS) Business SIC classification: NONCLASSIFIABLE ESTABLISHMENTS
Housing units lacking complete plumbing facilities: 2.3%
53.8%Utility gas
27.8%Electricity
17.0%Bottled, tank, or LP gas
1.7%Wood
Population in 1990: 1,841.
Place of birth for U.S.-born residents:
This state: 785
Northeast: 18
Midwest: 504
South: 86
West: 26
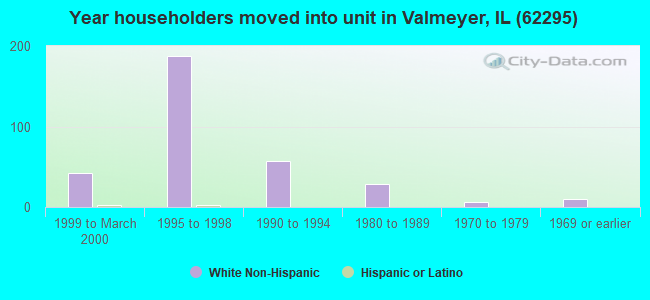
43% of the 62295 zip code residents lived in the same house 5 years ago. Out of people who lived in different houses, 61% lived in this county. Out of people who lived in different counties, 50% lived in Illinois.
96% of the 62295 zip code residents lived in the same house 1 year ago. Out of people who lived in different houses, 33% moved from this county. Out of people who lived in different houses, 28% moved from different county within same state. Out of people who lived in different houses, 33% moved from different state. Out of people who lived in different houses, 5% moved from abroad.
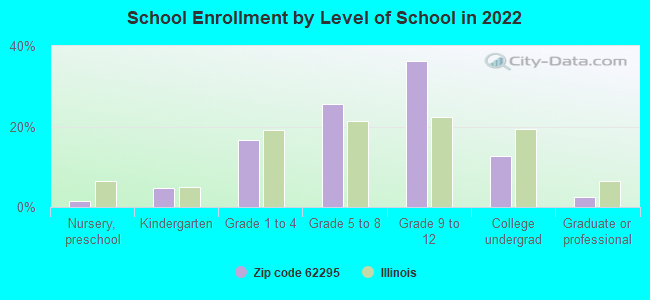
Private vs. public school enrollment:
Students in private schools in grades 1 to 8 (elementary and middle school): 25
Here:
23.7%
Illinois:
13.3%
Students in private schools in grades 9 to 12 (high school): 10
Here:
11.3%
Illinois:
9.9%
Students in private undergraduate colleges:
Here:
0.0%
Illinois:
27.4%
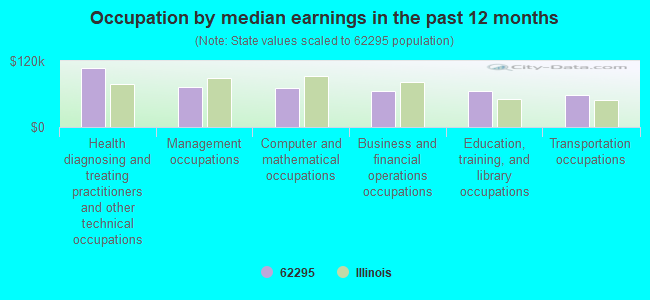
Occupation by median earnings in the past 12 months ($)
107,170Health diagnosing and treating practitioners and other technical occupations
72,204Management occupations
70,846Computer and mathematical occupations
66,259Business and financial operations occupations
64,784Education, training, and library occupations
58,964Transportation occupations
Top industries in this zip code by the number of employees in 2005:
Other Services (except Public Administration): Religious Organizations (5-9 employees: 1 establishment, 1-4 employees: 1 establishment)
Construction: Site Preparation Contractors (5-9: 1)
Real Estate and Rental and Leasing: Offices of Real Estate Agents and Brokers (1-4: 1)
Construction: Drywall and Insulation Contractors (1-4: 1)
Construction: Roofing Contractors (1-4: 1)
Educational Services: Sports and Recreation Instruction (1-4: 1)
Finance and Insurance: Commercial Banking (1-4: 1)
2002 - 2018 National Fire Incident Reporting System (NFIRS) incidents
According to the data from the years 2002 - 2018 the average number of fires per year is 9. The highest number of fire incidents - 27 took place in 2017, and the least - 0 in 2004. The data has a dropping trend.
When looking into fire subcategories, the most reports belonged to: Outside Fires (35.8%), and Other (25.2%).
Fire incident types reported to NFIRS in Zip Code 62295


 Nearest zip codes: 63048, 63019, 63053, 63057, 63070, 63012.
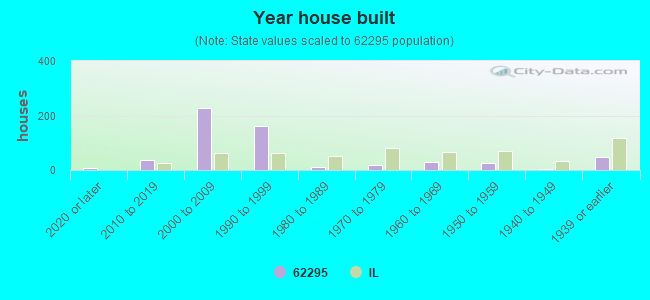


 According to the data from the years 2002 - 2018 the average number of fires per year is 9. The highest number of fire incidents - 27 took place in 2017, and the least - 0 in 2004. The data has a dropping trend.
 When looking into fire subcategories, the most reports belonged to: Outside Fires (35.8%), and Other (25.2%).