Estimated zip code population in 2022: 2,962 Zip code population in 2010: 3,621 Zip code population in 2000: 3,681
Houses and condos: 1,143 Renter-occupied apartments: 173
% of renters here:
16%
State:
33%
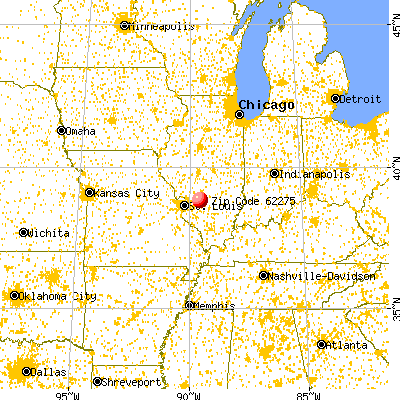
March 2022 cost of living index in zip code 62275: 85.3 (less than average, U.S. average is 100)
Land area: 101.8 sq. mi. Water area: 0.2 sq. mi.
Population density: 29 people per square mile
(very low).
OSM Map
General Map
Google Map
MSN Map
OSM Map
General Map
Google Map
MSN Map
OSM Map
General Map
Google Map
MSN Map
OSM Map
General Map
Google Map
MSN Map
Please wait while loading the map...
Real estate property taxes paid for housing units in 2022:
This zip code:
1.5% ($2,667)
Illinois:
2.0% ($4,912)
Median real estate property taxes paid for housing units with mortgages in 2022: $3,047 (1.4%) Median real estate property taxes paid for housing units with no mortgage in 2022: $2,145 (2.1%)
Business Search- 14 Million verified businesses
Males: 1,442
(48.7%)
Females: 1,520
(51.3%)
For population 25 years and over in 62275:
High school or higher: 91.7%
Bachelor's degree or higher: 19.1%
Graduate or professional degree: 7.8%
Unemployed: 1.7%
Mean travel time to work (commute): 27.8 minutes
For population 15 years and over in 62275:
Never married: 30.2%
Now married: 52.7%
Separated: 2.5%
Widowed: 6.9%
Divorced: 7.7%
Zip code 62275 compared to state average:
Unemployed percentage below state average.
Black race population percentage significantly below state average.
Hispanic race population percentage significantly below state average.
Foreign-born population percentage significantly below state average.
Renting percentage below state average.
Length of stay since moving in significantly above state average.
Percentage of population with a bachelor's degree or higher below state average.
Estimated median house/condo value in 2022: $174,784
62275:
$174,784
Illinois:
$251,600
According to our research of Illinois and other state lists, there were 5 registered sex offenders living in 62275 zip code as of May 26, 2024. The ratio of all residents to sex offenders in zip code 62275 is 720 to 1. The ratio of registered sex offenders to all residents in this zip code is near the state average.
Median resident age:
This zip code:
38.5 years
Illinois median age:
39.1 years
Average household size:
This zip code:
2.8 people
Illinois:
2.4 people
Averages for the 2020 tax year for zip code 62275, filed in 2021:
Average Adjusted Gross Income (AGI) in 2020: $64,964 (Individual Income Tax Returns)
Here:
$64,964
State:
$82,626
Salary/wage: $56,539 (reported on 82.5% of returns)
Here:
$56,539
State:
$66,640
(% of AGI for various income ranges: 1112.9% for AGIs below $25k, 3543.1% for AGIs $25k-50k, 6344.7% for AGIs $50k-75k, 8953.8% for AGIs $75k-100k, 15957.1% for AGIs $100k-200k)
Taxable interest for individuals: $1,366 (reported on 40.4% of returns)
This zip code:
$1,366
Illinois:
$2,376
(% of AGI for various income ranges: 26.8% for AGIs below $25k, 66.6% for AGIs $25k-50k, 54.7% for AGIs $50k-75k, 96.9% for AGIs $75k-100k, 107.1% for AGIs $100k-200k)
Ordinary dividends: $2,291 (reported on 20.5% of returns)
Here:
$2,291
State:
$9,061
(% of AGI for various income ranges: 12.9% for AGIs below $25k, 55.9% for AGIs $25k-50k, 48.2% for AGIs $50k-75k, 53.1% for AGIs $75k-100k, 161.0% for AGIs $100k-200k)
Net capital gain/loss in AGI: +$3,752 (reported on 17.5% of returns)
Here:
+$3,752
State:
+$31,684
(% of AGI for various income ranges: 14.4% for AGIs below $25k, 21.7% for AGIs $25k-50k, 61.8% for AGIs $50k-75k, 62.3% for AGIs $75k-100k, 288.1% for AGIs $100k-200k)
Profit/loss from business: +$9,396 (reported on 14.5% of returns)
Here:
+$9,396
State:
+$12,175
(% of AGI for various income ranges: 98.5% for AGIs below $25k, 164.8% for AGIs $25k-50k, 215.3% for AGIs $50k-75k, 316.9% for AGIs $75k-100k, 316.2% for AGIs $100k-200k)
Taxable individual retirement arrangement distribution: $12,347 (reported on 10.2% of returns)
62275:
$12,347
Illinois:
$21,613
(% of AGI for various income ranges: 59.4% for AGIs below $25k, 66.9% for AGIs $25k-50k, 182.4% for AGIs $50k-75k, 308.5% for AGIs $75k-100k, 472.4% for AGIs $100k-200k)
Total itemized deductions: $29,625 (reported on 2.4% of returns)
Here:
$29,625
State:
$34,948
(% of AGI for various income ranges: 150.3% for AGIs below $25k, 321.0% for AGIs $100k-200k)
Charity contributions: $7,667 (reported on 1.8% of returns)
Here:
$7,667
State:
$13,122
(% of AGI for various income ranges: 176.9% for AGIs $75k-100k)
Taxes paid: $7,850 (reported on 2.4% of returns)
62275:
$7,850
State:
$8,563
(% of AGI for various income ranges: 149.5% for AGIs $100k-200k)
Earned income credit: $1,778 (reported on 10.8% of returns)
Here:
$1,778
State:
$2,311
(% of AGI for various income ranges: 63.2% for AGIs below $25k, 36.2% for AGIs $25k-50k)
Percentage of individuals using paid preparers for their 2020 taxes: 95.2%
Here:
95%
State:
93%
(% for various income ranges: 93.6% for AGIs below $25k, 97.4% for AGIs $25k-50k, 95.7% for AGIs $50k-75k, 94.7% for AGIs $75k-100k, 94.1% for AGIs $100k-200k, 100.0% for AGIs over 200k)
Averages for the 2012 tax year for zip code 62275, filed in 2013:
Average Adjusted Gross Income (AGI) in 2012: $51,413 (Individual Income Tax Returns)
Here:
$51,413
State:
$68,058
Salary/wage: $45,591 (reported on 84.7% of returns)
Here:
$45,591
State:
$55,396
(% of AGI for various income ranges: 70.0% for AGIs below $25k, 75.9% for AGIs $25k-50k, 77.0% for AGIs $50k-75k, 79.5% for AGIs $75k-100k, 72.3% for AGIs $100k-200k)
Taxable interest for individuals: $1,150 (reported on 45.4% of returns)
This zip code:
$1,150
Illinois:
$1,969
(% of AGI for various income ranges: 1.5% for AGIs below $25k, 1.2% for AGIs $25k-50k, 0.9% for AGIs $50k-75k, 1.0% for AGIs $75k-100k, 0.9% for AGIs $100k-200k)
Ordinary dividends: $1,742 (reported on 20.2% of returns)
Here:
$1,742
State:
$7,786
(% of AGI for various income ranges: 0.5% for AGIs below $25k, 0.6% for AGIs $25k-50k, 0.4% for AGIs $50k-75k, 1.0% for AGIs $75k-100k, 0.7% for AGIs $100k-200k)
Net capital gain/loss in AGI: +$4,929 (reported on 14.7% of returns)
Here:
+$4,929
State:
+$22,183
(% of AGI for various income ranges: 0.2% for AGIs below $25k, 1.0% for AGIs $25k-50k, 1.3% for AGIs $50k-75k, 0.5% for AGIs $75k-100k, 2.5% for AGIs $100k-200k)
Profit/loss from business: +$4,025 (reported on 14.7% of returns)
Here:
+$4,025
State:
+$12,903
(% of AGI for various income ranges: 3.8% for AGIs below $25k, 3.3% for AGIs $25k-50k, 0.9% for AGIs $50k-75k, 0.5% for AGIs $75k-100k)
Taxable individual retirement arrangement distribution: $9,762 (reported on 9.8% of returns)
62275:
$9,762
Illinois:
$17,929
(% of AGI for various income ranges: 2.2% for AGIs below $25k, 2.1% for AGIs $25k-50k, 2.4% for AGIs $50k-75k, 1.9% for AGIs $75k-100k, 1.3% for AGIs $100k-200k)
Total itemized deductions: $18,238 (20% of AGI, reported on 28.8% of returns)
Here:
$18,238
State:
$26,433
Here:
20.0% of AGI
State:
19.2% of AGI
(% of AGI for various income ranges: 7.0% for AGIs below $25k, 8.3% for AGIs $25k-50k, 9.9% for AGIs $50k-75k, 12.1% for AGIs $75k-100k, 10.9% for AGIs $100k-200k)
Charity contributions: $2,564 (reported on 22.1% of returns)
Here:
$2,564
State:
$4,525
(% of AGI for various income ranges: 0.5% for AGIs below $25k, 0.8% for AGIs $25k-50k, 0.9% for AGIs $50k-75k, 1.2% for AGIs $75k-100k, 1.4% for AGIs $100k-200k)
Taxes paid: $7,387 (reported on 28.8% of returns)
62275:
$7,387
State:
$11,968
(% of AGI for various income ranges: 1.9% for AGIs below $25k, 2.2% for AGIs $25k-50k, 3.3% for AGIs $50k-75k, 4.6% for AGIs $75k-100k, 5.8% for AGIs $100k-200k)
Earned income credit: $2,118 (reported on 13.5% of returns)
Here:
$2,118
State:
$2,349
(% of AGI for various income ranges: 4.9% for AGIs below $25k, 0.8% for AGIs $25k-50k)
Percentage of individuals using paid preparers for their 2012 taxes: 70.6%
Here:
71%
State:
57%
(% for various income ranges: 63.9% for AGIs below $25k, 71.4% for AGIs $25k-50k, 77.8% for AGIs $50k-75k, 80.0% for AGIs $75k-100k, 70.0% for AGIs $100k-200k)
Averages for the 2004 tax year for zip code 62275, filed in 2005:
Average Adjusted Gross Income (AGI) in 2004: $40,553 (Individual Income Tax Returns)
Here:
$40,553
State:
$54,625
Salary/wage: $37,083 (reported on 86.4% of returns)
Here:
$37,083
State:
$46,811
(% of AGI for various income ranges: 118.6% for AGIs below $10k, 68.3% for AGIs $10k-25k, 81.0% for AGIs $25k-50k, 84.1% for AGIs $50k-75k, 86.0% for AGIs $75k-100k, 66.2% for AGIs over 100k)
Taxable interest for individuals: $1,459 (reported on 49.3% of returns)
This zip code:
$1,459
Illinois:
$2,101
(% of AGI for various income ranges: 5.6% for AGIs below $10k, 4.1% for AGIs $10k-25k, 1.6% for AGIs $25k-50k, 1.4% for AGIs $50k-75k, 0.8% for AGIs $75k-100k, 1.8% for AGIs over 100k)
Taxable dividends: $1,977 (reported on 25.1% of returns)
Here:
$1,977
State:
$4,306
(% of AGI for various income ranges: 2.0% for AGIs below $10k, 1.2% for AGIs $10k-25k, 0.5% for AGIs $25k-50k, 0.7% for AGIs $50k-75k, 0.4% for AGIs $75k-100k, 3.3% for AGIs over 100k)
Net capital gain/loss: +$3,901 (reported on 18.2% of returns)
Here:
+$3,901
State:
+$17,321
(% of AGI for various income ranges: -1.6% for AGIs below $10k, 0.9% for AGIs $10k-25k, 0.3% for AGIs $25k-50k, 0.9% for AGIs $50k-75k, 1.5% for AGIs $75k-100k, 5.2% for AGIs over 100k)
Profit/loss from business: +$5,514 (reported on 13.6% of returns)
Here:
+$5,514
State:
+$11,771
(% of AGI for various income ranges: 0.9% for AGIs below $10k, 4.8% for AGIs $10k-25k, 2.1% for AGIs $25k-50k, 2.3% for AGIs $50k-75k, 0.9% for AGIs $75k-100k, 0.4% for AGIs over 100k)
Profit/loss from farming: +$771 (reported on 6.2% of returns)
Here:
+$771
State:
+$2,327
(% of AGI for various income ranges: 1.1% for AGIs $10k-25k, -0.0% for AGIs $25k-50k, -0.7% for AGIs $50k-75k, 1.2% for AGIs $75k-100k)
IRA payment deduction: $3,413 (reported on 3.0% of returns)
62275:
$3,413
Illinois:
$3,087
Total itemized deductions: $14,639 (21% of AGI, reported on 25.3% of returns)
Here:
$14,639
State:
$20,239
Here:
20.8% of AGI
State:
19.5% of AGI
(% of AGI for various income ranges: 9.6% for AGIs $10k-25k, 7.3% for AGIs $25k-50k, 9.0% for AGIs $50k-75k, 10.6% for AGIs $75k-100k, 10.3% for AGIs over 100k)
Charity contributions deductions: $2,125 (3% of AGI, reported on 20.6% of returns)
Here:
$2,125
State:
$3,719
Here:
2.9% of AGI
State:
3.4% of AGI
(% of AGI for various income ranges: 1.0% for AGIs $10k-25k, 0.4% for AGIs $25k-50k, 1.0% for AGIs $50k-75k, 1.2% for AGIs $75k-100k, 1.8% for AGIs over 100k)
Total tax: $4,968 (reported on 77.3% of returns)
62275:
$4,968
State:
$9,882
(% of AGI for various income ranges: 4.5% for AGIs below $10k, 4.2% for AGIs $10k-25k, 6.8% for AGIs $25k-50k, 8.3% for AGIs $50k-75k, 10.0% for AGIs $75k-100k, 16.3% for AGIs over 100k)
Earned income credit: $1,574 (reported on 12.5% of returns)
Here:
$1,574
State:
$1,788
Percentage of individuals using paid preparers for their 2004 taxes: 70.1%
Here:
70%
State:
61%
(% for various income ranges: 58.7% for AGIs below $10k, 71.1% for AGIs $10k-25k, 73.5% for AGIs $25k-50k, 78.8% for AGIs $50k-75k, 65.2% for AGIs $75k-100k, 69.2% for AGIs over 100k)
Household received Food Stamps/SNAP in the past 12 months: 122 Household did not receive Food Stamps/SNAP in the past 12 months: 933
Women who had a birth in the past 12 months: 47 (28 now married, 18 unmarried) Women who did not have a birth in the past 12 months: 575 (257 now married, 317 unmarried)
Housing units in zip code 62275 with a mortgage: 509 (53 second mortgage, 6 home equity loan, 46 both second mortgage and home equity loan) Houses without a mortgage: 38
Median monthly owner costs for units with a mortgage: $1,392 Median monthly owner costs for units without a mortgage: $549
Residents with income below the poverty level in 2022:
This zip code:
6.3%
Whole state:
11.9%
Residents with income below 50% of the poverty level in 2022:
This zip code:
3.5%
Whole state:
5.7%
Median number of rooms in houses and condos:
Here:
6.3
State:
6.4
Median number of rooms in apartments:
Here:
5.1
State:
4.1
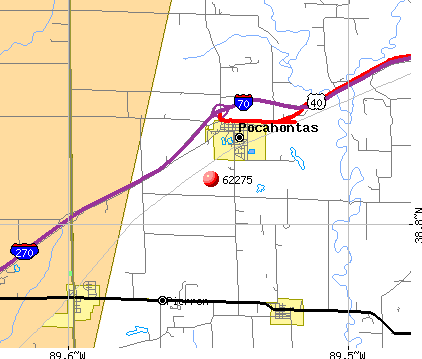
Notable locations in this zip code not listed on our city pages
Notable locations in zip code 62275: Doll's Orchard (A), Pocahontas - Old Ripley Fire Protection District Station 1 (B), Highland - Pierron Fire Protection District Station 1 (C), Pocahontas - Old Ripley Fire Protection District Station 2 (D). Display/hide their locations on the map
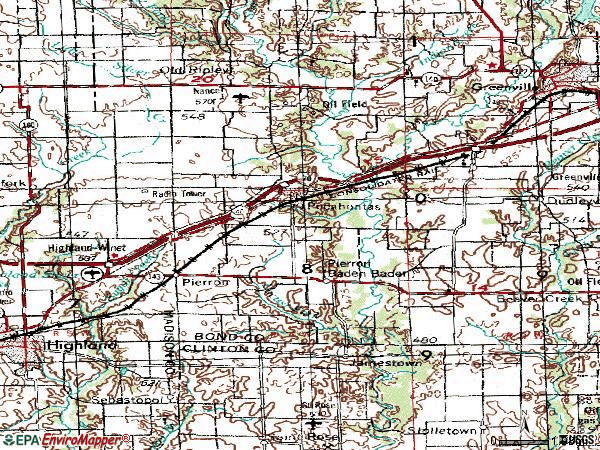
Cemeteries: Brown Cemetery (1), Calvary Cemetery (2), Hug Cemetery (3), Jamestown Cemetery (4), File Cemetery (5), Saint Nicholas Cemetery (6), Burgess Cemetery (7). Display/hide their locations on the map
Size of family households: 286 2-persons, 152 3-persons, 159 4-persons, 73 5-persons, 50 6-persons, 3 7-or-more-persons
Size of nonfamily households: 273 1-person, 49 2-persons, 6 3-persons
527 married couples with children.
63 single-parent households (31 men, 32 women).
97.7% of residents of 62275 zip code speak English at home.
1.5% of residents speak Spanish at home (100% very well).
Foreign born population: 26 (0.9%) (0.0% of them are naturalized citizens)
:
0.9%
Whole state:
14.4%
93%Honduras
53%German
13%American
8%English
7%Irish
3%Italian
2%French
2%Polish
Year of entry for the foreign-born population
02010 or later
232000 to 2009
01990 to 1999
0Before 1990
Facilities with environmental interests located in this zip code:
POCAHONTAS (PO BOX 275 in POCAHONTAS, IL)
STATE MASTER (Illinois EPA Project) - DRINKING WATER PROGRAM STATE MASTER (Illinois EPA Project) - National Pollutant Discharge Elimination System Permit National Pollutant Discharge Elimination System NON-MAJOR (Tracking pollutant discharge elimination systems) - permit Business SIC classification: SEWERAGE SYSTEMS Alternative names: POCAHONTAS STP, POCAHONTAS STP, VILLAGE OF
POCAHONTAS CENTER (PO BOX 189 in POCAHONTAS, IL)
(Geographic Names Information System) (National Center for Education Statistics) - STATE ID-0300300202004 Organizations: BOND CO C U SCHOOL DIST 2 (SCHOOL DISTRICT)
IDOT (BRG 0030016 in POCAHONTAS, IL)
(Resource Conservation and Recovery Act (tracking hazardous waste))
JONES?JAMES D. (RT 140 W TO OLD RIPLEY TO 3RD, in POCAHONTAS, IL)
National Pollutant Discharge Elimination System NON-MAJOR (Tracking pollutant discharge elimination systems) - permit Alternative names: JONES, JAMES D.
IDOT (BRG 0030043 in POCAHONTAS, IL)
Small Quantity Generators, between 100 kg and 1000 kg of hazardous waste/month (Resource Conservation and Recovery Act (tracking hazardous waste))
ILDOT BRG 003 0043 (TR 112 OVER FAI RTE 70 in POCAHONTAS, IL)
Small Quantity Generators, between 100 kg and 1000 kg of hazardous waste/month (Resource Conservation and Recovery Act (tracking hazardous waste)) - notification
ILDOT BRG 003 0020 (US RTE 40 OVER SHOAL CREEK in POCAHONTAS, IL)
Small Quantity Generators, between 100 kg and 1000 kg of hazardous waste/month (Resource Conservation and Recovery Act (tracking hazardous waste)) - notification
ILDOT BRG 003 0034 (IL RTE 143 OVER SHOAL CREEK in POCAHONTAS, IL)
Small Quantity Generators, between 100 kg and 1000 kg of hazardous waste/month (Resource Conservation and Recovery Act (tracking hazardous waste)) - notification
Housing units lacking complete plumbing facilities: 3.1% Housing units lacking complete kitchen facilities: 3.5%
42.5%Bottled, tank, or LP gas
41.0%Utility gas
14.0%Electricity
1.1%Fuel oil, kerosene, etc.
1.0%No fuel used
0.7%Wood
Population in 1990: 3,279. Population change in the 1990s: +402 (+12.3%).
Place of birth for U.S.-born residents:
This state: 2,249
Northeast: 6
Midwest: 419
South: 142
West: 111
66% of the 62275 zip code residents lived in the same house 5 years ago. Out of people who lived in different houses, 46% lived in this county. Out of people who lived in different counties, 50% lived in Illinois.
93% of the 62275 zip code residents lived in the same house 1 year ago. Out of people who lived in different houses, 24% moved from this county. Out of people who lived in different houses, 68% moved from different county within same state. Out of people who lived in different houses, 10% moved from different state. Out of people who lived in different houses, 2% moved from abroad.
Private vs. public school enrollment:
Students in private schools in grades 1 to 8 (elementary and middle school): 31
Here:
9.7%
Illinois:
13.3%
Students in private schools in grades 9 to 12 (high school): 22
Here:
16.3%
Illinois:
9.9%
Students in private undergraduate colleges: 14
Here:
6.7%
Illinois:
27.4%
Occupation by median earnings in the past 12 months ($)
112,289Business and financial operations occupations
109,799Health diagnosing and treating practitioners and other technical occupations
80,520Architecture and engineering occupations
71,375Computer and mathematical occupations
57,251Construction and extraction occupations
47,982Installation, maintenance, and repair occupations
Companies with federal contracts located in this zip code:
OLAM MACHINERY INC (16830 BAUMANN RD in POCAHONTAS, IL; small business)
$26,800 with Army for Miscellaneous Special Industry Machinery. Signed on 2006-03-28. Completion date: 2006-06-03.
Top industries in this zip code by the number of employees in 2005:
Accommodation and Food Services: Full-Service Restaurants (10-19: 1, 1-4: 1)
Construction: Poured Concrete Foundation and Structure Contractors (10-19: 1, 1-4: 1)
Administrative and Support and Waste Management and Remediation Services: Remediation Services (10-19: 1)
Other Services (except Public Administration): Automotive Oil Change and Lubrication Shops (10-19: 1)
Health Care and Social Assistance: Offices of Physicians (except Mental Health Specialists) (10-19: 1)
Construction: New Single-Family Housing Construction (except Operative Builders) (5-9: 1, 1-4: 2)
Fatal accident statistics in 2013:
Fatal accident count: 1
Vehicles involved in fatal accidents: 1
Fatal accidents caused by drunken drivers: 1
Fatalities: 1
Persons involved in fatal accidents: 3
Pedestrians involved in fatal accidents: 0
Fatal accident statistics in 2012:
Fatal accident count: 1
Vehicles involved in fatal accidents: 1
Fatal accidents caused by drunken drivers: 0
Fatalities: 1
Persons involved in fatal accidents: 1
Pedestrians involved in fatal accidents: 0
2002 - 2018 National Fire Incident Reporting System (NFIRS) incidents
Based on the data from the years 2002 - 2018 the average number of fires per year is 22. The highest number of fires - 34 took place in 2017, and the least - 14 in 2016. The data has an increasing trend.
When looking into fire subcategories, the most reports belonged to: Outside Fires (39.4%), and Structure Fires (29.5%).
Fire incident types reported to NFIRS in Zip Code 62275


 Nearest zip codes: 62273, 62249, 62246, 62086, 62230, 62216.


 Based on the data from the years 2002 - 2018 the average number of fires per year is 22. The highest number of fires - 34 took place in 2017, and the least - 14 in 2016. The data has an increasing trend.
 When looking into fire subcategories, the most reports belonged to: Outside Fires (39.4%), and Structure Fires (29.5%).