Estimated zip code population in 2022: 2,511 Zip code population in 2010: 3,109 Zip code population in 2000: 3,282
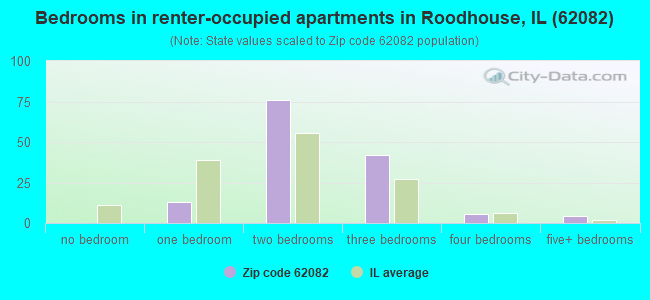
Houses and condos: 1,337 Renter-occupied apartments: 142
% of renters here:
14%
State:
33%
March 2022 cost of living index in zip code 62082: 73.5 (low, U.S. average is 100)
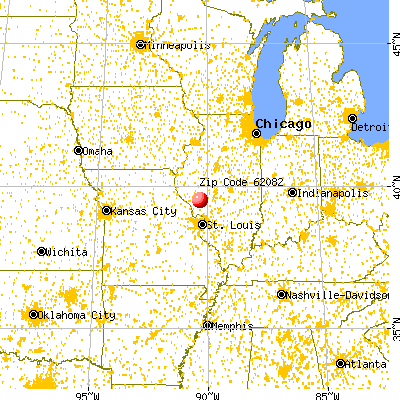
Land area: 108.7 sq. mi. Water area: 0.1 sq. mi.
Population density: 23 people per square mile
(very low).
OSM Map
General Map
Google Map
MSN Map
OSM Map
General Map
Google Map
MSN Map
OSM Map
General Map
Google Map
MSN Map
OSM Map
General Map
Google Map
MSN Map
Please wait while loading the map...
Real estate property taxes paid for housing units in 2022:
This zip code:
1.5% ($1,212)
Illinois:
2.0% ($4,912)
Median real estate property taxes paid for housing units with mortgages in 2022: $1,396 (1.5%) Median real estate property taxes paid for housing units with no mortgage in 2022: $1,177 (1.6%)
Business Search- 14 Million verified businesses
Males: 1,450
(57.7%)
Females: 1,061
(42.3%)
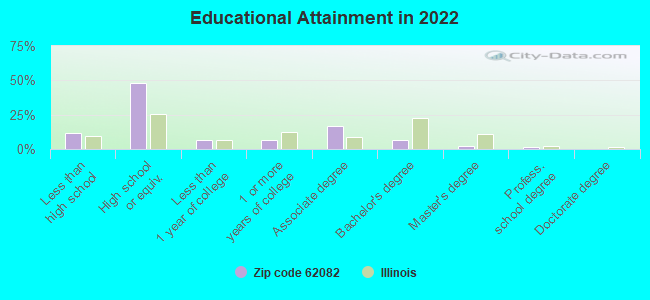
For population 25 years and over in 62082:
High school or higher: 87.1%
Bachelor's degree or higher: 10.2%
Graduate or professional degree: 4.0%
Unemployed: 5.2%
Mean travel time to work (commute): 29.6 minutes
For population 15 years and over in 62082:
Never married: 23.0%
Now married: 53.3%
Separated: 2.6%
Widowed: 8.4%
Divorced: 12.8%
Zip code 62082 compared to state average:
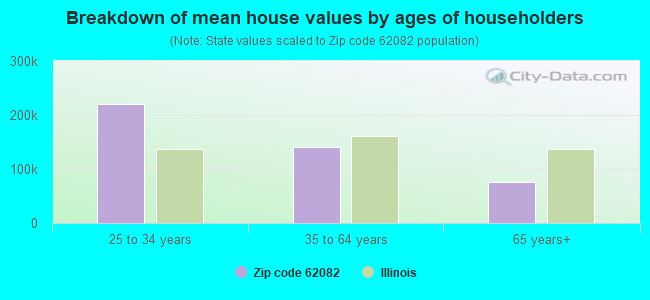
Median house value significantly below state average.
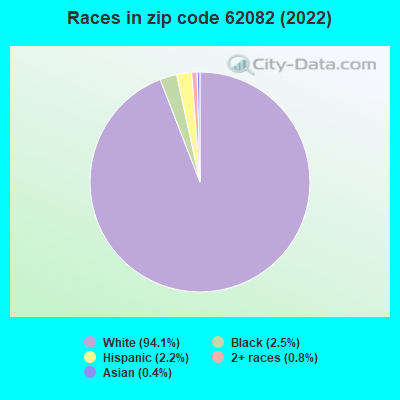
Black race population percentage significantly below state average.
Hispanic race population percentage significantly below state average.
Median age significantly above state average.
Foreign-born population percentage significantly below state average.
Renting percentage significantly below state average.
Length of stay since moving in significantly above state average.
Number of college students below state average.
Percentage of population with a bachelor's degree or higher significantly below state average.
Averages for the 2020 tax year for zip code 62082, filed in 2021:
Average Adjusted Gross Income (AGI) in 2020: $49,523 (Individual Income Tax Returns)
Here:
$49,523
State:
$82,626
Salary/wage: $42,518 (reported on 78.6% of returns)
Here:
$42,518
State:
$66,640
(% of AGI for various income ranges: 1042.6% for AGIs below $25k, 3324.6% for AGIs $25k-50k, 6512.5% for AGIs $50k-75k, 8322.9% for AGIs $75k-100k, 14873.8% for AGIs $100k-200k)
Taxable interest for individuals: $907 (reported on 26.8% of returns)
This zip code:
$907
Illinois:
$2,376
(% of AGI for various income ranges: 17.7% for AGIs below $25k, 20.4% for AGIs $25k-50k, 31.7% for AGIs $50k-75k, 94.3% for AGIs $75k-100k, 75.0% for AGIs $100k-200k)
Ordinary dividends: $2,777 (reported on 11.6% of returns)
Here:
$2,777
State:
$9,061
(% of AGI for various income ranges: 28.4% for AGIs below $25k, 85.0% for AGIs $50k-75k, 213.8% for AGIs $100k-200k)
Net capital gain/loss in AGI: +$4,754 (reported on 11.6% of returns)
Here:
+$4,754
State:
+$31,684
(% of AGI for various income ranges: 3.2% for AGIs below $25k, 48.1% for AGIs $25k-50k, 170.0% for AGIs $50k-75k, 348.8% for AGIs $100k-200k)
Profit/loss from business: +$8,292 (reported on 11.6% of returns)
Here:
+$8,292
State:
+$12,175
(% of AGI for various income ranges: 84.8% for AGIs below $25k, 113.5% for AGIs $25k-50k, 260.8% for AGIs $50k-75k, 295.7% for AGIs $75k-100k)
Taxable individual retirement arrangement distribution: $16,689 (reported on 8.0% of returns)
62082:
$16,689
Illinois:
$21,613
(% of AGI for various income ranges: 53.9% for AGIs below $25k, 159.2% for AGIs $25k-50k, 1315.7% for AGIs $75k-100k)
Earned income credit: $2,352 (reported on 20.5% of returns)
Here:
$2,352
State:
$2,311
(% of AGI for various income ranges: 113.2% for AGIs below $25k, 73.1% for AGIs $25k-50k)
Percentage of individuals using paid preparers for their 2020 taxes: 95.5%
Here:
96%
State:
93%
(% for various income ranges: 97.5% for AGIs below $25k, 96.8% for AGIs $25k-50k, 94.4% for AGIs $50k-75k, 90.0% for AGIs $75k-100k, 92.3% for AGIs $100k-200k)
Averages for the 2012 tax year for zip code 62082, filed in 2013:
Average Adjusted Gross Income (AGI) in 2012: $39,616 (Individual Income Tax Returns)
Here:
$39,616
State:
$68,058
Salary/wage: $32,962 (reported on 81.0% of returns)
Here:
$32,962
State:
$55,396
(% of AGI for various income ranges: 67.7% for AGIs below $25k, 74.9% for AGIs $25k-50k, 77.9% for AGIs $50k-75k, 68.3% for AGIs $75k-100k, 48.2% for AGIs $100k-200k)
Taxable interest for individuals: $985 (reported on 32.2% of returns)
This zip code:
$985
Illinois:
$1,969
(% of AGI for various income ranges: 1.0% for AGIs below $25k, 0.9% for AGIs $25k-50k, 0.2% for AGIs $50k-75k, 1.2% for AGIs $75k-100k, 0.9% for AGIs $100k-200k)
Ordinary dividends: $1,453 (reported on 12.4% of returns)
Here:
$1,453
State:
$7,786
(% of AGI for various income ranges: 0.7% for AGIs below $25k, 0.7% for AGIs $25k-50k, 0.7% for AGIs $50k-75k)
Net capital gain/loss in AGI: +$4,018 (reported on 9.1% of returns)
Here:
+$4,018
State:
+$22,183
(% of AGI for various income ranges: 0.3% for AGIs below $25k, 0.2% for AGIs $25k-50k, 2.5% for AGIs $50k-75k, 1.3% for AGIs $100k-200k)
Profit/loss from business: +$9,518 (reported on 14.0% of returns)
Here:
+$9,518
State:
+$12,903
(% of AGI for various income ranges: 8.9% for AGIs below $25k, 4.5% for AGIs $25k-50k, 5.5% for AGIs $75k-100k)
Taxable individual retirement arrangement distribution: $6,838 (reported on 6.6% of returns)
62082:
$6,838
Illinois:
$17,929
(% of AGI for various income ranges: 1.6% for AGIs below $25k, 1.3% for AGIs $25k-50k, 2.7% for AGIs $50k-75k)
Total itemized deductions: $17,177 (22% of AGI, reported on 10.7% of returns)
Here:
$17,177
State:
$26,433
Here:
22.1% of AGI
State:
19.2% of AGI
(% of AGI for various income ranges: 6.3% for AGIs $25k-50k, 4.1% for AGIs $50k-75k, 4.5% for AGIs $75k-100k, 6.7% for AGIs $100k-200k)
Charity contributions: $3,143 (reported on 5.8% of returns)
Here:
$3,143
State:
$4,525
Taxes paid: $5,262 (reported on 10.7% of returns)
62082:
$5,262
State:
$11,968
(% of AGI for various income ranges: 1.0% for AGIs $25k-50k, 1.3% for AGIs $50k-75k, 1.6% for AGIs $75k-100k, 2.9% for AGIs $100k-200k)
Earned income credit: $2,187 (reported on 24.8% of returns)
Here:
$2,187
State:
$2,349
(% of AGI for various income ranges: 6.9% for AGIs below $25k, 1.4% for AGIs $25k-50k)
Percentage of individuals using paid preparers for their 2012 taxes: 71.9%
Here:
72%
State:
57%
(% for various income ranges: 67.3% for AGIs below $25k, 72.7% for AGIs $25k-50k, 81.2% for AGIs $50k-75k, 70.0% for AGIs $75k-100k, 85.7% for AGIs $100k-200k)
Averages for the 2004 tax year for zip code 62082, filed in 2005:
Average Adjusted Gross Income (AGI) in 2004: $29,987 (Individual Income Tax Returns)
Here:
$29,987
State:
$54,625
Salary/wage: $27,617 (reported on 83.1% of returns)
Here:
$27,617
State:
$46,811
(% of AGI for various income ranges: 106.7% for AGIs below $10k, 79.0% for AGIs $10k-25k, 76.8% for AGIs $25k-50k, 82.5% for AGIs $50k-75k, 78.5% for AGIs $75k-100k, 41.5% for AGIs over 100k)
Taxable interest for individuals: $1,285 (reported on 35.6% of returns)
This zip code:
$1,285
Illinois:
$2,101
(% of AGI for various income ranges: 6.3% for AGIs below $10k, 2.0% for AGIs $10k-25k, 2.0% for AGIs $25k-50k, 0.6% for AGIs $50k-75k, 0.8% for AGIs $75k-100k, 0.9% for AGIs over 100k)
Taxable dividends: $749 (reported on 14.2% of returns)
Here:
$749
State:
$4,306
(% of AGI for various income ranges: 1.4% for AGIs below $10k, 0.4% for AGIs $10k-25k, 0.3% for AGIs $25k-50k, 0.2% for AGIs $50k-75k, 0.4% for AGIs $75k-100k, 0.4% for AGIs over 100k)
Net capital gain/loss: +$1,819 (reported on 11.3% of returns)
Here:
+$1,819
State:
+$17,321
(% of AGI for various income ranges: -2.3% for AGIs below $10k, 0.3% for AGIs $10k-25k, 0.2% for AGIs $25k-50k, 1.1% for AGIs $50k-75k, 0.3% for AGIs $75k-100k, 3.7% for AGIs over 100k)
Profit/loss from business: +$9,505 (reported on 14.4% of returns)
Here:
+$9,505
State:
+$11,771
(% of AGI for various income ranges: -1.2% for AGIs below $10k, 4.1% for AGIs $10k-25k, 4.1% for AGIs $25k-50k, 4.1% for AGIs $50k-75k, 17.0% for AGIs over 100k)
Total itemized deductions: $13,030 (24% of AGI, reported on 10.1% of returns)
Here:
$13,030
State:
$20,239
Here:
23.8% of AGI
State:
19.5% of AGI
(% of AGI for various income ranges: 4.8% for AGIs $10k-25k, 3.7% for AGIs $25k-50k, 4.7% for AGIs $50k-75k, 5.8% for AGIs $75k-100k, 5.1% for AGIs over 100k)
Charity contributions deductions: $2,114 (4% of AGI, reported on 6.7% of returns)
Here:
$2,114
State:
$3,719
Here:
3.5% of AGI
State:
3.4% of AGI
(% of AGI for various income ranges: 1.4% for AGIs below $10k, 0.5% for AGIs $25k-50k, 0.2% for AGIs $50k-75k, 1.1% for AGIs $75k-100k, 0.8% for AGIs over 100k)
Total tax: $3,506 (reported on 69.0% of returns)
62082:
$3,506
State:
$9,882
(% of AGI for various income ranges: 2.6% for AGIs below $10k, 3.7% for AGIs $10k-25k, 6.9% for AGIs $25k-50k, 8.0% for AGIs $50k-75k, 11.6% for AGIs $75k-100k, 17.6% for AGIs over 100k)
Earned income credit: $1,582 (reported on 20.7% of returns)
Here:
$1,582
State:
$1,788
Percentage of individuals using paid preparers for their 2004 taxes: 68.6%
Here:
69%
State:
61%
(% for various income ranges: 56.6% for AGIs below $10k, 72.9% for AGIs $10k-25k, 72.4% for AGIs $25k-50k, 70.7% for AGIs $50k-75k, 70.7% for AGIs $75k-100k, 85.2% for AGIs over 100k)
Likely homosexual households (counted as self-reported same-sex unmarried-partner households)
Lesbian couples: 0.0% of all households
Gay men: 0.3% of all households
Household received Food Stamps/SNAP in the past 12 months: 173 Household did not receive Food Stamps/SNAP in the past 12 months: 853
Women who had a birth in the past 12 months: 21 (21 now married, 0 unmarried) Women who did not have a birth in the past 12 months: 301 (143 now married, 156 unmarried)
Housing units in zip code 62082 with a mortgage: 322 (18 second mortgage, 1 home equity loan, 16 both second mortgage and home equity loan) Median monthly owner costs for units with a mortgage: $869 Median monthly owner costs for units without a mortgage: $459
Residents with income below the poverty level in 2022:
This zip code:
22.4%
Whole state:
11.9%
Residents with income below 50% of the poverty level in 2022:
This zip code:
9.9%
Whole state:
5.7%
Median number of rooms in houses and condos:
Here:
5.8
State:
6.4
Median number of rooms in apartments:
Here:
4.8
State:
4.1
Notable locations in this zip code not listed on our city pages
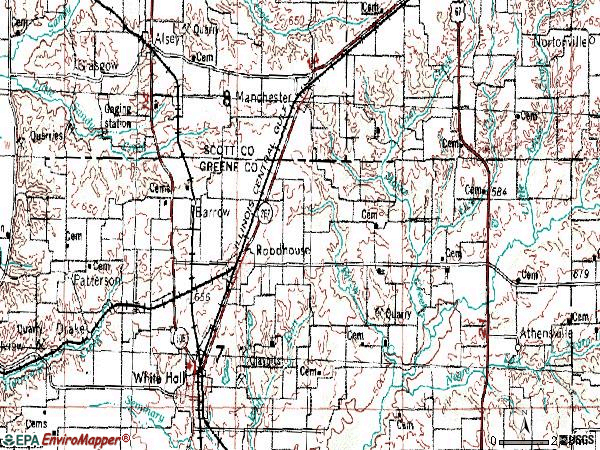
Notable locations in zip code 62082: West Roodhouse (A), Harmony Hills Campground (B), Roodhouse Fire Department (C). Display/hide their locations on the map
Churches in zip code 62082 include: Emmanuel Baptist Church (A), First Baptist Church (B), Roodhouse Christian Church (C), Pleasant Hill Church (D), Oak Grove Church (E), Richwoods Church (F), Martins Prairie Church (G). Display/hide their locations on the map
Cemeteries: Jewitt Cemetery (1), Smith Cemetery (2), Thompson Cemetery (3), Williams-Edwards Cemetery (4), Wilson Cemetery (5), Williams-Edwards Cemetery (6), Ceres Cemetery (7). Display/hide their locations on the map
Streams, rivers, and creeks: Coal Creek (A), Marks Creek (B), Little Apple Creek (C), Lick Creek (D), Lands Branch (E), Turkey Creek (F), Fox Branch (G). Display/hide their locations on the map
In group quarters: 118 (-1 institutionalized population)
Size of family households: 433 2-persons, 114 3-persons, 113 4-persons, 29 5-persons, 2 6-persons
Size of nonfamily households: 296 1-person, 32 2-persons, 3 3-persons
208 married couples with children.
110 single-parent households (35 men, 75 women).
98.3% of residents of 62082 zip code speak English at home.
0.7% of residents speak Spanish at home (100% very well).
0.3% of residents speak other Indo-European language at home (100% very well).
0.4% of residents speak Asian or Pacific Island language at home (100% not well).
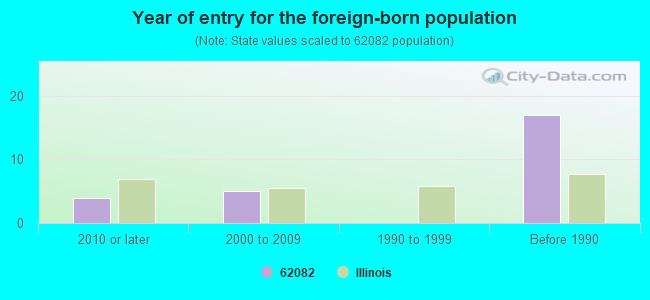
Foreign born population: 14 (0.6%) (100.0% of them are naturalized citizens)
This zip code:
0.6%
Whole state:
14.4%
64%Japan
14%Bosnia and Herzegovina
7%Brazil
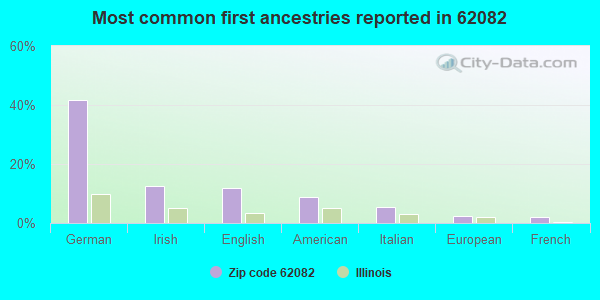
42%German
13%Irish
12%English
9%American
5%Italian
2%European
2%French
Year of entry for the foreign-born population
42010 or later
52000 to 2009
01990 to 1999
17Before 1990
Facilities with environmental interests located in this zip code:
ROODHOUSE (119 WEST PALM STREET in ROODHOUSE, IL)
STATE MASTER (Illinois EPA Project) - DRINKING WATER PROGRAM STATE MASTER (Illinois EPA Project) - National Pollutant Discharge Elimination System Permit, National Pollutant Discharge Elimination System NON-MAJOR (Tracking pollutant discharge elimination systems) - permit Business SIC classification: SEWERAGE SYSTEMS Alternative names: ROODHOUSE, CITY OF, ROODHOUSE STP
KANSAS CITY SOUTHERN RAILWAY (RANDOLPH ST in ROODHOUSE, IL)
STATE MASTER (Illinois EPA Project) - SOLID WASTE PROGRAM (Resource Conservation and Recovery Act (tracking hazardous waste)) Alternative names: ILLINOIS CENTRAL GULF RAILROAD CO
GREENE COUNTY SERVICE CO (US 267 in ROODHOUSE, IL)
STATE MASTER (Illinois EPA Project) - AIR PROGRAM AIR MINOR (AIRS/AFS) Business SIC classification: FERTILIZERS, MIXING ONLY
HAGEN-HENRY FEED SERVICE (ROUTE 267 S in ROODHOUSE, IL)
STATE MASTER (Illinois EPA Project) - AIR PROGRAM AIR MINOR (AIRS/AFS) CRITERIA AND HAZARDOUS AIR POLLUTANT INVENTORY (Inventory of air pollution sources) Business SIC classification: GRAIN AND FIELD BEANS
ROODHOUSE ENVELOPE CO (414 S STATE ST in ROODHOUSE, IL)
STATE MASTER (Illinois EPA Project) - SOLID WASTE PROGRAM, HAZARDOUS WASTE PROGRAM Small Quantity Generators, between 100 kg and 1000 kg of hazardous waste/month (Resource Conservation and Recovery Act (tracking hazardous waste)) Organizations: STRAIN GLADYS A (CONTACT/OWNER)
SANDY CREEK BAPTIST CAMP (RURAL ROUTE #1 in ROODHOUSE, IL)
STATE MASTER (Illinois EPA Project) - National Pollutant Discharge Elimination System Permit National Pollutant Discharge Elimination System NON-MAJOR (Tracking pollutant discharge elimination systems) - permit Business SIC classification: RELIGIOUS ORGANIZATIONS
NORTH GREENE JR HIGH SCHOOL (403 W NORTH ST in ROODHOUSE, IL)
(National Center for Education Statistics) - STATE ID-4003100301001 Organizations: NORTH GREENE UNIT DIST 3 (SCHOOL DISTRICT)
ROODHOUSE ELEMENTARY (403 W NORTH ST in ROODHOUSE, IL)
(National Center for Education Statistics) - STATE ID-4003100302002 Organizations: NORTH GREENE UNIT DIST 3 (SCHOOL DISTRICT)
GREENE COUNTY LANDFILL ( in ROODHOUSE, IL)
National Pollutant Discharge Elimination System NON-MAJOR (Tracking pollutant discharge elimination systems) - permit Organizations: WASTE MANAGEMENT OF ILLINOIS (CONTACT/OWNER)
ROODHOUSE STP, CITY OF (137 WEST PALM STREET in ROODHOUSE, IL)
National Pollutant Discharge Elimination System NON-MAJOR (Tracking pollutant discharge elimination systems) - permit Business SIC classification: SEWERAGE SYSTEMS
ROODHOUSE POWER PLANT (303 W PRARIE in ROODHOUSE, IL)
COMPLIANCE ACTIVITY (Tracking inspections of insecticide, fungicide, and rodenticide, and toxic substances)
Housing units lacking complete plumbing facilities: 11.2% Housing units lacking complete kitchen facilities: 10.6%
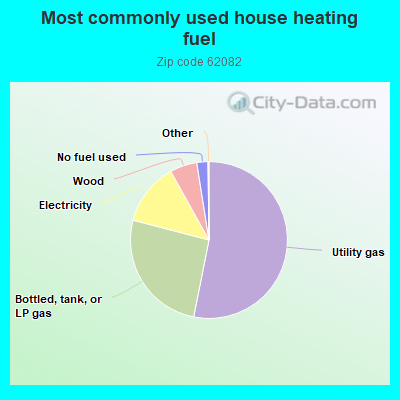
53.3%Utility gas
26.0%Bottled, tank, or LP gas
12.9%Electricity
5.6%Wood
2.3%No fuel used
Population in 1990: 3,020. Population change in the 1990s: +262 (+8.7%).
Place of birth for U.S.-born residents:
This state: 2,204
Northeast: 12
Midwest: 189
South: 18
West: 50
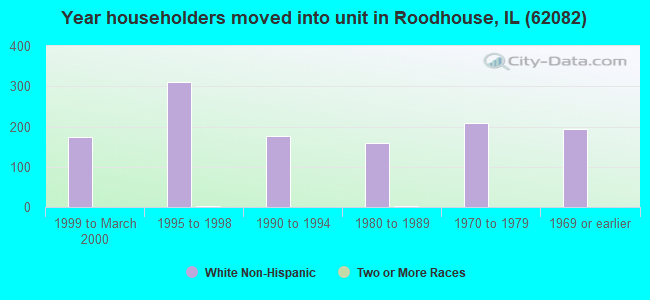
61% of the 62082 zip code residents lived in the same house 5 years ago. Out of people who lived in different houses, 52% lived in this county. Out of people who lived in different counties, 50% lived in Illinois.
91% of the 62082 zip code residents lived in the same house 1 year ago. Out of people who lived in different houses, 32% moved from this county. Out of people who lived in different houses, 65% moved from different county within same state. Out of people who lived in different houses, 5% moved from different state.
Private vs. public school enrollment:
Students in private schools in grades 1 to 8 (elementary and middle school): 1
Here:
0.5%
Illinois:
13.3%
Students in private schools in grades 9 to 12 (high school): 16
Here:
26.6%
Illinois:
9.9%
Students in private undergraduate colleges: 6
Here:
14.0%
Illinois:
27.4%
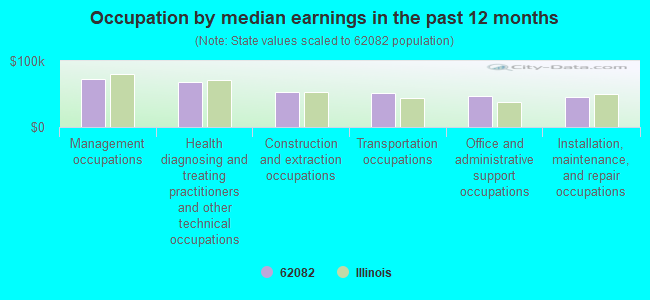
Occupation by median earnings in the past 12 months ($)
72,124Management occupations
68,490Health diagnosing and treating practitioners and other technical occupations
53,086Construction and extraction occupations
51,752Transportation occupations
46,336Office and administrative support occupations
45,358Installation, maintenance, and repair occupations
Top industries in this zip code by the number of employees in 2005:
153 people in local jails and other confinement facilities (including police lockups)
Fatal accident statistics in 2013:
Fatal accident count: 1
Vehicles involved in fatal accidents: 1
Fatal accidents caused by drunken drivers: 1
Fatalities: 1
Persons involved in fatal accidents: 1
Pedestrians involved in fatal accidents: 0
2002 - 2018 National Fire Incident Reporting System (NFIRS) incidents
Based on the data from the years 2002 - 2018 the average number of fires per year is 17. The highest number of fires - 30 took place in 2002, and the least - 8 in 2005. The data has a decreasing trend.
When looking into fire subcategories, the most reports belonged to: Outside Fires (39.0%), and Structure Fires (31.2%).
Fire incident types reported to NFIRS in Zip Code 62082


 Nearest zip codes: 62663, 62098, 62668, 62092, 62610, 62044.


 Based on the data from the years 2002 - 2018 the average number of fires per year is 17. The highest number of fires - 30 took place in 2002, and the least - 8 in 2005. The data has a decreasing trend.
 When looking into fire subcategories, the most reports belonged to: Outside Fires (39.0%), and Structure Fires (31.2%).