Estimated zip code population in 2022: 6,218 Zip code population in 2010: 6,216 Zip code population in 2000: 6,285
Houses and condos: 2,966 Renter-occupied apartments: 609
% of renters here:
22%
State:
33%
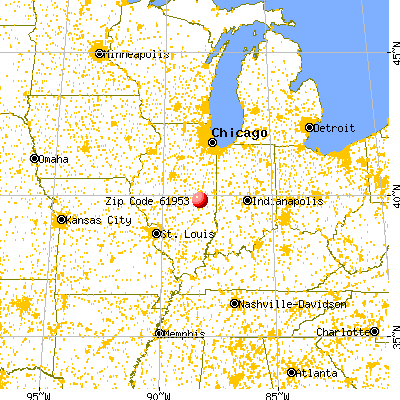
March 2022 cost of living index in zip code 61953: 75.9 (low, U.S. average is 100)
Land area: 120.6 sq. mi. Water area: 0.2 sq. mi.
Population density: 52 people per square mile
(very low).
OSM Map
General Map
Google Map
MSN Map
OSM Map
General Map
Google Map
MSN Map
OSM Map
General Map
Google Map
MSN Map
OSM Map
General Map
Google Map
MSN Map
Please wait while loading the map...
Real estate property taxes paid for housing units in 2022:
This zip code:
1.5% ($2,567)
Illinois:
2.0% ($4,912)
Median real estate property taxes paid for housing units with mortgages in 2022: $2,959 (1.7%) Median real estate property taxes paid for housing units with no mortgage in 2022: $2,122 (1.6%)
Averages for the 2020 tax year for zip code 61953, filed in 2021:
Average Adjusted Gross Income (AGI) in 2020: $63,997 (Individual Income Tax Returns)
Here:
$63,997
State:
$82,626
Salary/wage: $51,735 (reported on 81.7% of returns)
Here:
$51,735
State:
$66,640
(% of AGI for various income ranges: 1236.5% for AGIs below $25k, 3640.3% for AGIs $25k-50k, 5865.4% for AGIs $50k-75k, 8521.6% for AGIs $75k-100k, 15962.5% for AGIs $100k-200k, 79410.0% for AGIs over 200k)
Taxable interest for individuals: $1,141 (reported on 37.2% of returns)
This zip code:
$1,141
Illinois:
$2,376
(% of AGI for various income ranges: 24.0% for AGIs below $25k, 39.3% for AGIs $25k-50k, 47.7% for AGIs $50k-75k, 76.8% for AGIs $75k-100k, 121.1% for AGIs $100k-200k, 1185.0% for AGIs over 200k)
Ordinary dividends: $3,414 (reported on 20.8% of returns)
Here:
$3,414
State:
$9,061
(% of AGI for various income ranges: 25.4% for AGIs below $25k, 42.0% for AGIs $25k-50k, 73.7% for AGIs $50k-75k, 123.6% for AGIs $75k-100k, 283.9% for AGIs $100k-200k, 2220.0% for AGIs over 200k)
Net capital gain/loss in AGI: +$5,680 (reported on 17.9% of returns)
Here:
+$5,680
State:
+$31,684
(% of AGI for various income ranges: 8.6% for AGIs below $25k, 14.6% for AGIs $25k-50k, 52.6% for AGIs $50k-75k, 146.0% for AGIs $75k-100k, 323.2% for AGIs $100k-200k, 7925.0% for AGIs over 200k)
Profit/loss from business: +$16,145 (reported on 14.1% of returns)
Here:
+$16,145
State:
+$12,175
(% of AGI for various income ranges: 100.9% for AGIs below $25k, 55.9% for AGIs $25k-50k, 227.1% for AGIs $50k-75k, 283.2% for AGIs $75k-100k, 518.2% for AGIs $100k-200k, 15820.0% for AGIs over 200k)
Taxable individual retirement arrangement distribution: $18,633 (reported on 11.5% of returns)
61953:
$18,633
Illinois:
$21,613
(% of AGI for various income ranges: 93.7% for AGIs below $25k, 188.5% for AGIs $25k-50k, 343.4% for AGIs $50k-75k, 524.8% for AGIs $75k-100k, 883.2% for AGIs $100k-200k)
Self-employed (Keogh) retirement plans: $24,500 (reported on 0.6% of returns)
61953:
$24,500
Illinois:
$30,962
(% of AGI for various income ranges: 140.0% for AGIs $50k-75k)
Total itemized deductions: $29,769 (reported on 4.2% of returns)
Here:
$29,769
State:
$34,948
(% of AGI for various income ranges: 92.8% for AGIs below $25k, 189.4% for AGIs $50k-75k, 284.8% for AGIs $75k-100k, 375.0% for AGIs $100k-200k, 4210.0% for AGIs over 200k)
Charity contributions: $11,700 (reported on 2.9% of returns)
Here:
$11,700
State:
$13,122
(% of AGI for various income ranges: 91.4% for AGIs $50k-75k, 124.6% for AGIs $100k-200k, 1920.0% for AGIs over 200k)
Taxes paid: $6,962 (reported on 4.2% of returns)
61953:
$6,962
State:
$8,563
(% of AGI for various income ranges: 13.5% for AGIs below $25k, 36.3% for AGIs $50k-75k, 68.4% for AGIs $75k-100k, 108.2% for AGIs $100k-200k, 1080.0% for AGIs over 200k)
Earned income credit: $2,029 (reported on 12.2% of returns)
Here:
$2,029
State:
$2,311
(% of AGI for various income ranges: 69.2% for AGIs below $25k, 54.4% for AGIs $25k-50k)
Percentage of individuals using paid preparers for their 2020 taxes: 95.2%
Here:
95%
State:
93%
(% for various income ranges: 93.7% for AGIs below $25k, 96.0% for AGIs $25k-50k, 95.9% for AGIs $50k-75k, 94.4% for AGIs $75k-100k, 95.7% for AGIs $100k-200k, 100.0% for AGIs over 200k)
Averages for the 2012 tax year for zip code 61953, filed in 2013:
Average Adjusted Gross Income (AGI) in 2012: $51,202 (Individual Income Tax Returns)
Here:
$51,202
State:
$68,058
Salary/wage: $41,410 (reported on 82.2% of returns)
Here:
$41,410
State:
$55,396
(% of AGI for various income ranges: 70.8% for AGIs below $25k, 75.3% for AGIs $25k-50k, 71.3% for AGIs $50k-75k, 71.0% for AGIs $75k-100k, 66.1% for AGIs $100k-200k, 36.2% for AGIs over 200k)
Taxable interest for individuals: $1,417 (reported on 42.1% of returns)
This zip code:
$1,417
Illinois:
$1,969
(% of AGI for various income ranges: 2.4% for AGIs below $25k, 0.9% for AGIs $25k-50k, 1.0% for AGIs $50k-75k, 0.9% for AGIs $75k-100k, 0.7% for AGIs $100k-200k, 2.5% for AGIs over 200k)
Ordinary dividends: $2,519 (reported on 21.7% of returns)
Here:
$2,519
State:
$7,786
(% of AGI for various income ranges: 2.1% for AGIs below $25k, 0.9% for AGIs $25k-50k, 0.6% for AGIs $50k-75k, 1.1% for AGIs $75k-100k, 1.1% for AGIs $100k-200k, 1.2% for AGIs over 200k)
Net capital gain/loss in AGI: +$5,194 (reported on 15.5% of returns)
Here:
+$5,194
State:
+$22,183
(% of AGI for various income ranges: 0.3% for AGIs $25k-50k, 0.6% for AGIs $50k-75k, 0.7% for AGIs $75k-100k, 2.0% for AGIs $100k-200k, 6.6% for AGIs over 200k)
Profit/loss from business: +$12,822 (reported on 12.9% of returns)
Here:
+$12,822
State:
+$12,903
(% of AGI for various income ranges: 4.1% for AGIs below $25k, 2.8% for AGIs $25k-50k, 3.2% for AGIs $50k-75k, 3.7% for AGIs $75k-100k, 4.4% for AGIs $100k-200k)
Taxable individual retirement arrangement distribution: $12,100 (reported on 13.6% of returns)
61953:
$12,100
Illinois:
$17,929
(% of AGI for various income ranges: 5.2% for AGIs below $25k, 4.3% for AGIs $25k-50k, 3.2% for AGIs $50k-75k, 2.7% for AGIs $75k-100k, 3.6% for AGIs $100k-200k)
Self-employment retirement plans: $21,950 (reported on 0.6% of returns)
61953:
$21,950
Illinois:
$24,666
(% of AGI for various income ranges: 1.6% for AGIs $75k-100k)
Total itemized deductions: $18,332 (19% of AGI, reported on 24.3% of returns)
Here:
$18,332
State:
$26,433
Here:
18.9% of AGI
State:
19.2% of AGI
(% of AGI for various income ranges: 8.0% for AGIs below $25k, 6.9% for AGIs $25k-50k, 7.5% for AGIs $50k-75k, 8.3% for AGIs $75k-100k, 11.1% for AGIs $100k-200k, 9.0% for AGIs over 200k)
Charity contributions: $3,538 (reported on 18.1% of returns)
Here:
$3,538
State:
$4,525
(% of AGI for various income ranges: 0.6% for AGIs below $25k, 0.9% for AGIs $25k-50k, 0.9% for AGIs $50k-75k, 1.3% for AGIs $75k-100k, 1.7% for AGIs $100k-200k, 1.9% for AGIs over 200k)
Taxes paid: $7,651 (reported on 24.3% of returns)
61953:
$7,651
State:
$11,968
(% of AGI for various income ranges: 1.6% for AGIs below $25k, 2.0% for AGIs $25k-50k, 2.8% for AGIs $50k-75k, 3.3% for AGIs $75k-100k, 5.4% for AGIs $100k-200k, 5.2% for AGIs over 200k)
Earned income credit: $2,012 (reported on 13.9% of returns)
Here:
$2,012
State:
$2,349
(% of AGI for various income ranges: 4.8% for AGIs below $25k, 0.8% for AGIs $25k-50k)
Percentage of individuals using paid preparers for their 2012 taxes: 63.8%
Here:
64%
State:
57%
(% for various income ranges: 58.3% for AGIs below $25k, 64.0% for AGIs $25k-50k, 65.3% for AGIs $50k-75k, 65.6% for AGIs $75k-100k, 75.0% for AGIs $100k-200k, 83.3% for AGIs over 200k)
Averages for the 2004 tax year for zip code 61953, filed in 2005:
Average Adjusted Gross Income (AGI) in 2004: $39,395 (Individual Income Tax Returns)
Here:
$39,395
State:
$54,625
Salary/wage: $33,332 (reported on 83.5% of returns)
Here:
$33,332
State:
$46,811
(% of AGI for various income ranges: 130.5% for AGIs below $10k, 67.8% for AGIs $10k-25k, 74.9% for AGIs $25k-50k, 77.1% for AGIs $50k-75k, 78.2% for AGIs $75k-100k, 49.3% for AGIs over 100k)
Taxable interest for individuals: $1,840 (reported on 50.0% of returns)
This zip code:
$1,840
Illinois:
$2,101
(% of AGI for various income ranges: 9.6% for AGIs below $10k, 3.4% for AGIs $10k-25k, 2.3% for AGIs $25k-50k, 1.7% for AGIs $50k-75k, 1.8% for AGIs $75k-100k, 2.5% for AGIs over 100k)
Taxable dividends: $1,724 (reported on 25.9% of returns)
Here:
$1,724
State:
$4,306
(% of AGI for various income ranges: 2.4% for AGIs below $10k, 1.7% for AGIs $10k-25k, 0.8% for AGIs $25k-50k, 0.8% for AGIs $50k-75k, 0.9% for AGIs $75k-100k, 1.7% for AGIs over 100k)
Net capital gain/loss: +$6,438 (reported on 20.0% of returns)
Here:
+$6,438
State:
+$17,321
(% of AGI for various income ranges: 0.1% for AGIs below $10k, 0.2% for AGIs $10k-25k, 0.6% for AGIs $25k-50k, 1.0% for AGIs $50k-75k, 0.8% for AGIs $75k-100k, 12.3% for AGIs over 100k)
Profit/loss from business: +$11,113 (reported on 14.3% of returns)
Here:
+$11,113
State:
+$11,771
(% of AGI for various income ranges: 8.5% for AGIs below $10k, 5.2% for AGIs $10k-25k, 3.0% for AGIs $25k-50k, 2.4% for AGIs $50k-75k, 3.5% for AGIs $75k-100k, 6.4% for AGIs over 100k)
Profit/loss from farming: +$13,379 (reported on 4.3% of returns)
Here:
+$13,379
State:
+$2,327
(% of AGI for various income ranges: 0.2% for AGIs below $10k, 0.2% for AGIs $10k-25k, 1.7% for AGIs $25k-50k, 1.9% for AGIs $50k-75k, 2.5% for AGIs $75k-100k, 0.5% for AGIs over 100k)
IRA payment deduction: $3,164 (reported on 2.2% of returns)
61953:
$3,164
Illinois:
$3,087
Self-employed pension: $8,135 (reported on 1.2% of returns)
Here:
$8,135
Illinois:
$16,965
Total itemized deductions: $14,803 (21% of AGI, reported on 21.0% of returns)
Here:
$14,803
State:
$20,239
Here:
20.6% of AGI
State:
19.5% of AGI
(% of AGI for various income ranges: 12.3% for AGIs below $10k, 6.9% for AGIs $10k-25k, 6.2% for AGIs $25k-50k, 7.8% for AGIs $50k-75k, 9.2% for AGIs $75k-100k, 8.9% for AGIs over 100k)
Charity contributions deductions: $2,917 (4% of AGI, reported on 17.1% of returns)
Here:
$2,917
State:
$3,719
Here:
3.8% of AGI
State:
3.4% of AGI
(% of AGI for various income ranges: 0.7% for AGIs below $10k, 0.5% for AGIs $10k-25k, 1.0% for AGIs $25k-50k, 1.3% for AGIs $50k-75k, 1.3% for AGIs $75k-100k, 1.8% for AGIs over 100k)
Total tax: $5,254 (reported on 76.1% of returns)
61953:
$5,254
State:
$9,882
(% of AGI for various income ranges: 3.4% for AGIs below $10k, 4.6% for AGIs $10k-25k, 7.2% for AGIs $25k-50k, 8.4% for AGIs $50k-75k, 11.0% for AGIs $75k-100k, 17.7% for AGIs over 100k)
Earned income credit: $1,565 (reported on 10.9% of returns)
Here:
$1,565
State:
$1,788
Percentage of individuals using paid preparers for their 2004 taxes: 65.1%
Here:
65%
State:
61%
(% for various income ranges: 53.7% for AGIs below $10k, 67.9% for AGIs $10k-25k, 68.6% for AGIs $25k-50k, 65.5% for AGIs $50k-75k, 69.2% for AGIs $75k-100k, 76.2% for AGIs over 100k)
Household received Food Stamps/SNAP in the past 12 months: 221 Household did not receive Food Stamps/SNAP in the past 12 months: 2,498
Women who had a birth in the past 12 months: 107 (107 now married, 0 unmarried) Women who did not have a birth in the past 12 months: 1,305 (666 now married, 633 unmarried)
Housing units in zip code 61953 with a mortgage: 1,301 (166 second mortgage, 161 both second mortgage and home equity loan) Median monthly owner costs for units with a mortgage: $1,323 Median monthly owner costs for units without a mortgage: $494
Residents with income below the poverty level in 2022:
This zip code:
8.8%
Whole state:
11.9%
Residents with income below 50% of the poverty level in 2022:
This zip code:
5.6%
Whole state:
5.7%
Median number of rooms in houses and condos:
Here:
6.1
State:
6.4
Median number of rooms in apartments:
Here:
4.0
State:
4.1
Notable locations in this zip code not listed on our city pages
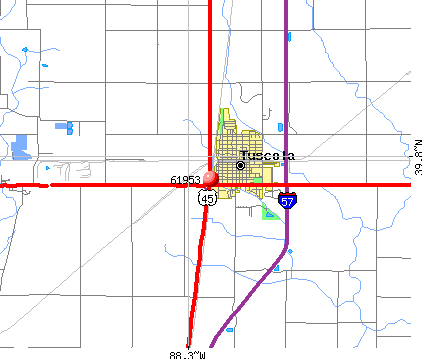
Notable locations in zip code 61953: Tuscola Public Library (A), Tuscola City Hall (B), Tuscola Fire Department South (C), Tuscola Fire Department North (D), Douglas County Museum (E), Douglas County Courthouse (F), Douglas County Agricultural Center (G), Cabot Corporation Tuscola Fire Station (H), Carle Health Care Ambulance (I). Display/hide their locations on the map
Churches in zip code 61953 include: Cartwright United Methodist Church (A), Bache Memorial Church (B), Hillcrest Southern Baptist Church (C), Immanuel Lutheran Church (D), Church of the Nazarene (E), First Baptist Church (F), First Christian Church (G), First Church of God (H), First United Presbyterian Church (I). Display/hide their locations on the map
Cemeteries: Bourbon Cemetery (1), Broadus Cemetery (2), Lewis Cemetery (3), Mount Zion Cemetery (4), Upper Lester Cemetery (5), Lower Lester Cemetery (6), Nelson Cemetery (7). Display/hide their locations on the map
Streams, rivers, and creeks: Scattering Fork (A), Dry Fork (B), Lake Fork (C), Hayes Branch (D), Hackett Branch (E). Display/hide their locations on the map
In group quarters: 48 (-1 institutionalized population)
Size of family households: 846 2-persons, 300 3-persons, 361 4-persons, 151 5-persons, 16 6-persons, 50 7-or-more-persons
Size of nonfamily households: 949 1-person, 64 2-persons
1,043 married couples with children.
275 single-parent households (75 men, 200 women).
90.4% of residents of 61953 zip code speak English at home.
1.8% of residents speak Spanish at home (60% very well, 40% well).
7.0% of residents speak other Indo-European language at home (40% very well, 60% well).
0.1% of residents speak Asian or Pacific Island language at home (100% not well).
0.6% of residents speak other language at home (100% very well).
Foreign born population: 228 (3.7%) (56.3% of them are naturalized citizens)
This zip code:
3.7%
Whole state:
14.4%
45%Honduras
13%Greece
10%Nepal
5%Bhutan
4%Cambodia
3%Japan
27%German
19%English
15%American
14%Irish
6%European
2%Italian
1%Pennsylvania German
Year of entry for the foreign-born population
962010 or later
292000 to 2009
691990 to 1999
96Before 1990
Major facilities with environmental interests located in this zip code:
PEPL TUSCOLA (575 E US HWY 36 in TUSCOLA, IL)
ENFORCEMENT/COMPLIANCE ACTIVITY (Integrated Compliance Information System) - ICIS-05-1988-0072, FORMAL ENFORCEMENT ACTION (Integrated Compliance Information System) - ICIS-05-1988-0072, FORMAL ENFORCEMENT ACTION National Pollutant Discharge Elimination System NON-MAJOR (Tracking pollutant discharge elimination systems) - permit HAZARDOUS WASTE BIENNIAL REPORTER (Resource Conservation and Recovery Act (tracking hazardous waste)) Large Quantity Generators, more that 1000 kg of hazardous waste/month (Resource Conservation and Recovery Act (tracking hazardous waste)) Business SIC classification: CRUDE PETROLEUM PIPELINES; NATURAL GAS TRANSMISSION Organizations: PANHANDLE EASTERN PIPELINE CO. (CONTACT/OPERATOR)
Alternative names: PANHANDLE EASTERN-TUSCOLA
DEKALB GENETICS CORP (204 W. SOUTHLINE RD. in TUSCOLA, IL)
STATE MASTER (Illinois EPA Project) - AIR PROGRAM AIR MINOR (AIRS/AFS) CRITERIA AND HAZARDOUS AIR POLLUTANT INVENTORY (Inventory of air pollution sources) Business SIC classification: CORN
AIR PRODUCTS AND CHEMICALS INC (RT. 36 W BOX 188 in TUSCOLA, IL)
STATE MASTER (Illinois EPA Project) - AIR PROGRAM AIR MINOR (AIRS/AFS) CRITERIA AND HAZARDOUS AIR POLLUTANT INVENTORY (Inventory of air pollution sources) Business SIC classification: INDUSTRIAL GASES Business NAICS classification: INDUSTRIAL GAS MANUFACTURING.
LIGHTING SUPPLY (RT 36 in TUSCOLA, IL)
STATE MASTER (Illinois EPA Project) - National Pollutant Discharge Elimination System Permit National Pollutant Discharge Elimination System NON-MAJOR (Tracking pollutant discharge elimination systems) - permit
LLOYD OIL CO INC (103 W. FICKLIN in TUSCOLA, IL)
STATE MASTER (Illinois EPA Project) - AIR PROGRAM AIR MINOR (AIRS/AFS) Business SIC classification: PETROLEUM BULK STATIONS AND TERMINALS
PANGBURN OIL INC (NORTHLINE RD in TUSCOLA, IL)
STATE MASTER (Illinois EPA Project) - AIR PROGRAM AIR MINOR (AIRS/AFS) CRITERIA AND HAZARDOUS AIR POLLUTANT INVENTORY (Inventory of air pollution sources) Business SIC classification: PETROLEUM BULK STATIONS AND TERMINALS
AUSTIN APGAR (1301 N. COUNTY RD,1350 EAST in TUSCOLA, IL)
STATE MASTER (Illinois EPA Project) - AIR PROGRAM AIR MINOR (AIRS/AFS) Business SIC classification: NONCLASSIFIABLE ESTABLISHMENTS
JARMAN CENTER (704 N MAIN ST in TUSCOLA, IL)
STATE MASTER (Illinois EPA Project) - AIR PROGRAM AIR MINOR (AIRS/AFS) Business SIC classification: GENERAL MEDICAL AND SURGICAL HOSPITALS
MARATHON OIL CO (RT 45 in TUSCOLA, IL)
STATE MASTER (Illinois EPA Project) - AIR PROGRAM AIR MINOR (AIRS/AFS) Business SIC classification: PETROLEUM BULK STATIONS AND TERMINALS
MIDWEST ENV CONSULTANS & REMEDIATION SVC (I57 & US ROUTE 36 in TUSCOLA, IL)
STATE MASTER (Illinois EPA Project) - AIR PROGRAM AIR MINOR (AIRS/AFS) Business SIC classification: NONCLASSIFIABLE ESTABLISHMENTS Alternative names: MIDWEST ENVNMTL CONSULT & REMED SERV
PARKVIEW MOBILE HOME PARK (ROUTE 45 AND 36 INTERCHANGE in TUSCOLA, IL)
STATE MASTER (Illinois EPA Project) - National Pollutant Discharge Elimination System Permit National Pollutant Discharge Elimination System NON-MAJOR (Tracking pollutant discharge elimination systems) - permit Business SIC classification: OPERATORS OF RESIDENTIAL MOBILE HOME SITES Alternative names: PARKVIEW MHP STP, PARKVIEW MHP-TUSCOLA
CILCO (115 W SOUTH CENTRAL in TUSCOLA, IL)
STATE MASTER (Illinois EPA Project) - HAZARDOUS WASTE PROGRAM, SOLID WASTE PROGRAM Small Quantity Generators, between 100 kg and 1000 kg of hazardous waste/month (Resource Conservation and Recovery Act (tracking hazardous waste)) Organizations: AMEREN CILCO (CONTACT/OPERATOR)
, CENTRAL ILL LIGHT CO DBA AMEREN CILCO (CONTACT/OWNER)
Alternative names: AMEREN CILCO TUSCOLA OFFICE, CENTRAL ILLINOIS LIGHT CO
Housing units lacking complete plumbing facilities: 0.7%
58.8%Utility gas
34.2%Electricity
5.7%Bottled, tank, or LP gas
1.0%Wood
Population in 1990: 5,056. Population change in the 1990s: +1,229 (+24.3%).
Place of birth for U.S.-born residents:
This state: 5,215
Northeast: 42
Midwest: 305
South: 203
West: 141
61% of the 61953 zip code residents lived in the same house 5 years ago. Out of people who lived in different houses, 56% lived in this county. Out of people who lived in different counties, 50% lived in Illinois.
88% of the 61953 zip code residents lived in the same house 1 year ago. Out of people who lived in different houses, 52% moved from this county. Out of people who lived in different houses, 42% moved from different county within same state. Out of people who lived in different houses, 2% moved from different state. Out of people who lived in different houses, 3% moved from abroad.
Private vs. public school enrollment:
Students in private schools in grades 1 to 8 (elementary and middle school): 113
Here:
21.4%
Illinois:
13.3%
Students in private schools in grades 9 to 12 (high school):
Here:
0.0%
Illinois:
9.9%
Students in private undergraduate colleges: 4
Here:
1.3%
Illinois:
27.4%
Occupation by median earnings in the past 12 months ($)
96,867Computer and mathematical occupations
91,160Architecture and engineering occupations
66,712Health diagnosing and treating practitioners and other technical occupations
66,049Construction and extraction occupations
59,642Health technologists and technicians
53,155Installation, maintenance, and repair occupations
Top industries in this zip code by the number of employees in 2005:
Wholesale Trade: Grain and Field Bean Merchant Wholesalers (20-49: 2, 1-4: 1)
People in group quarters in 2010:
16 people in local jails and other municipal confinement facilities
People in group quarters in 2000:
89 people in nursing homes
11 people in local jails and other confinement facilities (including police lockups)
Fatal accident statistics in 2013:
Fatal accident count: 1
Vehicles involved in fatal accidents: 1
Fatal accidents caused by drunken drivers: 0
Fatalities: 1
Persons involved in fatal accidents: 1
Pedestrians involved in fatal accidents: 0
Fatal accident statistics in 2012:
Fatal accident count: 2
Vehicles involved in fatal accidents: 3
Fatal accidents caused by drunken drivers: 0
Fatalities: 2
Persons involved in fatal accidents: 3
Pedestrians involved in fatal accidents: 1
2002 - 2018 National Fire Incident Reporting System (NFIRS) incidents
Based on the data from the years 2002 - 2018 the average number of fires per year is 27. The highest number of reported fire incidents - 45 took place in 2017, and the least - 12 in 2002. The data has a growing trend.
When looking into fire subcategories, the most reports belonged to: Structure Fires (41.4%), and Outside Fires (32.2%).
Fire incident types reported to NFIRS in Zip Code 61953


 Nearest zip codes: 61863, 61910, 61919, 61956, 61872, 61880.


 Based on the data from the years 2002 - 2018 the average number of fires per year is 27. The highest number of reported fire incidents - 45 took place in 2017, and the least - 12 in 2002. The data has a growing trend.
 When looking into fire subcategories, the most reports belonged to: Structure Fires (41.4%), and Outside Fires (32.2%).