Estimated zip code population in 2022: 1,640 Zip code population in 2010: 2,022 Zip code population in 2000: 2,746
Houses and condos: 800 Renter-occupied apartments: 213
% of renters here:
29%
State:
33%
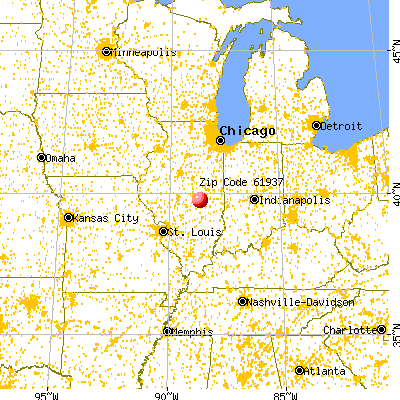
March 2022 cost of living index in zip code 61937: 83.8 (less than average, U.S. average is 100)
Land area: 94.2 sq. mi. Water area: 0.0 sq. mi.
Population density: 17 people per square mile
(very low).
OSM Map
General Map
Google Map
MSN Map
OSM Map
General Map
Google Map
MSN Map
OSM Map
General Map
Google Map
MSN Map
OSM Map
General Map
Google Map
MSN Map
Please wait while loading the map...
Real estate property taxes paid for housing units in 2022:
This zip code:
1.6% ($1,508)
Illinois:
2.0% ($4,912)
Median real estate property taxes paid for housing units with mortgages in 2022: $1,601 (1.8%) Median real estate property taxes paid for housing units with no mortgage in 2022: $1,261 (1.3%)
Business Search- 14 Million verified businesses
Males: 740
(45.1%)
Females: 900
(54.9%)
For population 25 years and over in 61937:
High school or higher: 89.6%
Bachelor's degree or higher: 13.4%
Graduate or professional degree: 1.9%
Unemployed: 6.7%
Mean travel time to work (commute): 27.3 minutes
For population 15 years and over in 61937:
Never married: 16.7%
Now married: 62.3%
Separated: 2.0%
Widowed: 7.0%
Divorced: 11.9%
Zip code 61937 compared to state average:
Median house value significantly below state average.
Black race population percentage significantly below state average.
Hispanic race population percentage significantly below state average.
Foreign-born population percentage significantly below state average.
House age above state average.
Percentage of population with a bachelor's degree or higher significantly below state average.
Averages for the 2020 tax year for zip code 61937, filed in 2021:
Average Adjusted Gross Income (AGI) in 2020: $57,899 (Individual Income Tax Returns)
Here:
$57,899
State:
$82,626
Salary/wage: $45,394 (reported on 79.5% of returns)
Here:
$45,394
State:
$66,640
(% of AGI for various income ranges: 1182.2% for AGIs below $25k, 4095.0% for AGIs $25k-50k, 6756.4% for AGIs $50k-75k, 8473.3% for AGIs $75k-100k, 17633.3% for AGIs $100k-200k)
Taxable interest for individuals: $1,130 (reported on 34.1% of returns)
This zip code:
$1,130
Illinois:
$2,376
(% of AGI for various income ranges: 20.6% for AGIs below $25k, 35.6% for AGIs $25k-50k, 53.6% for AGIs $50k-75k, 26.7% for AGIs $75k-100k, 283.3% for AGIs $100k-200k)
Ordinary dividends: $2,215 (reported on 14.8% of returns)
Here:
$2,215
State:
$9,061
(% of AGI for various income ranges: 22.8% for AGIs below $25k, 42.5% for AGIs $25k-50k, 38.2% for AGIs $50k-75k, 50.0% for AGIs $75k-100k, 178.3% for AGIs $100k-200k)
Net capital gain/loss in AGI: +$3,225 (reported on 13.6% of returns)
Here:
+$3,225
State:
+$31,684
(% of AGI for various income ranges: 6.7% for AGIs below $25k, 138.2% for AGIs $50k-75k, 371.7% for AGIs $100k-200k)
Profit/loss from business: +$21,258 (reported on 13.6% of returns)
Here:
+$21,258
State:
+$12,175
(% of AGI for various income ranges: 160.0% for AGIs below $25k, 151.2% for AGIs $25k-50k, 392.7% for AGIs $50k-75k, 2648.3% for AGIs $100k-200k)
Taxable individual retirement arrangement distribution: $17,622 (reported on 10.2% of returns)
61937:
$17,622
Illinois:
$21,613
(% of AGI for various income ranges: 61.1% for AGIs below $25k, 263.1% for AGIs $25k-50k, 1758.3% for AGIs $75k-100k)
Earned income credit: $2,321 (reported on 15.9% of returns)
Here:
$2,321
State:
$2,311
(% of AGI for various income ranges: 109.4% for AGIs below $25k, 80.0% for AGIs $25k-50k)
Percentage of individuals using paid preparers for their 2020 taxes: 90.9%
Here:
91%
State:
93%
(% for various income ranges: 92.3% for AGIs below $25k, 91.3% for AGIs $25k-50k, 93.8% for AGIs $50k-75k, 88.9% for AGIs $75k-100k, 90.9% for AGIs $100k-200k, 66.7% for AGIs over 200k)
Averages for the 2012 tax year for zip code 61937, filed in 2013:
Average Adjusted Gross Income (AGI) in 2012: $51,572 (Individual Income Tax Returns)
Here:
$51,572
State:
$68,058
Salary/wage: $40,611 (reported on 82.0% of returns)
Here:
$40,611
State:
$55,396
(% of AGI for various income ranges: 69.2% for AGIs below $25k, 79.3% for AGIs $25k-50k, 80.7% for AGIs $50k-75k, 69.8% for AGIs $75k-100k, 42.6% for AGIs $100k-200k)
Taxable interest for individuals: $775 (reported on 40.4% of returns)
This zip code:
$775
Illinois:
$1,969
(% of AGI for various income ranges: 1.7% for AGIs below $25k, 0.7% for AGIs $25k-50k, 0.4% for AGIs $50k-75k, 0.3% for AGIs $75k-100k, 0.5% for AGIs $100k-200k)
Ordinary dividends: $947 (reported on 19.1% of returns)
Here:
$947
State:
$7,786
(% of AGI for various income ranges: 0.9% for AGIs below $25k, 0.4% for AGIs $25k-50k, 0.3% for AGIs $50k-75k, 0.2% for AGIs $75k-100k, 0.3% for AGIs $100k-200k)
Net capital gain/loss in AGI: +$5,122 (reported on 10.1% of returns)
Here:
+$5,122
State:
+$22,183
(% of AGI for various income ranges: 2.9% for AGIs $100k-200k)
Profit/loss from business: +$8,033 (reported on 13.5% of returns)
Here:
+$8,033
State:
+$12,903
(% of AGI for various income ranges: 3.5% for AGIs below $25k, 3.7% for AGIs $25k-50k, 3.7% for AGIs $50k-75k, 0.8% for AGIs $100k-200k)
Taxable individual retirement arrangement distribution: $9,129 (reported on 7.9% of returns)
61937:
$9,129
Illinois:
$17,929
Total itemized deductions: $18,700 (18% of AGI, reported on 19.1% of returns)
Here:
$18,700
State:
$26,433
Here:
18.0% of AGI
State:
19.2% of AGI
(% of AGI for various income ranges: 9.1% for AGIs $25k-50k, 6.5% for AGIs $50k-75k, 8.0% for AGIs $75k-100k, 7.1% for AGIs $100k-200k)
Charity contributions: $4,158 (reported on 13.5% of returns)
Here:
$4,158
State:
$4,525
(% of AGI for various income ranges: 1.6% for AGIs below $25k, 1.4% for AGIs $50k-75k, 0.9% for AGIs $75k-100k, 1.5% for AGIs $100k-200k)
Taxes paid: $6,612 (reported on 19.1% of returns)
61937:
$6,612
State:
$11,968
(% of AGI for various income ranges: 1.6% for AGIs $25k-50k, 2.2% for AGIs $50k-75k, 3.2% for AGIs $75k-100k, 3.4% for AGIs $100k-200k)
Earned income credit: $2,050 (reported on 13.5% of returns)
Here:
$2,050
State:
$2,349
(% of AGI for various income ranges: 4.3% for AGIs below $25k, 0.9% for AGIs $25k-50k)
Percentage of individuals using paid preparers for their 2012 taxes: 65.2%
Here:
65%
State:
57%
(% for various income ranges: 58.1% for AGIs below $25k, 68.0% for AGIs $25k-50k, 68.8% for AGIs $50k-75k, 75.0% for AGIs $75k-100k, 66.7% for AGIs $100k-200k)
Averages for the 2004 tax year for zip code 61937, filed in 2005:
Average Adjusted Gross Income (AGI) in 2004: $38,636 (Individual Income Tax Returns)
Here:
$38,636
State:
$54,625
Salary/wage: $33,429 (reported on 82.5% of returns)
Here:
$33,429
State:
$46,811
(% of AGI for various income ranges: 103.1% for AGIs below $10k, 69.3% for AGIs $10k-25k, 79.1% for AGIs $25k-50k, 77.4% for AGIs $50k-75k, 79.9% for AGIs $75k-100k, 44.4% for AGIs over 100k)
Taxable interest for individuals: $1,331 (reported on 49.7% of returns)
This zip code:
$1,331
Illinois:
$2,101
(% of AGI for various income ranges: 10.6% for AGIs below $10k, 3.6% for AGIs $10k-25k, 1.9% for AGIs $25k-50k, 1.4% for AGIs $50k-75k, 0.5% for AGIs $75k-100k, 0.9% for AGIs over 100k)
Taxable dividends: $1,180 (reported on 22.6% of returns)
Here:
$1,180
State:
$4,306
(% of AGI for various income ranges: 2.7% for AGIs below $10k, 0.8% for AGIs $10k-25k, 1.0% for AGIs $25k-50k, 0.3% for AGIs $50k-75k, 0.3% for AGIs $75k-100k, 0.9% for AGIs over 100k)
Net capital gain/loss: +$2,365 (reported on 13.5% of returns)
Here:
+$2,365
State:
+$17,321
(% of AGI for various income ranges: -1.3% for AGIs below $10k, 0.2% for AGIs $10k-25k, 0.4% for AGIs $25k-50k, 1.6% for AGIs $50k-75k, 0.1% for AGIs $75k-100k, 1.5% for AGIs over 100k)
Profit/loss from business: +$7,270 (reported on 16.3% of returns)
Here:
+$7,270
State:
+$11,771
(% of AGI for various income ranges: 10.5% for AGIs below $10k, 2.7% for AGIs $10k-25k, 2.8% for AGIs $25k-50k, 6.7% for AGIs $50k-75k, 0.2% for AGIs $75k-100k)
Profit/loss from farming: +$7,519 (reported on 8.2% of returns)
Here:
+$7,519
State:
+$2,327
(% of AGI for various income ranges: 3.5% for AGIs $10k-25k, -0.8% for AGIs $25k-50k, 2.6% for AGIs $50k-75k, 3.8% for AGIs over 100k)
IRA payment deduction: $2,435 (reported on 2.5% of returns)
61937:
$2,435
Illinois:
$3,087
Total itemized deductions: $15,175 (19% of AGI, reported on 16.5% of returns)
Here:
$15,175
State:
$20,239
Here:
18.8% of AGI
State:
19.5% of AGI
(% of AGI for various income ranges: 7.7% for AGIs $10k-25k, 6.5% for AGIs $25k-50k, 4.7% for AGIs $50k-75k, 9.9% for AGIs $75k-100k, 6.2% for AGIs over 100k)
Charity contributions deductions: $3,110 (4% of AGI, reported on 13.6% of returns)
Here:
$3,110
State:
$3,719
Here:
3.6% of AGI
State:
3.4% of AGI
(% of AGI for various income ranges: 0.6% for AGIs $10k-25k, 1.0% for AGIs $25k-50k, 1.0% for AGIs $50k-75k, 1.9% for AGIs $75k-100k, 1.2% for AGIs over 100k)
Total tax: $4,539 (reported on 73.8% of returns)
61937:
$4,539
State:
$9,882
(% of AGI for various income ranges: 3.9% for AGIs below $10k, 4.1% for AGIs $10k-25k, 6.8% for AGIs $25k-50k, 8.9% for AGIs $50k-75k, 11.1% for AGIs $75k-100k, 12.3% for AGIs over 100k)
Earned income credit: $1,713 (reported on 14.5% of returns)
Here:
$1,713
State:
$1,788
Percentage of individuals using paid preparers for their 2004 taxes: 66.5%
Here:
67%
State:
61%
(% for various income ranges: 60.2% for AGIs below $10k, 65.8% for AGIs $10k-25k, 69.5% for AGIs $25k-50k, 66.7% for AGIs $50k-75k, 68.9% for AGIs $75k-100k, 77.1% for AGIs over 100k)
Likely homosexual households (counted as self-reported same-sex unmarried-partner households)
Lesbian couples: 0.4% of all households
Gay men: 0.0% of all households
Household received Food Stamps/SNAP in the past 12 months: 60 Household did not receive Food Stamps/SNAP in the past 12 months: 676
Women who had a birth in the past 12 months: 20 (17 now married, 2 unmarried) Women who did not have a birth in the past 12 months: 355 (193 now married, 160 unmarried)
Housing units in zip code 61937 with a mortgage: 290 (14 second mortgage, 4 both second mortgage and home equity loan) Houses without a mortgage: 3
Median monthly owner costs for units with a mortgage: $966 Median monthly owner costs for units without a mortgage: $534
Residents with income below the poverty level in 2022:
This zip code:
9.3%
Whole state:
11.9%
Residents with income below 50% of the poverty level in 2022:
This zip code:
2.0%
Whole state:
5.7%
Median number of rooms in houses and condos:
Here:
6.4
State:
6.4
Median number of rooms in apartments:
Here:
5.6
State:
4.1
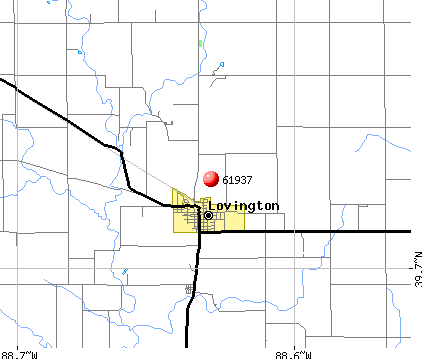
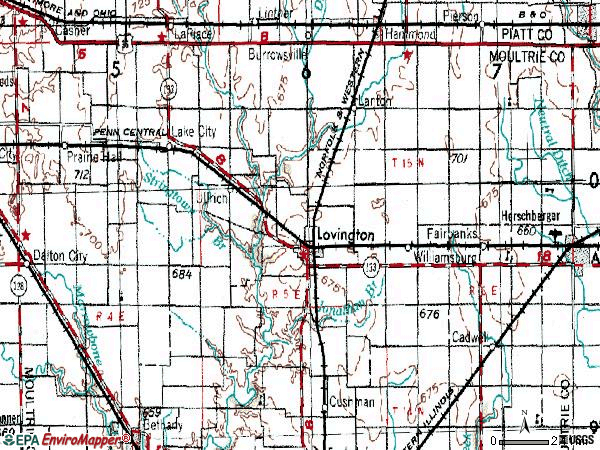
Notable locations in this zip code not listed on our city pages
Notable locations in zip code 61937: Lowe Townhall (A), Dora Township Fire Protection District Lake City (B), Lovington Volunteer Fire Protection District (C), Lovington Community Ambulance Service (D). Display/hide their locations on the map
In group quarters: 12 (-1 institutionalized population)
Size of family households: 276 2-persons, 65 3-persons, 50 4-persons, 56 5-persons, 33 7-or-more-persons
Size of nonfamily households: 210 1-person, 47 2-persons, 3 3-persons
292 married couples with children.
84 single-parent households (37 men, 47 women).
95.1% of residents of 61937 zip code speak English at home.
4.5% of residents speak other Indo-European language at home (48% very well, 52% well).
0.2% of residents speak Asian or Pacific Island language at home (100% very well).
Foreign born population: 0 (0.0%)
:
0.0%
Whole state:
14.4%
24%American
23%English
21%German
15%Irish
5%European
3%Italian
2%French
Year of entry for the foreign-born population
02010 or later
82000 to 2009
01990 to 1999
0Before 1990
Facilities with environmental interests located in this zip code:
OKAW FARMERS COOP INC (101 N. AL BEST DRIVE in LOVINGTON, IL)
STATE MASTER (Illinois EPA Project) - AIR PROGRAM AIR MINOR (AIRS/AFS) CRITERIA AND HAZARDOUS AIR POLLUTANT INVENTORY (Inventory of air pollution sources) Business SIC classification: GRAIN AND FIELD BEANS Alternative names: MOULTRIE GRAIN ASSOCIATION, MOULTRIE GRAIN ASSOCIATION LOVINGTON E-2
LOVINGTON HIGH SCHOOL (PO BOX 530 in LOVINGTON, IL)
(Geographic Names Information System) (National Center for Education Statistics) - STATE ID-1107030300002 Organizations: LOVINGTON C U SCHOOL DIST 303 (SCHOOL DISTRICT)
LOVINGTON ELEM SCHOOL (PO BOX 500 in LOVINGTON, IL)
(National Center for Education Statistics) - STATE ID-1107030302001 Organizations: LOVINGTON C U SCHOOL DIST 303 (SCHOOL DISTRICT)
Housing units lacking complete plumbing facilities: 3.5% Housing units lacking complete kitchen facilities: 4.5%
60.2%Utility gas
22.8%Electricity
12.8%Bottled, tank, or LP gas
2.9%Fuel oil, kerosene, etc.
1.7%Other fuel
Population in 1990: 1,995. Population change in the 1990s: +751 (+37.6%).
Place of birth for U.S.-born residents:
This state: 1,401
Northeast: 24
Midwest: 63
South: 56
West: 79
64% of the 61937 zip code residents lived in the same house 5 years ago. Out of people who lived in different houses, 44% lived in this county. Out of people who lived in different counties, 50% lived in Illinois.
93% of the 61937 zip code residents lived in the same house 1 year ago. Out of people who lived in different houses, 24% moved from this county. Out of people who lived in different houses, 67% moved from different county within same state. Out of people who lived in different houses, 14% moved from different state.
Private vs. public school enrollment:
Students in private schools in grades 1 to 8 (elementary and middle school): 26
Here:
11.9%
Illinois:
13.3%
Students in private schools in grades 9 to 12 (high school):
Here:
0.0%
Illinois:
9.9%
Students in private undergraduate colleges: 19
Here:
33.9%
Illinois:
27.4%
Occupation by median earnings in the past 12 months ($)
94,582Health diagnosing and treating practitioners and other technical occupations
61,041Business and financial operations occupations
54,531Construction and extraction occupations
54,479Transportation occupations
52,439Management occupations
52,270Material moving occupations
Companies with federal contracts located in this zip code:
SITE MAINTENANCE (RR 2 BOX 174 in LOVINGTON, IL; small business) : $36,530 in 9 contractsfrom 2003 to 2005
Contracts for Other Natural Resources and Conservation Services by Army, U.S. Army Corps of Engineers - civil program financing only Signed by year:2000: $0; 2001: $0; 2002: $0; 2003: $11,500; 2004: $20,140; 2005: $4,890; 2006: $0.
Biggest contracts:
$5,750 with Army for Other Natural Resources and Conservation Services. Signed on 2003-10-30. Completion date: 2003-12-31.
$5,750 with U.S. Army Corps of Engineers - civil program financing only for Other Natural Resources and Conservation Services. Signed on 2003-10-30. Completion date: 2003-12-31.
$5,275 with Army for Other Natural Resources and Conservation Services. Signed on 2004-11-03. Completion date: 2004-11-02.
$5,275 with U.S. Army Corps of Engineers - civil program financing only for Other Natural Resources and Conservation Services. Signed on 2004-11-03. Completion date: 2004-11-02.
Top industries in this zip code by the number of employees in 2005:
Health Care and Social Assistance: Residential Mental Retardation Facilities (20-49 employees: 1 establishment)
Finance and Insurance: Commercial Banking (10-19: 1, 1-4: 1)
Health Care and Social Assistance: Homes for the Elderly (10-19: 1)
Construction: New Single-Family Housing Construction (except Operative Builders) (5-9: 1, 1-4: 2)
Professional, Scientific, and Technical Services: Administrative Management and General Management Consulting Services (5-9: 1)
People in group quarters in 2010:
14 people in group homes intended for adults
People in group quarters in 2000:
16 people in homes for the mentally retarded
Fatal accident statistics in 2013:
Fatal accident count: 1
Vehicles involved in fatal accidents: 1
Fatal accidents caused by drunken drivers: 0
Fatalities: 1
Persons involved in fatal accidents: 1
Pedestrians involved in fatal accidents: 0
Fatal accident statistics in 2011:
Fatal accident count: 1
Vehicles involved in fatal accidents: 1
Fatal accidents caused by drunken drivers: 0
Fatalities: 4
Persons involved in fatal accidents: 4
Pedestrians involved in fatal accidents: 0
2002 - 2018 National Fire Incident Reporting System (NFIRS) incidents
Based on the data from the years 2002 - 2018 the average number of fires per year is 10. The highest number of reported fire incidents - 18 took place in 2012, and the least - 0 in 2004. The data has a constant trend.
When looking into fire subcategories, the most reports belonged to: Outside Fires (43.6%), and Structure Fires (33.1%).
Fire incident types reported to NFIRS in Zip Code 61937


 Nearest zip codes: 61929, 61936, 61914, 61818, 61951, 61855.


 Based on the data from the years 2002 - 2018 the average number of fires per year is 10. The highest number of reported fire incidents - 18 took place in 2012, and the least - 0 in 2004. The data has a constant trend.
 When looking into fire subcategories, the most reports belonged to: Outside Fires (43.6%), and Structure Fires (33.1%).