Estimated zip code population in 2022: 1,156 Zip code population in 2010: 1,344 Zip code population in 2000: 1,410
Houses and condos: 614 Renter-occupied apartments: 63
% of renters here:
11%
State:
33%
March 2022 cost of living index in zip code 61912: 83.8 (less than average, U.S. average is 100)
Land area: 50.7 sq. mi. Water area: 0.1 sq. mi.
Population density: 23 people per square mile
(very low).
OSM Map
General Map
Google Map
MSN Map
OSM Map
General Map
Google Map
MSN Map
OSM Map
General Map
Google Map
MSN Map
OSM Map
General Map
Google Map
MSN Map
Please wait while loading the map...
Real estate property taxes paid for housing units in 2022:
This zip code:
1.8% ($1,784)
Illinois:
2.0% ($4,912)
Median real estate property taxes paid for housing units with mortgages in 2022: $1,485 (1.6%) Median real estate property taxes paid for housing units with no mortgage in 2022: $2,168 (1.7%)
Business Search- 14 Million verified businesses
Males: 536
(46.4%)
Females: 620
(53.6%)
For population 25 years and over in 61912:
High school or higher: 90.2%
Bachelor's degree or higher: 19.4%
Graduate or professional degree: 9.0%
Unemployed: 7.3%
Mean travel time to work (commute): 22.0 minutes
For population 15 years and over in 61912:
Never married: 17.4%
Now married: 63.6%
Separated: 2.2%
Widowed: 6.1%
Divorced: 10.7%
Zip code 61912 compared to state average:
Median house value significantly below state average.
Black race population percentage significantly below state average.
Hispanic race population percentage significantly below state average.
Median age significantly above state average.
Foreign-born population percentage significantly below state average.
Renting percentage significantly below state average.
Length of stay since moving in significantly above state average.
Percentage of population with a bachelor's degree or higher below state average.
Averages for the 2020 tax year for zip code 61912, filed in 2021:
Average Adjusted Gross Income (AGI) in 2020: $64,378 (Individual Income Tax Returns)
Here:
$64,378
State:
$82,626
Salary/wage: $45,222 (reported on 83.6% of returns)
Here:
$45,222
State:
$66,640
(% of AGI for various income ranges: 1328.0% for AGIs below $25k, 3889.1% for AGIs $25k-50k, 6172.9% for AGIs $50k-75k, 9647.5% for AGIs $75k-100k, 23386.7% for AGIs $100k-200k)
Taxable interest for individuals: $840 (reported on 36.4% of returns)
This zip code:
$840
Illinois:
$2,376
(% of AGI for various income ranges: 18.0% for AGIs below $25k, 5.5% for AGIs $25k-50k, 22.9% for AGIs $50k-75k, 35.0% for AGIs $75k-100k, 380.0% for AGIs $100k-200k)
Ordinary dividends: $3,762 (reported on 14.5% of returns)
Here:
$3,762
State:
$9,061
(% of AGI for various income ranges: 178.6% for AGIs $50k-75k, 586.7% for AGIs $100k-200k)
Net capital gain/loss in AGI: +$6,286 (reported on 12.7% of returns)
Here:
+$6,286
State:
+$31,684
(% of AGI for various income ranges: 121.4% for AGIs $50k-75k, 1183.3% for AGIs $100k-200k)
Profit/loss from business: +$7,229 (reported on 12.7% of returns)
Here:
+$7,229
State:
+$12,175
(% of AGI for various income ranges: 32.0% for AGIs below $25k, 1247.5% for AGIs $75k-100k)
Taxable individual retirement arrangement distribution: $9,150 (reported on 7.3% of returns)
61912:
$9,150
Illinois:
$21,613
(% of AGI for various income ranges: 522.9% for AGIs $50k-75k)
Earned income credit: $1,938 (reported on 14.5% of returns)
Here:
$1,938
State:
$2,311
(% of AGI for various income ranges: 104.0% for AGIs below $25k, 46.4% for AGIs $25k-50k)
Percentage of individuals using paid preparers for their 2020 taxes: 94.5%
Here:
95%
State:
93%
(% for various income ranges: 93.3% for AGIs below $25k, 100.0% for AGIs $25k-50k, 100.0% for AGIs $50k-75k, 85.7% for AGIs $75k-100k, 90.0% for AGIs $100k-200k)
Averages for the 2012 tax year for zip code 61912, filed in 2013:
Average Adjusted Gross Income (AGI) in 2012: $55,495 (Individual Income Tax Returns)
Here:
$55,495
State:
$68,058
Salary/wage: $38,257 (reported on 86.9% of returns)
Here:
$38,257
State:
$55,396
(% of AGI for various income ranges: 77.5% for AGIs below $25k, 78.4% for AGIs $25k-50k, 78.5% for AGIs $50k-75k, 70.9% for AGIs $75k-100k, 74.7% for AGIs $100k-200k)
Taxable interest for individuals: $741 (reported on 36.1% of returns)
This zip code:
$741
Illinois:
$1,969
(% of AGI for various income ranges: 1.2% for AGIs below $25k, 0.4% for AGIs $25k-50k, 0.4% for AGIs $50k-75k, 0.4% for AGIs $75k-100k, 1.1% for AGIs $100k-200k)
Ordinary dividends: $1,400 (reported on 18.0% of returns)
Here:
$1,400
State:
$7,786
(% of AGI for various income ranges: 1.2% for AGIs $25k-50k, 0.2% for AGIs $50k-75k, 1.1% for AGIs $100k-200k)
Net capital gain/loss in AGI: +$15,186 (reported on 11.5% of returns)
Here:
+$15,186
State:
+$22,183
(% of AGI for various income ranges: 0.6% for AGIs $50k-75k, 18.5% for AGIs $100k-200k)
Profit/loss from business: +$2,264 (reported on 18.0% of returns)
Here:
+$2,264
State:
+$12,903
(% of AGI for various income ranges: 5.8% for AGIs below $25k, 1.0% for AGIs $25k-50k, 0.5% for AGIs $75k-100k)
Taxable individual retirement arrangement distribution: $7,200 (reported on 6.6% of returns)
61912:
$7,200
Illinois:
$17,929
Total itemized deductions: $18,182 (16% of AGI, reported on 18.0% of returns)
Here:
$18,182
State:
$26,433
Here:
15.9% of AGI
State:
19.2% of AGI
(% of AGI for various income ranges: 5.9% for AGIs $25k-50k, 5.6% for AGIs $50k-75k, 8.3% for AGIs $75k-100k, 14.7% for AGIs $100k-200k)
Charity contributions: $4,257 (reported on 11.5% of returns)
Here:
$4,257
State:
$4,525
(% of AGI for various income ranges: 2.0% for AGIs $50k-75k, 3.0% for AGIs $100k-200k)
Taxes paid: $6,718 (reported on 18.0% of returns)
61912:
$6,718
State:
$11,968
(% of AGI for various income ranges: 1.4% for AGIs $25k-50k, 1.4% for AGIs $50k-75k, 2.9% for AGIs $75k-100k, 7.3% for AGIs $100k-200k)
Earned income credit: $2,380 (reported on 16.4% of returns)
Here:
$2,380
State:
$2,349
(% of AGI for various income ranges: 6.4% for AGIs below $25k, 0.9% for AGIs $25k-50k)
Percentage of individuals using paid preparers for their 2012 taxes: 59.0%
Here:
59%
State:
57%
(% for various income ranges: 42.9% for AGIs below $25k, 61.1% for AGIs $25k-50k, 60.0% for AGIs $50k-75k, 83.3% for AGIs $75k-100k, 75.0% for AGIs $100k-200k, 100.0% for AGIs over 200k)
Averages for the 2004 tax year for zip code 61912, filed in 2005:
Average Adjusted Gross Income (AGI) in 2004: $37,330 (Individual Income Tax Returns)
Here:
$37,330
State:
$54,625
Salary/wage: $32,015 (reported on 85.8% of returns)
Here:
$32,015
State:
$46,811
(% of AGI for various income ranges: 103.3% for AGIs below $10k, 76.7% for AGIs $10k-25k, 82.6% for AGIs $25k-50k, 81.0% for AGIs $50k-75k, 83.5% for AGIs $75k-100k, 34.1% for AGIs over 100k)
Taxable interest for individuals: $908 (reported on 50.2% of returns)
This zip code:
$908
Illinois:
$2,101
(% of AGI for various income ranges: 8.0% for AGIs below $10k, 2.2% for AGIs $10k-25k, 0.9% for AGIs $25k-50k, 0.6% for AGIs $50k-75k, 0.3% for AGIs $75k-100k, 1.8% for AGIs over 100k)
Taxable dividends: $1,490 (reported on 16.6% of returns)
Here:
$1,490
State:
$4,306
(% of AGI for various income ranges: 1.7% for AGIs below $10k, 1.2% for AGIs $10k-25k, 0.8% for AGIs $25k-50k, 0.1% for AGIs $50k-75k, 1.3% for AGIs over 100k)
Net capital gain/loss: +$2,114 (reported on 12.6% of returns)
Here:
+$2,114
State:
+$17,321
(% of AGI for various income ranges: -1.1% for AGIs below $10k, 0.2% for AGIs $10k-25k, 0.3% for AGIs $25k-50k, 0.3% for AGIs $50k-75k, 3.2% for AGIs over 100k)
Profit/loss from farming: +$4,190 (reported on 9.3% of returns)
Here:
+$4,190
State:
+$2,327
(% of AGI for various income ranges: 6.5% for AGIs below $10k, -1.4% for AGIs $25k-50k, 4.1% for AGIs $50k-75k, 0.3% for AGIs $75k-100k)
Total itemized deductions: $16,301 (24% of AGI, reported on 14.9% of returns)
Here:
$16,301
State:
$20,239
Here:
24.2% of AGI
State:
19.5% of AGI
(% of AGI for various income ranges: 34.7% for AGIs below $10k, 5.1% for AGIs $25k-50k, 4.5% for AGIs $50k-75k, 8.7% for AGIs $75k-100k, 11.0% for AGIs over 100k)
Charity contributions deductions: $3,171 (4% of AGI, reported on 12.2% of returns)
Here:
$3,171
State:
$3,719
Here:
4.4% of AGI
State:
3.4% of AGI
(% of AGI for various income ranges: 0.8% for AGIs $25k-50k, 1.0% for AGIs $50k-75k, 1.7% for AGIs $75k-100k, 1.8% for AGIs over 100k)
Total tax: $5,026 (reported on 73.4% of returns)
61912:
$5,026
State:
$9,882
(% of AGI for various income ranges: 2.3% for AGIs below $10k, 3.6% for AGIs $10k-25k, 6.8% for AGIs $25k-50k, 8.5% for AGIs $50k-75k, 12.5% for AGIs $75k-100k, 20.1% for AGIs over 100k)
Earned income credit: $1,842 (reported on 16.2% of returns)
Here:
$1,842
State:
$1,788
Percentage of individuals using paid preparers for their 2004 taxes: 63.7%
Here:
64%
State:
61%
(% for various income ranges: 53.5% for AGIs below $10k, 62.6% for AGIs $10k-25k, 68.2% for AGIs $25k-50k, 65.5% for AGIs $50k-75k, 60.6% for AGIs $75k-100k, 87.5% for AGIs over 100k)
Household received Food Stamps/SNAP in the past 12 months: 81 Household did not receive Food Stamps/SNAP in the past 12 months: 468
Women who had a birth in the past 12 months: 24 (20 now married, 3 unmarried) Women who did not have a birth in the past 12 months: 229 (103 now married, 125 unmarried)
Housing units in zip code 61912 with a mortgage: 222 (19 second mortgage, 14 both second mortgage and home equity loan) Houses without a mortgage: 27
Median monthly owner costs for units with a mortgage: $835 Median monthly owner costs for units without a mortgage: $566
Residents with income below the poverty level in 2022:
This zip code:
15.7%
Whole state:
11.9%
Residents with income below 50% of the poverty level in 2022:
This zip code:
9.2%
Whole state:
5.7%
Median number of rooms in houses and condos:
Here:
6.3
State:
6.4
Median number of rooms in apartments:
Here:
4.9
State:
4.1
Notable locations in this zip code not listed on our city pages
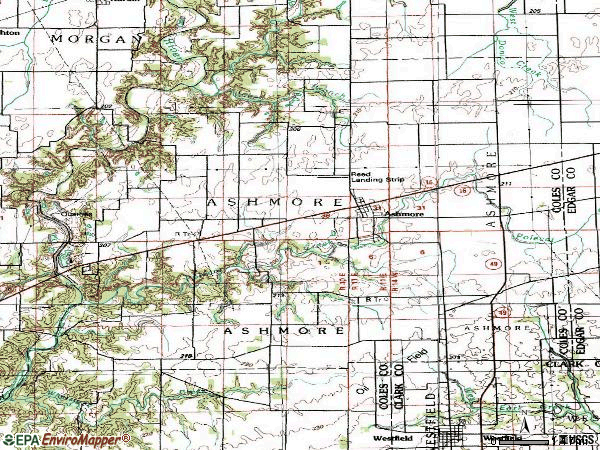
Churches in zip code 61912 include: Ashmore Baptist Church (A), Ashmore United Presbyterian Church (B), Enon Baptist Church (C). Display/hide their locations on the map
Cemeteries: Shoot Cemetery (1), Enon Cemetery (2), Ashmore Cemetery (3), Brooks Cemetery (4), Lafler Cemetery (5), Miller Cemetery (6), Reed Cemetery (7). Display/hide their locations on the map
Streams, rivers, and creeks: Dudley Branch (A), Little Embarras River (B), Rattlesnake Creek (C), Polecat Creek (D), Franklin Branch (E). Display/hide their locations on the map
Size of family households: 222 2-persons, 91 3-persons, 25 4-persons, 31 5-persons, 3 6-persons
Size of nonfamily households: 136 1-person, 39 2-persons
125 married couples with children.
56 single-parent households (3 men, 53 women).
99.6% of residents of 61912 zip code speak English at home.
Foreign born population: 0 (0.0%)
:
0.0%
Whole state:
14.4%
30%English
18%German
15%American
8%Irish
3%Italian
2%French
1%Welsh
Year of entry for the foreign-born population
02010 or later
02000 to 2009
01990 to 1999
7Before 1990
Facilities with environmental interests located in this zip code:
ASHMORE GRAIN COMPANY (R.R., 1/4 MI. N. OF ROUTE 16 in ASHMORE, IL)
STATE MASTER (Illinois EPA Project) - National Pollutant Discharge Elimination System Permit AIR MINOR (AIRS/AFS) CRITERIA AND HAZARDOUS AIR POLLUTANT INVENTORY (Inventory of air pollution sources) National Pollutant Discharge Elimination System NON-MAJOR (Tracking pollutant discharge elimination systems) - permit Business SIC classification: GRAIN AND FIELD BEANS
AGRICO CHEMICAL CO (RAILROAD ST in ASHMORE, IL)
STATE MASTER (Illinois EPA Project) - AIR PROGRAM AIR MINOR (AIRS/AFS) CRITERIA AND HAZARDOUS AIR POLLUTANT INVENTORY (Inventory of air pollution sources) Business SIC classification: FARM SUPPLIES
ASHMORE WTP (1306 S. IOWA STREET in ASHMORE, IL)
STATE MASTER (Illinois EPA Project) - National Pollutant Discharge Elimination System Permit National Pollutant Discharge Elimination System NON-MAJOR (Tracking pollutant discharge elimination systems) - permit Business SIC classification: WATER SUPPLY Alternative names: ASHMORE WTP, VILLAGE OF
MARATHON PIPELINE CO ASHMORE STATION (RURAL in ASHMORE, IL)
STATE MASTER (Illinois EPA Project) - AIR PROGRAM, SOLID WASTE PROGRAM AIR MINOR (AIRS/AFS) Business SIC classification: REFINED PETROLEUM PIPELINES
MARATHON PIPELINE LLC (10151 N CR 2170 E in ASHMORE, IL)
STATE MASTER (Illinois EPA Project) - HAZARDOUS WASTE PROGRAM Conditionally Exempt Small Quantity Generators, less than 100 kg/month of hazardous waste (Resource Conservation and Recovery Act (tracking hazardous waste))
OWENS MINI SERVICE (113 ASHMORE ST in ASHMORE, IL)
STATE MASTER (Illinois EPA Project) - HAZARDOUS WASTE PROGRAM Small Quantity Generators, between 100 kg and 1000 kg of hazardous waste/month (Resource Conservation and Recovery Act (tracking hazardous waste)) - notification Organizations: OWEN LENORA B (CONTACT/OWNER)
ASHMORE ELEM SCHOOL (P O BOX 219 in ASHMORE, IL)
(National Center for Education Statistics) - STATE ID-1101500102007 Organizations: CHARLESTON C U SCHOOL DIST 1 (SCHOOL DISTRICT)
AMEREN CIPS (24818 E CR 850N in ASHMORE, IL)
Small Quantity Generators, between 100 kg and 1000 kg of hazardous waste/month (Resource Conservation and Recovery Act (tracking hazardous waste))
ASHMORE AMMONIA (EAST SIDE OF TOWN NORTH OF RT 16 in ASHMORE, IL)
ENFORCEMENT/COMPLIANCE ACTIVITY (Integrated Compliance Information System)
Housing units lacking complete plumbing facilities: 0.7% Housing units lacking complete kitchen facilities: 0.7%
52.6%Utility gas
36.8%Electricity
9.9%Bottled, tank, or LP gas
0.9%Solar energy
Population in 1990: 1,467.
Place of birth for U.S.-born residents:
This state: 892
Northeast: 10
Midwest: 159
South: 63
West: 19
65% of the 61912 zip code residents lived in the same house 5 years ago. Out of people who lived in different houses, 62% lived in this county. Out of people who lived in different counties, 50% lived in Illinois.
93% of the 61912 zip code residents lived in the same house 1 year ago. Out of people who lived in different houses, 54% moved from this county. Out of people who lived in different houses, 34% moved from different county within same state. Out of people who lived in different houses, 10% moved from different state.
Private vs. public school enrollment:
Students in private schools in grades 1 to 8 (elementary and middle school): 10
Here:
14.5%
Illinois:
13.3%
Students in private schools in grades 9 to 12 (high school):
Here:
0.0%
Illinois:
9.9%
Students in private undergraduate colleges: 4
Here:
8.6%
Illinois:
27.4%
Occupation by median earnings in the past 12 months ($)
124,970Transportation occupations
71,768Architecture and engineering occupations
53,948Production occupations
51,716Health technologists and technicians
48,871Installation, maintenance, and repair occupations
47,870Management occupations
Top industries in this zip code by the number of employees in 2005:
Accommodation and Food Services: Limited-Service Restaurants (10-19 employees: 1 establishment)
Wholesale Trade: Grain and Field Bean Merchant Wholesalers (5-9: 1)
Finance and Insurance: Commercial Banking (5-9: 1)
Other Services (except Public Administration): Religious Organizations (1-4: 3)
Accommodation and Food Services: Drinking Places (Alcoholic Beverages) (1-4: 2)
Construction: New Single-Family Housing Construction (except Operative Builders) (1-4: 1)
Real Estate and Rental and Leasing: Offices of Real Estate Agents and Brokers (1-4: 1)
Construction: All Other Specialty Trade Contractors (1-4: 1)
Fatal accident statistics in 2011:
Fatal accident count: 2
Vehicles involved in fatal accidents: 2
Fatal accidents caused by drunken drivers: 1
Fatalities: 2
Persons involved in fatal accidents: 4
Pedestrians involved in fatal accidents: 0
2002 - 2018 National Fire Incident Reporting System (NFIRS) incidents
Based on the data from the years 2002 - 2018 the average number of fire incidents per year is 9. The highest number of fire incidents - 20 took place in 2011, and the least - 2 in 2007. The data has a declining trend.
When looking into fire subcategories, the most incidents belonged to: Outside Fires (44.2%), and Structure Fires (24.7%).
Fire incident types reported to NFIRS in Zip Code 61912

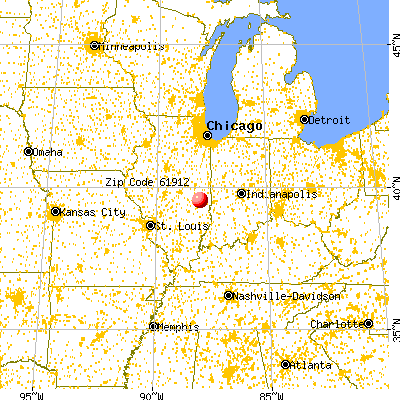


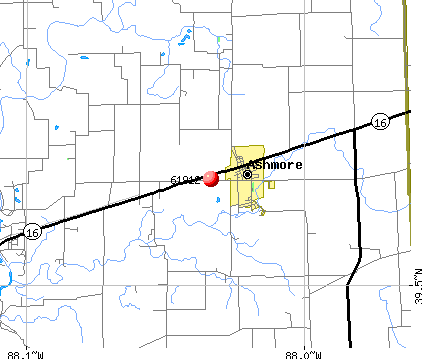 Nearest zip codes: 62474, 61920, 61933, 61943, 61930, 61949.


 Based on the data from the years 2002 - 2018 the average number of fire incidents per year is 9. The highest number of fire incidents - 20 took place in 2011, and the least - 2 in 2007. The data has a declining trend.
 When looking into fire subcategories, the most incidents belonged to: Outside Fires (44.2%), and Structure Fires (24.7%).