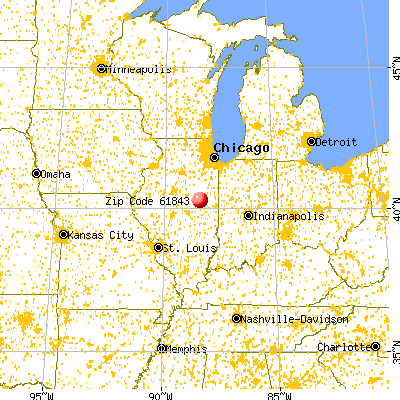
Estimated zip code population in 2022: 2,108 Zip code population in 2010: 2,363 Zip code population in 2000: 2,072
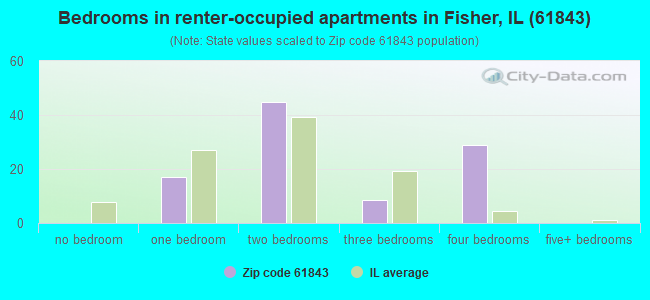
Houses and condos: 845 Renter-occupied apartments: 101
% of renters here:
13%
State:
33%
March 2022 cost of living index in zip code 61843: 84.6 (less than average, U.S. average is 100)
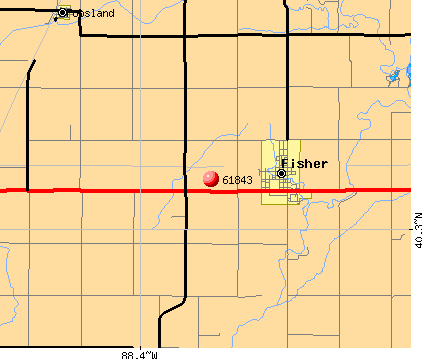
Land area: 38.0 sq. mi. Water area: 0.2 sq. mi.
Population density: 55 people per square mile
(very low).
OSM Map
General Map
Google Map
MSN Map
OSM Map
General Map
Google Map
MSN Map
OSM Map
General Map
Google Map
MSN Map
OSM Map
General Map
Google Map
MSN Map
Please wait while loading the map...
Real estate property taxes paid for housing units in 2022:
This zip code:
1.8% ($3,186)
Illinois:
2.0% ($4,912)
Median real estate property taxes paid for housing units with mortgages in 2022: $3,337 (1.9%) Median real estate property taxes paid for housing units with no mortgage in 2022: $2,807 (1.8%)
Business Search- 14 Million verified businesses
Males: 1,123
(53.3%)
Females: 984
(46.7%)
For population 25 years and over in 61843:
High school or higher: 97.3%
Bachelor's degree or higher: 25.0%
Graduate or professional degree: 6.3%
Unemployed: 2.4%
Mean travel time to work (commute): 25.3 minutes
For population 15 years and over in 61843:
Never married: 27.3%
Now married: 59.6%
Separated: 0.3%
Widowed: 2.7%
Divorced: 10.0%
Zip code 61843 compared to state average:
Unemployed percentage below state average.
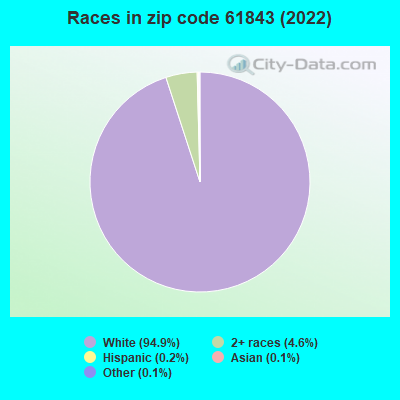
Black race population percentage significantly below state average.
Hispanic race population percentage significantly below state average.
Foreign-born population percentage significantly below state average.
Renting percentage significantly below state average.
Length of stay since moving in significantly above state average.
Percentage of population with a bachelor's degree or higher below state average.
Estimated median house/condo value in 2022: $173,731
61843:
$173,731
Illinois:
$251,600
According to our research of Illinois and other state lists, there were 2 registered sex offenders living in 61843 zip code as of May 29, 2024. The ratio of all residents to sex offenders in zip code 61843 is 1,180 to 1. The ratio of registered sex offenders to all residents in this zip code is lower than the state average.
Median resident age:
This zip code:
36.7 years
Illinois median age:
39.1 years
Average household size:
This zip code:
2.6 people
Illinois:
2.4 people
Averages for the 2020 tax year for zip code 61843, filed in 2021:
Average Adjusted Gross Income (AGI) in 2020: $63,557 (Individual Income Tax Returns)
Here:
$63,557
State:
$82,626
Salary/wage: $55,222 (reported on 80.0% of returns)
Here:
$55,222
State:
$66,640
(% of AGI for various income ranges: 1060.0% for AGIs below $25k, 3320.8% for AGIs $25k-50k, 5785.0% for AGIs $50k-75k, 9283.0% for AGIs $75k-100k, 15162.9% for AGIs $100k-200k)
Taxable interest for individuals: $822 (reported on 40.0% of returns)
This zip code:
$822
Illinois:
$2,376
(% of AGI for various income ranges: 21.2% for AGIs below $25k, 20.4% for AGIs $25k-50k, 73.6% for AGIs $50k-75k, 31.0% for AGIs $75k-100k, 85.0% for AGIs $100k-200k)
Ordinary dividends: $2,675 (reported on 19.2% of returns)
Here:
$2,675
State:
$9,061
(% of AGI for various income ranges: 14.8% for AGIs below $25k, 20.8% for AGIs $25k-50k, 40.7% for AGIs $50k-75k, 150.0% for AGIs $75k-100k, 190.0% for AGIs $100k-200k)
Net capital gain/loss in AGI: +$7,245 (reported on 16.0% of returns)
Here:
+$7,245
State:
+$31,684
(% of AGI for various income ranges: 13.2% for AGIs below $25k, 17.7% for AGIs $25k-50k, 33.6% for AGIs $50k-75k, 175.0% for AGIs $75k-100k, 820.0% for AGIs $100k-200k)
Profit/loss from business: +$9,572 (reported on 14.4% of returns)
Here:
+$9,572
State:
+$12,175
(% of AGI for various income ranges: 82.4% for AGIs below $25k, 92.3% for AGIs $25k-50k, 319.3% for AGIs $50k-75k, 592.9% for AGIs $100k-200k)
Taxable individual retirement arrangement distribution: $12,788 (reported on 13.6% of returns)
61843:
$12,788
Illinois:
$21,613
(% of AGI for various income ranges: 87.2% for AGIs below $25k, 95.0% for AGIs $25k-50k, 253.6% for AGIs $50k-75k, 396.0% for AGIs $75k-100k, 684.3% for AGIs $100k-200k)
Total itemized deductions: $31,750 (reported on 3.2% of returns)
Here:
$31,750
State:
$34,948
(% of AGI for various income ranges: 1270.0% for AGIs $75k-100k)
Charity contributions: $8,467 (reported on 2.4% of returns)
Here:
$8,467
State:
$13,122
(% of AGI for various income ranges: 254.0% for AGIs $75k-100k)
Taxes paid: $7,800 (reported on 3.2% of returns)
61843:
$7,800
State:
$8,563
(% of AGI for various income ranges: 312.0% for AGIs $75k-100k)
Earned income credit: $2,444 (reported on 12.8% of returns)
Here:
$2,444
State:
$2,311
(% of AGI for various income ranges: 80.0% for AGIs below $25k, 73.5% for AGIs $25k-50k)
Percentage of individuals using paid preparers for their 2020 taxes: 92.0%
Here:
92%
State:
93%
(% for various income ranges: 91.2% for AGIs below $25k, 93.5% for AGIs $25k-50k, 90.0% for AGIs $50k-75k, 93.3% for AGIs $75k-100k, 95.2% for AGIs $100k-200k, 75.0% for AGIs over 200k)
Averages for the 2012 tax year for zip code 61843, filed in 2013:
Average Adjusted Gross Income (AGI) in 2012: $52,215 (Individual Income Tax Returns)
Here:
$52,215
State:
$68,058
Salary/wage: $45,624 (reported on 82.9% of returns)
Here:
$45,624
State:
$55,396
(% of AGI for various income ranges: 75.6% for AGIs below $25k, 70.9% for AGIs $25k-50k, 76.6% for AGIs $50k-75k, 79.7% for AGIs $75k-100k, 65.5% for AGIs $100k-200k)
Taxable interest for individuals: $1,187 (reported on 39.3% of returns)
This zip code:
$1,187
Illinois:
$1,969
(% of AGI for various income ranges: 1.3% for AGIs below $25k, 0.8% for AGIs $25k-50k, 0.6% for AGIs $50k-75k, 0.7% for AGIs $75k-100k, 1.1% for AGIs $100k-200k)
Ordinary dividends: $2,058 (reported on 20.5% of returns)
Here:
$2,058
State:
$7,786
(% of AGI for various income ranges: 0.9% for AGIs below $25k, 0.7% for AGIs $25k-50k, 0.5% for AGIs $50k-75k, 0.8% for AGIs $75k-100k, 1.0% for AGIs $100k-200k)
Net capital gain/loss in AGI: +$4,138 (reported on 13.7% of returns)
Here:
+$4,138
State:
+$22,183
(% of AGI for various income ranges: 0.4% for AGIs below $25k, 0.1% for AGIs $25k-50k, 0.6% for AGIs $75k-100k, 2.6% for AGIs $100k-200k)
Profit/loss from business: +$7,544 (reported on 15.4% of returns)
Here:
+$7,544
State:
+$12,903
(% of AGI for various income ranges: 7.7% for AGIs below $25k, 2.9% for AGIs $25k-50k, 2.3% for AGIs $50k-75k, 1.9% for AGIs $75k-100k, 0.9% for AGIs $100k-200k)
Taxable individual retirement arrangement distribution: $9,993 (reported on 12.0% of returns)
61843:
$9,993
Illinois:
$17,929
(% of AGI for various income ranges: 3.5% for AGIs below $25k, 3.4% for AGIs $25k-50k, 1.8% for AGIs $50k-75k, 5.2% for AGIs $75k-100k)
Total itemized deductions: $17,729 (20% of AGI, reported on 29.9% of returns)
Here:
$17,729
State:
$26,433
Here:
20.1% of AGI
State:
19.2% of AGI
(% of AGI for various income ranges: 9.9% for AGIs $25k-50k, 9.8% for AGIs $50k-75k, 11.5% for AGIs $75k-100k, 12.0% for AGIs $100k-200k)
Charity contributions: $3,380 (reported on 21.4% of returns)
Here:
$3,380
State:
$4,525
(% of AGI for various income ranges: 1.3% for AGIs $25k-50k, 1.0% for AGIs $50k-75k, 1.3% for AGIs $75k-100k, 2.0% for AGIs $100k-200k)
Taxes paid: $7,269 (reported on 29.9% of returns)
61843:
$7,269
State:
$11,968
(% of AGI for various income ranges: 2.9% for AGIs $25k-50k, 3.8% for AGIs $50k-75k, 4.9% for AGIs $75k-100k, 5.4% for AGIs $100k-200k)
Earned income credit: $2,528 (reported on 15.4% of returns)
Here:
$2,528
State:
$2,349
(% of AGI for various income ranges: 7.3% for AGIs below $25k, 1.1% for AGIs $25k-50k)
Percentage of individuals using paid preparers for their 2012 taxes: 53.0%
Here:
53%
State:
57%
(% for various income ranges: 45.0% for AGIs below $25k, 51.9% for AGIs $25k-50k, 55.0% for AGIs $50k-75k, 60.0% for AGIs $75k-100k, 66.7% for AGIs $100k-200k)
Averages for the 2004 tax year for zip code 61843, filed in 2005:
Average Adjusted Gross Income (AGI) in 2004: $40,574 (Individual Income Tax Returns)
Here:
$40,574
State:
$54,625
Salary/wage: $35,621 (reported on 85.2% of returns)
Here:
$35,621
State:
$46,811
(% of AGI for various income ranges: 89.9% for AGIs below $10k, 73.1% for AGIs $10k-25k, 76.7% for AGIs $25k-50k, 78.8% for AGIs $50k-75k, 76.1% for AGIs $75k-100k, 62.3% for AGIs over 100k)
Taxable interest for individuals: $1,450 (reported on 52.2% of returns)
This zip code:
$1,450
Illinois:
$2,101
(% of AGI for various income ranges: 7.7% for AGIs below $10k, 3.4% for AGIs $10k-25k, 1.5% for AGIs $25k-50k, 1.2% for AGIs $50k-75k, 1.2% for AGIs $75k-100k, 2.7% for AGIs over 100k)
Taxable dividends: $1,058 (reported on 23.4% of returns)
Here:
$1,058
State:
$4,306
(% of AGI for various income ranges: 1.3% for AGIs below $10k, 1.2% for AGIs $10k-25k, 0.6% for AGIs $25k-50k, 0.5% for AGIs $50k-75k, 0.5% for AGIs $75k-100k, 0.6% for AGIs over 100k)
Net capital gain/loss: +$2,112 (reported on 16.6% of returns)
Here:
+$2,112
State:
+$17,321
(% of AGI for various income ranges: -0.1% for AGIs below $10k, 1.2% for AGIs $10k-25k, 0.2% for AGIs $25k-50k, 0.8% for AGIs $50k-75k, 0.9% for AGIs $75k-100k, 2.0% for AGIs over 100k)
Profit/loss from business: +$8,006 (reported on 16.0% of returns)
Here:
+$8,006
State:
+$11,771
(% of AGI for various income ranges: 8.0% for AGIs below $10k, 2.6% for AGIs $10k-25k, 3.5% for AGIs $25k-50k, 2.4% for AGIs $50k-75k, 0.5% for AGIs $75k-100k, 6.7% for AGIs over 100k)
Profit/loss from farming: +$6,548 (reported on 3.0% of returns)
Here:
+$6,548
State:
+$2,327
IRA payment deduction: $2,519 (reported on 2.6% of returns)
61843:
$2,519
Illinois:
$3,087
Total itemized deductions: $14,993 (23% of AGI, reported on 26.5% of returns)
Here:
$14,993
State:
$20,239
Here:
22.8% of AGI
State:
19.5% of AGI
(% of AGI for various income ranges: 12.5% for AGIs $10k-25k, 8.7% for AGIs $25k-50k, 9.2% for AGIs $50k-75k, 10.6% for AGIs $75k-100k, 11.1% for AGIs over 100k)
Charity contributions deductions: $2,686 (4% of AGI, reported on 23.6% of returns)
Here:
$2,686
State:
$3,719
Here:
4.0% of AGI
State:
3.4% of AGI
(% of AGI for various income ranges: 1.9% for AGIs $10k-25k, 1.3% for AGIs $25k-50k, 1.3% for AGIs $50k-75k, 1.8% for AGIs $75k-100k, 2.2% for AGIs over 100k)
Total tax: $4,880 (reported on 76.2% of returns)
61843:
$4,880
State:
$9,882
(% of AGI for various income ranges: 3.3% for AGIs below $10k, 3.9% for AGIs $10k-25k, 6.2% for AGIs $25k-50k, 8.3% for AGIs $50k-75k, 10.5% for AGIs $75k-100k, 17.3% for AGIs over 100k)
Earned income credit: $1,646 (reported on 12.7% of returns)
Here:
$1,646
State:
$1,788
Percentage of individuals using paid preparers for their 2004 taxes: 56.8%
Here:
57%
State:
61%
(% for various income ranges: 46.9% for AGIs below $10k, 62.3% for AGIs $10k-25k, 57.9% for AGIs $25k-50k, 58.5% for AGIs $50k-75k, 60.9% for AGIs $75k-100k, 50.0% for AGIs over 100k)
Likely homosexual households (counted as self-reported same-sex unmarried-partner households)
Lesbian couples: 0.5% of all households
Gay men: 0.0% of all households
Household received Food Stamps/SNAP in the past 12 months: 56 Household did not receive Food Stamps/SNAP in the past 12 months: 736
Women who had a birth in the past 12 months: 29 (6 now married, 23 unmarried) Women who did not have a birth in the past 12 months: 384 (202 now married, 180 unmarried)
Housing units in zip code 61843 with a mortgage: 450 (27 second mortgage, 13 both second mortgage and home equity loan) Houses without a mortgage: 14
Median monthly owner costs for units with a mortgage: $1,306 Median monthly owner costs for units without a mortgage: $596
Residents with income below the poverty level in 2022:
This zip code:
3.2%
Whole state:
11.9%
Residents with income below 50% of the poverty level in 2022:
This zip code:
1.8%
Whole state:
5.7%
Median number of rooms in houses and condos:
Here:
6.1
State:
6.4
Median number of rooms in apartments:
Here:
4.2
State:
4.1
Notable locations in this zip code not listed on our city pages
Churches in zip code 61843 include: East Bend Mennonite Church (A), Fisher Church of Christ (B), Fisher United Methodist Church (C). Display/hide their locations on the map
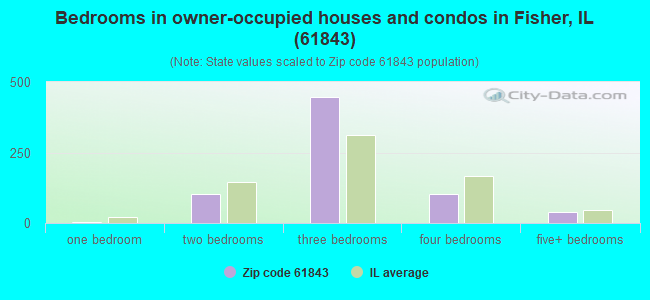
Size of family households: 307 2-persons, 133 3-persons, 130 4-persons, 38 5-persons, 5 6-persons
Size of nonfamily households: 103 1-person, 53 2-persons, 27 4-persons
337 married couples with children.
98 single-parent households (62 men, 36 women).
98.8% of residents of 61843 zip code speak English at home.
0.3% of residents speak Spanish at home (100% very well).
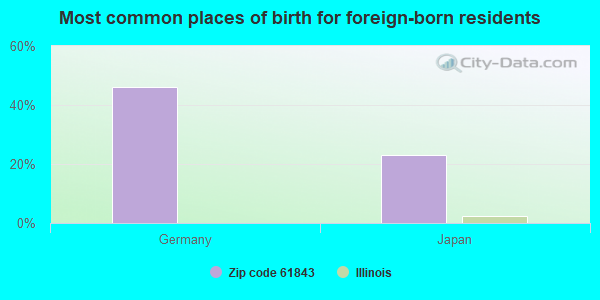
Foreign born population: 13 (0.6%) (100.0% of them are naturalized citizens)
This zip code:
0.6%
Whole state:
14.4%
46%Germany
23%Japan
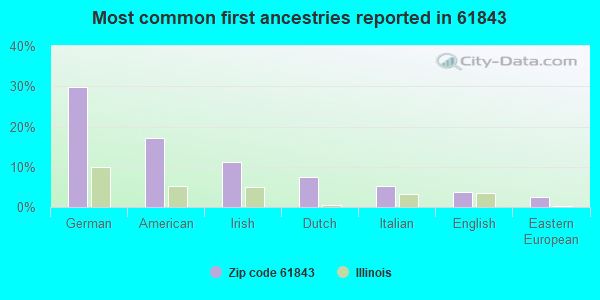
30%German
17%American
11%Irish
8%Dutch
5%Italian
4%English
2%Eastern European
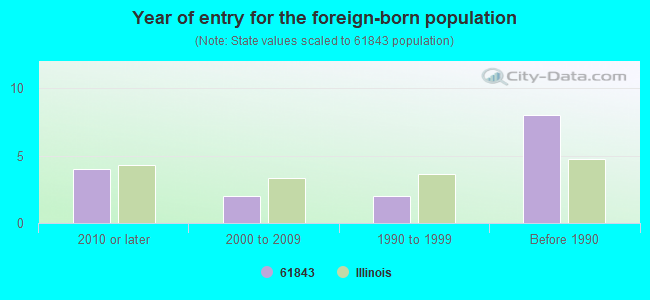
Year of entry for the foreign-born population
42010 or later
22000 to 2009
21990 to 1999
8Before 1990
Facilities with environmental interests located in this zip code:
PEOPLES GAS LIGHT & COKE CO (230 E COUNTY RD 2800 N in FISHER, IL)
STATE MASTER (Illinois EPA Project) - HAZARDOUS WASTE PROGRAM, AIR PROGRAM, SOLID WASTE PROGRAM AIR MAJOR (AIRS/AFS) CRITERIA AND HAZARDOUS AIR POLLUTANT INVENTORY (Inventory of air pollution sources) National Pollutant Discharge Elimination System NON-MAJOR (Tracking pollutant discharge elimination systems) - permit National Pollutant Discharge Elimination System NON-MAJOR (Tracking pollutant discharge elimination systems) - permit Small Quantity Generators, between 100 kg and 1000 kg of hazardous waste/month (Resource Conservation and Recovery Act (tracking hazardous waste)) - notification Business SIC classification: NATURAL GAS TRANSMISSION Business NAICS classification: PIPELINE TRANSPORTATION OF NATURAL GAS. Organizations: THE PEOPLES GAS LIGHT AND COKE COMPANY (CONTACT/OWNER)
Alternative names: PEOPLES ENERGY-FISHER, PEOPLES GAS LIGHT & COKE COMPANY MANLOVE STOR, PEOPLES GAS LIGHT&COKE-MANLOVE
HEISER OIL AND GAS (P.O. BOX 315 in FISHER, IL)
STATE MASTER (Illinois EPA Project) - AIR PROGRAM AIR MINOR (AIRS/AFS) Business SIC classification: PETROLEUM BULK STATIONS AND TERMINALS
ILLINI FS INC (R 136 FISHER in FISHER, IL)
STATE MASTER (Illinois EPA Project) - AIR PROGRAM AIR MINOR (AIRS/AFS) Business SIC classification: PETROLEUM BULK STATIONS AND TERMINALS
KAISER AGRICULTURAL CHEMICALS (414 N FIRST ST in FISHER, IL)
(Resource Conservation and Recovery Act (tracking hazardous waste))
ILLINI FS, INC. - FISHER NH3 (3133 COUNTY RD 600 E in FISHER, IL)
Small Quantity Generators, between 100 kg and 1000 kg of hazardous waste/month (Resource Conservation and Recovery Act (tracking hazardous waste))
71.6%Utility gas
13.8%Electricity
10.2%Bottled, tank, or LP gas
3.1%Wood
1.1%Fuel oil, kerosene, etc.
0.5%Other fuel
Population in 1990: 2,823.
Place of birth for U.S.-born residents:
This state: 1,788
Northeast: 54
Midwest: 100
South: 85
West: 51
63% of the 61843 zip code residents lived in the same house 5 years ago. Out of people who lived in different houses, 71% lived in this county. Out of people who lived in different counties, 50% lived in Illinois.
94% of the 61843 zip code residents lived in the same house 1 year ago. Out of people who lived in different houses, 29% moved from this county. Out of people who lived in different houses, 30% moved from different county within same state. Out of people who lived in different houses, 43% moved from different state.
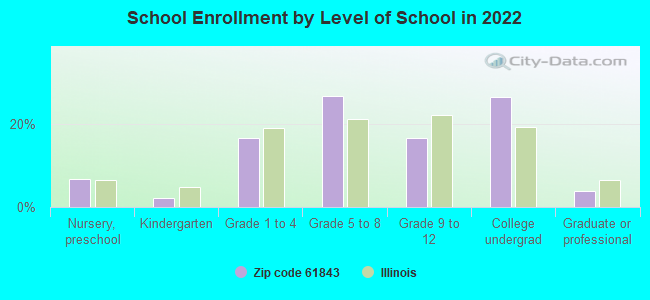
Private vs. public school enrollment:
Students in private schools in grades 1 to 8 (elementary and middle school): 9
Here:
4.1%
Illinois:
13.3%
Students in private schools in grades 9 to 12 (high school):
Here:
0.0%
Illinois:
9.9%
Students in private undergraduate colleges: 18
Here:
13.3%
Illinois:
27.4%
Occupation by median earnings in the past 12 months ($)
78,557Construction and extraction occupations
70,309Management occupations
65,556Farming, fishing, and forestry occupations
64,550Business and financial operations occupations
62,036Health diagnosing and treating practitioners and other technical occupations
61,071Architecture and engineering occupations
Companies with federal contracts located in this zip code:
PRAXSYM INC (120 S THIRD ST in FISHER, IL; small business) 9 employees, $911451 revenue: $852,489 in 13 contractsfrom 2000 to 2005
Contracts for Electrical and Electronic Properties Measuring and Testing Instruments, Phonographs, Radio and Television Sets: Home Type, Wire and Cable, Electrical, Miscellaneous Electrical and Electronic Components, and moreby Department of State Signed by year:2000: $42,000; 2001: $40,000; 2002: $94,000; 2003: $516,000; 2004: $91,947; 2005: $68,542; 2006: $0.
Biggest contracts:
$333,000 with Department of State for Electrical and Electronic Properties Measuring and Testing Instruments. Taking place in VA. Signed on 2003-09-15. Completion date: 2003-12-15.
$62,000, same as above.Signed on 2003-05-15. Completion date: 2003-09-15.
$62,000, same as above.Signed on 2003-09-15. Completion date: 2003-10-15.
$59,000 with Department of State for Electrical and Electronic Properties Measuring and Testing Instruments. Signed on 2003-09-15. Completion date: 2004-01-15.
JDJC CORP (105 S THIRD ST in FISHER, IL; small business) : $193,125 in 5 contractsfrom 2002 to 2006
Contracts for Laboratory Equipment and Supplies by Army Signed by year:2000: $0; 2001: $0; 2002: $36,990; 2003: $0; 2004: $42,000; 2005: $30,245; 2006: $83,890.
Biggest contracts:
$82,440 with Army for Laboratory Equipment and Supplies. Signed on 2006-01-09. Completion date: 2006-02-13.
$42,000, same as above.Signed on 2004-03-10. Completion date: 2004-04-30.
$36,990, same as above.Signed on 2002-03-04. Completion date: 2002-06-30.
$30,245, same as above.Signed on 2005-04-27. Completion date: 2005-07-18.
WIGGINS, DONALD H (306 E FRANKLIN ST in FISHER, IL; small business) : $26,500 in 4 contractsin 2005
$20,500 with Indian Affairs (Assistant Secretary) for Pipe, Tube and Rigid Tubing. Taking place in MS. Signed on 2005-09-09. Completion date: 2005-12-30.
$8,000 with Army for Program Review/Development Services. Signed on 2005-09-27. Completion date: 2005-12-15.
$6,000 with Army for Historical Studies. Signed on 2005-06-16. Completion date: 2005-08-30.
-$8,000 with Army for Program Review/Development Services. Signed on 2005-09-28. Completion date: 2005-12-15.
Top industries in this zip code by the number of employees in 2005:
Utilities: Natural Gas Distribution (20-49 employees: 1 establishment)
Accommodation and Food Services: Full-Service Restaurants (10-19: 1, 5-9: 1)
Administrative and Support and Waste Management and Remediation Services: Janitorial Services (10-19: 1)
Health Care and Social Assistance: Child Day Care Services (10-19: 1)
Finance and Insurance: Commercial Banking (10-19: 1)
Real Estate and Rental and Leasing: Video Tape and Disc Rental (10-19: 1)
Fatal accident statistics in 2012:
Fatal accident count: 1
Vehicles involved in fatal accidents: 2
Fatal accidents caused by drunken drivers: 0
Fatalities: 1
Persons involved in fatal accidents: 2
Pedestrians involved in fatal accidents: 0
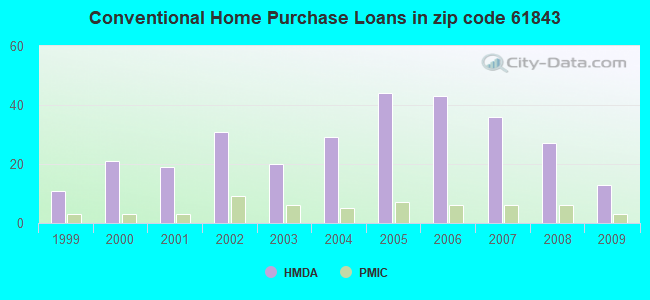
Home Mortgage Disclosure Act Aggregated Statistics For Year 2009 (Based on 2 partial tracts)
A) FHA, FSA/RHS & VA Home Purchase Loans
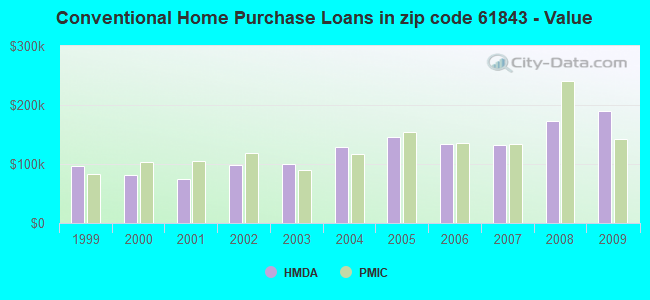
B) Conventional Home Purchase Loans
C) Refinancings
D) Home Improvement Loans
F) Non-occupant Loans on < 5 Family Dwellings (A B C & D)
G) Loans On Manufactured Home Dwelling (A B C & D)
Number
Average Value
Number
Average Value
Number
Average Value
Number
Average Value
Number
Average Value
Number
Average Value
LOANS ORIGINATED
7
$128,913
13
$189,877
85
$153,325
5
$99,498
2
$67,555
2
$82,175
APPLICATIONS APPROVED, NOT ACCEPTED
1
$111,640
2
$94,135
8
$168,285
0
$0
0
$0
1
$48,290
APPLICATIONS DENIED
1
$123,600
3
$92,883
14
$160,714
1
$53,160
0
$0
0
$0
APPLICATIONS WITHDRAWN
0
$0
1
$139,990
7
$155,050
0
$0
0
$0
0
$0
FILES CLOSED FOR INCOMPLETENESS
0
$0
0
$0
2
$177,645
0
$0
0
$0
0
$0
Aggregated Statistics For Year 2008 (Based on 2 partial tracts)
A) FHA, FSA/RHS & VA Home Purchase Loans
B) Conventional Home Purchase Loans
C) Refinancings
D) Home Improvement Loans
F) Non-occupant Loans on < 5 Family Dwellings (A B C & D)
G) Loans On Manufactured Home Dwelling (A B C & D)
Number
Average Value
Number
Average Value
Number
Average Value
Number
Average Value
Number
Average Value
Number
Average Value
LOANS ORIGINATED
5
$131,128
27
$172,261
41
$148,102
6
$37,065
4
$105,212
1
$56,260
APPLICATIONS APPROVED, NOT ACCEPTED
0
$0
2
$191,595
6
$136,665
1
$48,730
0
$0
0
$0
APPLICATIONS DENIED
3
$138,217
4
$77,302
15
$138,571
4
$82,952
0
$0
0
$0
APPLICATIONS WITHDRAWN
1
$133,340
4
$211,422
6
$144,270
0
$0
1
$59,360
0
$0
FILES CLOSED FOR INCOMPLETENESS
0
$0
0
$0
0
$0
1
$108,530
0
$0
0
$0
Aggregated Statistics For Year 2007 (Based on 2 partial tracts)
A) FHA, FSA/RHS & VA Home Purchase Loans
B) Conventional Home Purchase Loans
C) Refinancings
D) Home Improvement Loans
F) Non-occupant Loans on < 5 Family Dwellings (A B C & D)
G) Loans On Manufactured Home Dwelling (A B C & D)
Number
Average Value
Number
Average Value
Number
Average Value
Number
Average Value
Number
Average Value
Number
Average Value
LOANS ORIGINATED
2
$184,510
36
$132,186
43
$124,668
14
$47,654
6
$98,272
3
$49,617
APPLICATIONS APPROVED, NOT ACCEPTED
0
$0
4
$130,685
5
$85,056
2
$50,280
0
$0
0
$0
APPLICATIONS DENIED
0
$0
5
$154,430
14
$134,640
8
$32,782
0
$0
1
$55,370
APPLICATIONS WITHDRAWN
0
$0
2
$128,915
6
$130,537
1
$59,800
0
$0
0
$0
FILES CLOSED FOR INCOMPLETENESS
0
$0
1
$111,190
2
$173,435
0
$0
0
$0
0
$0
Aggregated Statistics For Year 2006 (Based on 2 partial tracts)
A) FHA, FSA/RHS & VA Home Purchase Loans
B) Conventional Home Purchase Loans
C) Refinancings
D) Home Improvement Loans
F) Non-occupant Loans on < 5 Family Dwellings (A B C & D)
G) Loans On Manufactured Home Dwelling (A B C & D)
Number
Average Value
Number
Average Value
Number
Average Value
Number
Average Value
Number
Average Value
Number
Average Value
LOANS ORIGINATED
2
$68,885
43
$134,456
31
$142,903
9
$40,707
5
$56,084
1
$38,980
APPLICATIONS APPROVED, NOT ACCEPTED
0
$0
4
$150,952
5
$161,960
2
$37,655
0
$0
0
$0
APPLICATIONS DENIED
0
$0
6
$125,517
16
$111,082
3
$68,960
0
$0
1
$79,300
APPLICATIONS WITHDRAWN
0
$0
0
$0
11
$128,107
0
$0
0
$0
0
$0
FILES CLOSED FOR INCOMPLETENESS
0
$0
1
$85,500
4
$153,168
0
$0
0
$0
0
$0
Aggregated Statistics For Year 2005 (Based on 2 partial tracts)
A) FHA, FSA/RHS & VA Home Purchase Loans
B) Conventional Home Purchase Loans
C) Refinancings
D) Home Improvement Loans
F) Non-occupant Loans on < 5 Family Dwellings (A B C & D)
G) Loans On Manufactured Home Dwelling (A B C & D)
Number
Average Value
Number
Average Value
Number
Average Value
Number
Average Value
Number
Average Value
Number
Average Value
LOANS ORIGINATED
1
$93,030
44
$145,938
42
$131,824
9
$46,368
4
$118,060
0
$0
APPLICATIONS APPROVED, NOT ACCEPTED
0
$0
3
$212,937
4
$183,290
0
$0
0
$0
1
$143,090
APPLICATIONS DENIED
0
$0
9
$139,939
20
$123,553
3
$53,013
1
$167,450
2
$66,005
APPLICATIONS WITHDRAWN
0
$0
1
$112,960
11
$164,111
1
$137,330
1
$171,880
0
$0
FILES CLOSED FOR INCOMPLETENESS
0
$0
1
$145,300
0
$0
0
$0
0
$0
0
$0
Aggregated Statistics For Year 2004 (Based on 2 partial tracts)
A) FHA, FSA/RHS & VA Home Purchase Loans
B) Conventional Home Purchase Loans
C) Refinancings
D) Home Improvement Loans
F) Non-occupant Loans on < 5 Family Dwellings (A B C & D)
G) Loans On Manufactured Home Dwelling (A B C & D)
Number
Average Value
Number
Average Value
Number
Average Value
Number
Average Value
Number
Average Value
Number
Average Value
LOANS ORIGINATED
5
$97,638
29
$128,837
58
$133,358
16
$49,256
4
$45,960
2
$78,630
APPLICATIONS APPROVED, NOT ACCEPTED
0
$0
2
$28,795
7
$107,776
0
$0
0
$0
1
$58,480
APPLICATIONS DENIED
2
$96,795
6
$143,237
27
$98,116
6
$45,187
0
$0
4
$53,602
APPLICATIONS WITHDRAWN
0
$0
1
$111,640
10
$115,667
1
$20,820
0
$0
0
$0
FILES CLOSED FOR INCOMPLETENESS
0
$0
0
$0
6
$140,873
0
$0
0
$0
0
$0
Aggregated Statistics For Year 2003 (Based on 2 partial tracts)
A) FHA, FSA/RHS & VA Home Purchase Loans
B) Conventional Home Purchase Loans
C) Refinancings
D) Home Improvement Loans
F) Non-occupant Loans on < 5 Family Dwellings (A B C & D)
Number
Average Value
Number
Average Value
Number
Average Value
Number
Average Value
Number
Average Value
LOANS ORIGINATED
4
$111,525
20
$99,720
94
$104,586
7
$22,846
4
$56,040
APPLICATIONS APPROVED, NOT ACCEPTED
0
$0
1
$137,770
9
$114,343
1
$43,410
0
$0
APPLICATIONS DENIED
0
$0
3
$94,507
25
$80,396
4
$24,475
0
$0
APPLICATIONS WITHDRAWN
0
$0
2
$90,595
11
$107,326
0
$0
0
$0
FILES CLOSED FOR INCOMPLETENESS
0
$0
1
$123,600
3
$115,180
0
$0
0
$0
Aggregated Statistics For Year 2002 (Based on 2 partial tracts)
A) FHA, FSA/RHS & VA Home Purchase Loans
B) Conventional Home Purchase Loans
C) Refinancings
D) Home Improvement Loans
F) Non-occupant Loans on < 5 Family Dwellings (A B C & D)
Number
Average Value
Number
Average Value
Number
Average Value
Number
Average Value
Number
Average Value
LOANS ORIGINATED
6
$81,143
31
$98,503
73
$107,461
5
$35,174
8
$82,951
APPLICATIONS APPROVED, NOT ACCEPTED
0
$0
1
$171,440
5
$102,688
1
$17,280
0
$0
APPLICATIONS DENIED
0
$0
4
$47,955
16
$79,878
3
$39,723
1
$163,020
APPLICATIONS WITHDRAWN
0
$0
3
$86,680
8
$121,492
0
$0
0
$0
FILES CLOSED FOR INCOMPLETENESS
0
$0
0
$0
4
$139,768
0
$0
0
$0
Aggregated Statistics For Year 2001 (Based on 2 partial tracts)
A) FHA, FSA/RHS & VA Home Purchase Loans
B) Conventional Home Purchase Loans
C) Refinancings
D) Home Improvement Loans
F) Non-occupant Loans on < 5 Family Dwellings (A B C & D)
Number
Average Value
Number
Average Value
Number
Average Value
Number
Average Value
Number
Average Value
LOANS ORIGINATED
4
$98,235
19
$74,261
59
$90,575
10
$32,117
3
$35,883
APPLICATIONS APPROVED, NOT ACCEPTED
0
$0
1
$63,790
4
$84,502
1
$28,790
0
$0
APPLICATIONS DENIED
0
$0
2
$90,815
18
$85,843
2
$27,245
1
$89,930
APPLICATIONS WITHDRAWN
0
$0
0
$0
7
$96,447
2
$5,315
0
$0
FILES CLOSED FOR INCOMPLETENESS
0
$0
0
$0
1
$66,890
0
$0
0
$0
Aggregated Statistics For Year 2000 (Based on 2 partial tracts)
A) FHA, FSA/RHS & VA Home Purchase Loans
B) Conventional Home Purchase Loans
C) Refinancings
D) Home Improvement Loans
F) Non-occupant Loans on < 5 Family Dwellings (A B C & D)
Number
Average Value
Number
Average Value
Number
Average Value
Number
Average Value
Number
Average Value
LOANS ORIGINATED
1
$101,000
21
$81,343
20
$76,373
5
$31,630
1
$89,490
APPLICATIONS APPROVED, NOT ACCEPTED
0
$0
1
$52,270
3
$58,770
0
$0
0
$0
APPLICATIONS DENIED
0
$0
2
$88,380
11
$67,255
2
$23,920
0
$0
APPLICATIONS WITHDRAWN
0
$0
0
$0
6
$73,907
0
$0
0
$0
FILES CLOSED FOR INCOMPLETENESS
0
$0
1
$45,630
0
$0
0
$0
0
$0
Aggregated Statistics For Year 1999 (Based on 1 partial tract)
A) FHA, FSA/RHS & VA Home Purchase Loans
B) Conventional Home Purchase Loans
C) Refinancings
D) Home Improvement Loans
F) Non-occupant Loans on < 5 Family Dwellings (A B C & D)
Detailed PMIC statistics for the following Tracts:0105.00
2002 - 2018 National Fire Incident Reporting System (NFIRS) incidents
Based on the data from the years 2002 - 2018 the average number of fires per year is 8. The highest number of reported fires - 20 took place in 2010, and the least - 0 in 2003. The data has a decreasing trend.
When looking into fire subcategories, the most incidents belonged to: Outside Fires (46.5%), and Structure Fires (37.2%).
Fire incident types reported to NFIRS in Zip Code 61843


 Nearest zip codes: 61845, 61840, 61853, 60936, 61724, 60933.


 Based on the data from the years 2002 - 2018 the average number of fires per year is 8. The highest number of reported fires - 20 took place in 2010, and the least - 0 in 2003. The data has a decreasing trend.
 When looking into fire subcategories, the most incidents belonged to: Outside Fires (46.5%), and Structure Fires (37.2%).