Estimated zip code population in 2022: 1,269 Zip code population in 2010: 1,157 Zip code population in 2000: 1,249
Houses and condos: 506 Renter-occupied apartments: 70
% of renters here:
14%
State:
33%
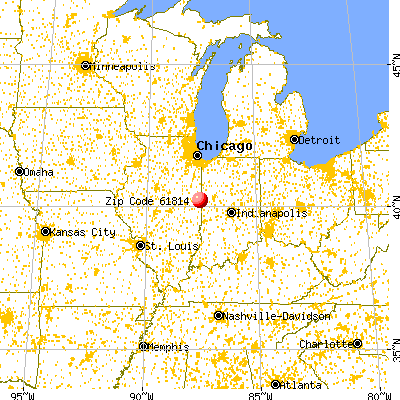
March 2022 cost of living index in zip code 61814: 84.5 (less than average, U.S. average is 100)
Land area: 21.5 sq. mi. Water area: 0.0 sq. mi.
Population density: 59 people per square mile
(very low).
OSM Map
General Map
Google Map
MSN Map
OSM Map
General Map
Google Map
MSN Map
OSM Map
General Map
Google Map
MSN Map
OSM Map
General Map
Google Map
MSN Map
Please wait while loading the map...
Real estate property taxes paid for housing units in 2022:
This zip code:
1.5% ($1,790)
Illinois:
2.0% ($4,912)
Median real estate property taxes paid for housing units with mortgages in 2022: $1,877 (1.4%) Median real estate property taxes paid for housing units with no mortgage in 2022: $1,676 (1.6%)
Business Search- 14 Million verified businesses
Males: 598
(47.2%)
Females: 670
(52.8%)
For population 25 years and over in 61814:
High school or higher: 96.9%
Bachelor's degree or higher: 11.6%
Graduate or professional degree: 5.4%
Unemployed: 4.9%
Mean travel time to work (commute): 20.0 minutes
For population 15 years and over in 61814:
Never married: 20.7%
Now married: 61.6%
Separated: 0.7%
Widowed: 8.3%
Divorced: 8.6%
Zip code 61814 compared to state average:
Median house value below state average.
Black race population percentage significantly below state average.
Hispanic race population percentage significantly below state average.
Foreign-born population percentage significantly below state average.
Renting percentage significantly below state average.
Length of stay since moving in significantly above state average.
Percentage of population with a bachelor's degree or higher significantly below state average.
Estimated median house/condo value in 2022: $121,854
61814:
$121,854
Illinois:
$251,600
Median resident age:
This zip code:
42.3 years
Illinois median age:
39.1 years
Average household size:
This zip code:
2.5 people
Illinois:
2.4 people
Averages for the 2020 tax year for zip code 61814, filed in 2021:
Average Adjusted Gross Income (AGI) in 2020: $62,632 (Individual Income Tax Returns)
Here:
$62,632
State:
$82,626
Salary/wage: $54,089 (reported on 78.0% of returns)
Here:
$54,089
State:
$66,640
(% of AGI for various income ranges: 961.7% for AGIs below $25k, 3216.0% for AGIs $25k-50k, 6868.6% for AGIs $50k-75k, 8438.3% for AGIs $75k-100k, 17733.3% for AGIs $100k-200k)
Taxable interest for individuals: $647 (reported on 32.2% of returns)
This zip code:
$647
Illinois:
$2,376
(% of AGI for various income ranges: 17.5% for AGIs below $25k, 16.0% for AGIs $25k-50k, 17.1% for AGIs $50k-75k, 30.0% for AGIs $75k-100k, 93.3% for AGIs $100k-200k)
Ordinary dividends: $2,040 (reported on 16.9% of returns)
Here:
$2,040
State:
$9,061
(% of AGI for various income ranges: 26.7% for AGIs below $25k, 78.6% for AGIs $50k-75k, 195.0% for AGIs $100k-200k)
Net capital gain/loss in AGI: +$1,756 (reported on 15.3% of returns)
Here:
+$1,756
State:
+$31,684
(% of AGI for various income ranges: 29.2% for AGIs below $25k, 57.1% for AGIs $50k-75k, 138.3% for AGIs $100k-200k)
Profit/loss from business: +$4,171 (reported on 11.9% of returns)
Here:
+$4,171
State:
+$12,175
(% of AGI for various income ranges: 111.0% for AGIs $25k-50k, 301.7% for AGIs $75k-100k)
Taxable individual retirement arrangement distribution: $12,633 (reported on 10.2% of returns)
61814:
$12,633
Illinois:
$21,613
(% of AGI for various income ranges: 325.0% for AGIs $25k-50k, 721.7% for AGIs $75k-100k)
Earned income credit: $2,278 (reported on 15.3% of returns)
Here:
$2,278
State:
$2,311
(% of AGI for various income ranges: 105.8% for AGIs below $25k, 78.0% for AGIs $25k-50k)
Percentage of individuals using paid preparers for their 2020 taxes: 93.2%
Here:
93%
State:
93%
(% for various income ranges: 94.1% for AGIs below $25k, 92.3% for AGIs $25k-50k, 90.0% for AGIs $50k-75k, 100.0% for AGIs $75k-100k, 90.9% for AGIs $100k-200k)
Averages for the 2012 tax year for zip code 61814, filed in 2013:
Average Adjusted Gross Income (AGI) in 2012: $51,230 (Individual Income Tax Returns)
Here:
$51,230
State:
$68,058
Salary/wage: $40,792 (reported on 86.7% of returns)
Here:
$40,792
State:
$55,396
(% of AGI for various income ranges: 74.7% for AGIs below $25k, 76.8% for AGIs $25k-50k, 75.6% for AGIs $50k-75k, 76.8% for AGIs $75k-100k, 53.4% for AGIs $100k-200k)
Taxable interest for individuals: $670 (reported on 33.3% of returns)
This zip code:
$670
Illinois:
$1,969
(% of AGI for various income ranges: 1.1% for AGIs below $25k, 0.5% for AGIs $25k-50k, 0.3% for AGIs $50k-75k, 0.2% for AGIs $75k-100k, 0.5% for AGIs $100k-200k)
Ordinary dividends: $1,308 (reported on 20.0% of returns)
Here:
$1,308
State:
$7,786
(% of AGI for various income ranges: 1.0% for AGIs below $25k, 0.5% for AGIs $25k-50k, 0.7% for AGIs $50k-75k, 0.6% for AGIs $100k-200k)
Profit/loss from business: +$7,150 (reported on 13.3% of returns)
Here:
+$7,150
State:
+$12,903
Taxable individual retirement arrangement distribution: $7,733 (reported on 10.0% of returns)
61814:
$7,733
Illinois:
$17,929
Total itemized deductions: $18,115 (18% of AGI, reported on 21.7% of returns)
Here:
$18,115
State:
$26,433
Here:
18.4% of AGI
State:
19.2% of AGI
(% of AGI for various income ranges: 13.1% for AGIs below $25k, 7.2% for AGIs $50k-75k, 9.4% for AGIs $75k-100k, 9.6% for AGIs $100k-200k)
Charity contributions: $4,378 (reported on 15.0% of returns)
Here:
$4,378
State:
$4,525
(% of AGI for various income ranges: 1.8% for AGIs $25k-50k, 1.4% for AGIs $75k-100k, 2.1% for AGIs $100k-200k)
Taxes paid: $7,415 (reported on 21.7% of returns)
61814:
$7,415
State:
$11,968
(% of AGI for various income ranges: 4.2% for AGIs $50k-75k, 3.6% for AGIs $75k-100k, 4.6% for AGIs $100k-200k)
Earned income credit: $2,100 (reported on 15.0% of returns)
Here:
$2,100
State:
$2,349
(% of AGI for various income ranges: 5.1% for AGIs below $25k, 1.2% for AGIs $25k-50k)
Percentage of individuals using paid preparers for their 2012 taxes: 66.7%
Here:
67%
State:
57%
(% for various income ranges: 61.9% for AGIs below $25k, 66.7% for AGIs $25k-50k, 60.0% for AGIs $50k-75k, 75.0% for AGIs $75k-100k, 83.3% for AGIs $100k-200k)
Averages for the 2004 tax year for zip code 61814, filed in 2005:
Average Adjusted Gross Income (AGI) in 2004: $41,957 (Individual Income Tax Returns)
Here:
$41,957
State:
$54,625
Salary/wage: $37,661 (reported on 87.9% of returns)
Here:
$37,661
State:
$46,811
(% of AGI for various income ranges: 90.4% for AGIs below $10k, 71.0% for AGIs $10k-25k, 82.4% for AGIs $25k-50k, 83.6% for AGIs $50k-75k, 81.3% for AGIs $75k-100k, 68.4% for AGIs over 100k)
Taxable interest for individuals: $1,037 (reported on 50.3% of returns)
This zip code:
$1,037
Illinois:
$2,101
(% of AGI for various income ranges: 7.3% for AGIs below $10k, 4.1% for AGIs $10k-25k, 1.3% for AGIs $25k-50k, 0.6% for AGIs $50k-75k, 0.5% for AGIs $75k-100k, 1.1% for AGIs over 100k)
Taxable dividends: $1,164 (reported on 25.0% of returns)
Here:
$1,164
State:
$4,306
(% of AGI for various income ranges: 2.9% for AGIs below $10k, 0.8% for AGIs $10k-25k, 1.2% for AGIs $25k-50k, 0.4% for AGIs $50k-75k, 0.2% for AGIs $75k-100k, 1.0% for AGIs over 100k)
Net capital gain/loss: +$1,535 (reported on 16.9% of returns)
Here:
+$1,535
State:
+$17,321
(% of AGI for various income ranges: -2.4% for AGIs below $10k, -0.8% for AGIs $10k-25k, 0.5% for AGIs $25k-50k, 0.2% for AGIs $50k-75k, 0.2% for AGIs $75k-100k, 2.7% for AGIs over 100k)
Profit/loss from business: +$2,307 (reported on 12.8% of returns)
Here:
+$2,307
State:
+$11,771
(% of AGI for various income ranges: 4.5% for AGIs below $10k, 1.1% for AGIs $25k-50k, 0.3% for AGIs $50k-75k, 1.4% for AGIs $75k-100k)
IRA payment deduction: $1,700 (reported on 1.7% of returns)
61814:
$1,700
Illinois:
$3,087
Total itemized deductions: $14,864 (20% of AGI, reported on 22.6% of returns)
Here:
$14,864
State:
$20,239
Here:
19.7% of AGI
State:
19.5% of AGI
(% of AGI for various income ranges: 8.2% for AGIs $25k-50k, 8.0% for AGIs $50k-75k, 11.1% for AGIs $75k-100k, 8.5% for AGIs over 100k)
Charity contributions deductions: $3,436 (4% of AGI, reported on 18.8% of returns)
Here:
$3,436
State:
$3,719
Here:
4.4% of AGI
State:
3.4% of AGI
(% of AGI for various income ranges: 1.0% for AGIs $25k-50k, 1.7% for AGIs $50k-75k, 1.3% for AGIs $75k-100k, 2.9% for AGIs over 100k)
Total tax: $5,326 (reported on 74.4% of returns)
61814:
$5,326
State:
$9,882
(% of AGI for various income ranges: 2.2% for AGIs below $10k, 3.9% for AGIs $10k-25k, 6.3% for AGIs $25k-50k, 8.1% for AGIs $50k-75k, 10.9% for AGIs $75k-100k, 15.6% for AGIs over 100k)
Earned income credit: $1,507 (reported on 12.5% of returns)
Here:
$1,507
State:
$1,788
Percentage of individuals using paid preparers for their 2004 taxes: 61.4%
Here:
61%
State:
61%
(% for various income ranges: 52.0% for AGIs below $10k, 56.5% for AGIs $10k-25k, 64.2% for AGIs $25k-50k, 66.7% for AGIs $50k-75k, 67.2% for AGIs $75k-100k, 73.0% for AGIs over 100k)
Household received Food Stamps/SNAP in the past 12 months: 27 Household did not receive Food Stamps/SNAP in the past 12 months: 476
Women who had a birth in the past 12 months: 27 (0 now married, 28 unmarried) Women who did not have a birth in the past 12 months: 236 (122 now married, 112 unmarried)
Housing units in zip code 61814 with a mortgage: 162 (1 second mortgage, 1 both second mortgage and home equity loan) Houses without a mortgage: 3
Median monthly owner costs for units with a mortgage: $1,020 Median monthly owner costs for units without a mortgage: $471
Residents with income below the poverty level in 2022:
This zip code:
12.8%
Whole state:
11.9%
Residents with income below 50% of the poverty level in 2022:
This zip code:
8.7%
Whole state:
5.7%
Median number of rooms in houses and condos:
Here:
6.4
State:
6.4
Median number of rooms in apartments:
Here:
4.5
State:
4.1
Notable locations in this zip code not listed on our city pages
Notable locations in zip code 61814: Bismarck Community Fire Protection District (A), Bismarck Community Ambulance (B). Display/hide their locations on the map
Size of family households: 211 2-persons, 64 3-persons, 53 4-persons, 31 5-persons, 6 6-persons, 7 7-or-more-persons
Size of nonfamily households: 116 1-person, 17 2-persons
206 married couples with children.
122 single-parent households (60 men, 62 women).
99.0% of residents of 61814 zip code speak English at home.
0.4% of residents speak Spanish at home (100% very well).
0.3% of residents speak other Indo-European language at home (100% well).
Foreign born population: 2 (0.2%) (0.0% of them are naturalized citizens)
:
0.2%
Whole state:
14.4%
100%Bhutan
24%German
12%American
10%English
10%French
7%Irish
4%Portuguese
4%Dutch
Year of entry for the foreign-born population
32010 or later
02000 to 2009
01990 to 1999
0Before 1990
Facilities with environmental interests located in this zip code:
BISMARCK-HENNING JR HIGH SCHOOL (PO BOX 350 in BISMARCK, IL)
(Geographic Names Information System) (National Center for Education Statistics) - STATE ID-5409200101001 (National Center for Education Statistics) - STATE ID-5409200100005 Organizations: BISMARCK HENNING C U SCHOOL DIST (SCHOOL DISTRICT)
BISMARCK COMM UNIT SCHOOL (HOLLOWAY AVENUE in BISMARCK, IL)
STATE MASTER (Illinois EPA Project) - National Pollutant Discharge Elimination System Permit National Pollutant Discharge Elimination System NON-MAJOR (Tracking pollutant discharge elimination systems) - permit National Pollutant Discharge Elimination System NON-MAJOR (Tracking pollutant discharge elimination systems) - permit Business SIC classification: ELEMENTARY AND SECONDARY SCHOOLS Alternative names: BISMARCK COMM UNIT SCHOOL DIST
STEWART GRAIN CO INC (HALLOWAY ST in BISMARCK, IL)
STATE MASTER (Illinois EPA Project) - AIR PROGRAM AIR MINOR (AIRS/AFS) CRITERIA AND HAZARDOUS AIR POLLUTANT INVENTORY (Inventory of air pollution sources) Business SIC classification: GRAIN AND FIELD BEANS Alternative names: S&E, LLC
BISMARCK COMMUNITY WATER DIST (P.O. BOX 192 in BISMARCK, IL)
STATE MASTER (Illinois EPA Project) - National Pollutant Discharge Elimination System Permit National Pollutant Discharge Elimination System NON-MAJOR (Tracking pollutant discharge elimination systems) - permit Business SIC classification: WATER SUPPLY
CDC OIL INC (2 E ST in BISMARCK, IL)
STATE MASTER (Illinois EPA Project) - AIR PROGRAM AIR MINOR (AIRS/AFS) Business SIC classification: PETROLEUM BULK STATIONS AND TERMINALS
TERRA INTERNATIONAL (N. BOWMAN AVE in BISMARCK, IL)
STATE MASTER (Illinois EPA Project) - AIR PROGRAM AIR MINOR (AIRS/AFS) Business SIC classification: FERTILIZERS, MIXING ONLY
BISMARCK-HENNING ELEM SCHOOL (PO BOX 50 in BISMARCK, IL)
(National Center for Education Statistics) - STATE ID-5409200102001 Organizations: BISMARCK HENNING C U SCHOOL DIST (SCHOOL DISTRICT)
SOHIGRO SERVICE CO (NORTH BOWMAN AVE PO BOX 216 in BISMARCK, IL)
Housing units lacking complete plumbing facilities: 7.9% Housing units lacking complete kitchen facilities: 0.5%
33.9%Electricity
32.9%Utility gas
29.9%Bottled, tank, or LP gas
3.4%Solar energy
Population in 1990: 1,476.
Place of birth for U.S.-born residents:
This state: 1,122
Northeast: 8
Midwest: 56
South: 56
West: 16
58% of the 61814 zip code residents lived in the same house 5 years ago. Out of people who lived in different houses, 79% lived in this county. Out of people who lived in different counties, 50% lived in Illinois.
98% of the 61814 zip code residents lived in the same house 1 year ago. Out of people who lived in different houses, 75% moved from this county. Out of people who lived in different houses, 20% moved from different county within same state.
Private vs. public school enrollment:
Students in private schools in grades 1 to 8 (elementary and middle school): 3
Here:
2.3%
Illinois:
13.3%
Students in private schools in grades 9 to 12 (high school):
Here:
0.0%
Illinois:
9.9%
Students in private undergraduate colleges: 7
Here:
19.0%
Illinois:
27.4%
Occupation by median earnings in the past 12 months ($)
109,588Management occupations
101,962Community and social service occupations
95,271Material moving occupations
90,957Construction and extraction occupations
74,307Health diagnosing and treating practitioners and other technical occupations
58,447Installation, maintenance, and repair occupations
Top industries in this zip code by the number of employees in 2005:
Construction: Other Building Equipment Contractors (10-19 employees: 1 establishment)
Health Care and Social Assistance: Residential Mental Retardation Facilities (5-9: 1)
Other Services (except Public Administration): Religious Organizations (1-4: 2)
Wholesale Trade: Grain and Field Bean Merchant Wholesalers (1-4: 1)
Arts, Entertainment, and Recreation: Promoters of Performing Arts, Sports, and Similar Events without Facilities (1-4: 1)
Administrative and Support and Waste Management and Remediation Services: Landscaping Services (1-4: 1)
Finance and Insurance: Direct Property and Casualty Insurance Carriers (1-4: 1)
Professional, Scientific, and Technical Services: Marketing Consulting Services (1-4: 1)
Utilities: Water Supply and Irrigation Systems (1-4: 1)
People in group quarters in 2000:
5 people in homes for the mentally retarded
Fatal accident statistics in 2010:
Fatal accident count: 1
Vehicles involved in fatal accidents: 2
Fatal accidents caused by drunken drivers: 2
Fatalities: 1
Persons involved in fatal accidents: 3
Pedestrians involved in fatal accidents: 0
Home Mortgage Disclosure Act Aggregated Statistics For Year 2009 (Based on 2 partial tracts)
A) FHA, FSA/RHS & VA Home Purchase Loans
B) Conventional Home Purchase Loans
C) Refinancings
D) Home Improvement Loans
F) Non-occupant Loans on < 5 Family Dwellings (A B C & D)
G) Loans On Manufactured Home Dwelling (A B C & D)
Number
Average Value
Number
Average Value
Number
Average Value
Number
Average Value
Number
Average Value
Number
Average Value
LOANS ORIGINATED
10
$90,505
11
$128,892
70
$116,443
14
$41,930
3
$103,673
3
$84,993
APPLICATIONS APPROVED, NOT ACCEPTED
0
$0
0
$0
8
$118,034
1
$21,020
1
$240,970
0
$0
APPLICATIONS DENIED
3
$97,603
1
$33,620
22
$101,127
4
$12,610
1
$144,300
1
$158,310
APPLICATIONS WITHDRAWN
0
$0
1
$212,950
14
$126,591
0
$0
0
$0
0
$0
FILES CLOSED FOR INCOMPLETENESS
0
$0
0
$0
1
$148,510
0
$0
0
$0
0
$0
Aggregated Statistics For Year 2008 (Based on 2 partial tracts)
A) FHA, FSA/RHS & VA Home Purchase Loans
B) Conventional Home Purchase Loans
C) Refinancings
D) Home Improvement Loans
F) Non-occupant Loans on < 5 Family Dwellings (A B C & D)
G) Loans On Manufactured Home Dwelling (A B C & D)
Number
Average Value
Number
Average Value
Number
Average Value
Number
Average Value
Number
Average Value
Number
Average Value
LOANS ORIGINATED
11
$109,024
8
$188,960
32
$129,768
10
$72,432
4
$185,982
1
$128,890
APPLICATIONS APPROVED, NOT ACCEPTED
0
$0
3
$85,460
10
$111,520
3
$63,513
3
$48,567
0
$0
APPLICATIONS DENIED
0
$0
3
$30,823
13
$105,398
7
$40,029
0
$0
1
$81,260
APPLICATIONS WITHDRAWN
0
$0
1
$33,620
7
$106,476
4
$42,380
1
$53,240
0
$0
FILES CLOSED FOR INCOMPLETENESS
0
$0
0
$0
7
$130,693
0
$0
0
$0
0
$0
Aggregated Statistics For Year 2007 (Based on 2 partial tracts)
A) FHA, FSA/RHS & VA Home Purchase Loans
B) Conventional Home Purchase Loans
C) Refinancings
D) Home Improvement Loans
F) Non-occupant Loans on < 5 Family Dwellings (A B C & D)
G) Loans On Manufactured Home Dwelling (A B C & D)
Number
Average Value
Number
Average Value
Number
Average Value
Number
Average Value
Number
Average Value
Number
Average Value
LOANS ORIGINATED
3
$103,673
34
$113,728
42
$96,969
21
$36,359
6
$56,740
6
$46,000
APPLICATIONS APPROVED, NOT ACCEPTED
0
$0
1
$322,230
7
$83,860
1
$18,210
0
$0
0
$0
APPLICATIONS DENIED
1
$53,240
4
$116,982
28
$106,226
14
$77,455
1
$4,200
0
$0
APPLICATIONS WITHDRAWN
0
$0
1
$78,460
11
$106,094
3
$53,707
0
$0
0
$0
FILES CLOSED FOR INCOMPLETENESS
0
$0
0
$0
6
$115,583
0
$0
0
$0
0
$0
Aggregated Statistics For Year 2006 (Based on 2 partial tracts)
A) FHA, FSA/RHS & VA Home Purchase Loans
B) Conventional Home Purchase Loans
C) Refinancings
D) Home Improvement Loans
F) Non-occupant Loans on < 5 Family Dwellings (A B C & D)
G) Loans On Manufactured Home Dwelling (A B C & D)
Number
Average Value
Number
Average Value
Number
Average Value
Number
Average Value
Number
Average Value
Number
Average Value
LOANS ORIGINATED
3
$100,873
27
$115,401
34
$81,670
15
$23,070
8
$38,528
3
$54,173
APPLICATIONS APPROVED, NOT ACCEPTED
0
$0
3
$125,157
3
$93,400
0
$0
0
$0
0
$0
APPLICATIONS DENIED
0
$0
6
$73,318
8
$116,282
4
$47,985
1
$26,620
1
$26,620
APPLICATIONS WITHDRAWN
0
$0
7
$83,660
18
$130,604
1
$159,710
1
$159,710
0
$0
FILES CLOSED FOR INCOMPLETENESS
0
$0
4
$89,315
3
$77,523
0
$0
0
$0
0
$0
Aggregated Statistics For Year 2005 (Based on 2 partial tracts)
A) FHA, FSA/RHS & VA Home Purchase Loans
B) Conventional Home Purchase Loans
C) Refinancings
D) Home Improvement Loans
F) Non-occupant Loans on < 5 Family Dwellings (A B C & D)
G) Loans On Manufactured Home Dwelling (A B C & D)
Number
Average Value
Number
Average Value
Number
Average Value
Number
Average Value
Number
Average Value
Number
Average Value
LOANS ORIGINATED
3
$74,720
48
$97,691
41
$106,852
15
$37,827
10
$86,302
1
$19,610
APPLICATIONS APPROVED, NOT ACCEPTED
0
$0
7
$77,456
15
$114,975
4
$23,818
1
$140,100
3
$57,907
APPLICATIONS DENIED
1
$99,470
10
$127,071
31
$100,601
8
$19,439
1
$89,660
1
$99,470
APPLICATIONS WITHDRAWN
0
$0
1
$21,020
20
$97,930
3
$332,970
0
$0
4
$57,790
FILES CLOSED FOR INCOMPLETENESS
0
$0
6
$84,060
3
$70,983
0
$0
0
$0
0
$0
Aggregated Statistics For Year 2004 (Based on 2 partial tracts)
A) FHA, FSA/RHS & VA Home Purchase Loans
B) Conventional Home Purchase Loans
C) Refinancings
D) Home Improvement Loans
E) Loans on Dwellings For 5+ Families
F) Non-occupant Loans on < 5 Family Dwellings (A B C & D)
G) Loans On Manufactured Home Dwelling (A B C & D)
Detailed PMIC statistics for the following Tracts:0104.00
2002 - 2018 National Fire Incident Reporting System (NFIRS) incidents
Based on the data from the years 2002 - 2018 the average number of fires per year is 9. The highest number of reported fires - 19 took place in 2002, and the least - 3 in 2006. The data has a decreasing trend.
When looking into fire subcategories, the most incidents belonged to: Structure Fires (39.3%), and Outside Fires (38.6%).
Fire incident types reported to NFIRS in Zip Code 61814


 Nearest zip codes: 47982, 61811, 61832, 47991, 61834, 61833.


 Based on the data from the years 2002 - 2018 the average number of fires per year is 9. The highest number of reported fires - 19 took place in 2002, and the least - 3 in 2006. The data has a decreasing trend.
 When looking into fire subcategories, the most incidents belonged to: Structure Fires (39.3%), and Outside Fires (38.6%).