Estimated zip code population in 2022: 1,642 Zip code population in 2010: 1,971 Zip code population in 2000: 2,147
Houses and condos: 765 Renter-occupied apartments: 135
% of renters here:
19%
State:
33%
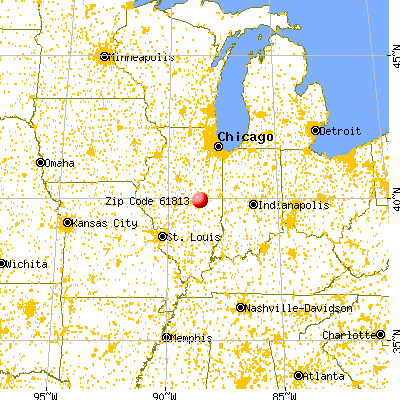
March 2022 cost of living index in zip code 61813: 83.6 (less than average, U.S. average is 100)
Land area: 65.2 sq. mi. Water area: 0.0 sq. mi.
Population density: 25 people per square mile
(very low).
OSM Map
General Map
Google Map
MSN Map
OSM Map
General Map
Google Map
MSN Map
OSM Map
General Map
Google Map
MSN Map
OSM Map
General Map
Google Map
MSN Map
Please wait while loading the map...
Real estate property taxes paid for housing units in 2022:
This zip code:
2.2% ($2,313)
Illinois:
2.0% ($4,912)
Median real estate property taxes paid for housing units with mortgages in 2022: $2,388 (2.2%) Median real estate property taxes paid for housing units with no mortgage in 2022: $2,210 (2.1%)
Business Search- 14 Million verified businesses
Males: 809
(49.3%)
Females: 832
(50.7%)
For population 25 years and over in 61813:
High school or higher: 96.1%
Bachelor's degree or higher: 18.7%
Graduate or professional degree: 5.4%
Unemployed: 2.8%
Mean travel time to work (commute): 24.1 minutes
For population 15 years and over in 61813:
Never married: 31.3%
Now married: 44.9%
Separated: 0.2%
Widowed: 6.3%
Divorced: 17.2%
Zip code 61813 compared to state average:
Median house value significantly below state average.
Unemployed percentage below state average.
Black race population percentage significantly below state average.
Hispanic race population percentage significantly below state average.
Median age above state average.
Foreign-born population percentage significantly below state average.
Renting percentage below state average.
Length of stay since moving in significantly above state average.
Number of college students below state average.
Percentage of population with a bachelor's degree or higher below state average.
Averages for the 2020 tax year for zip code 61813, filed in 2021:
Average Adjusted Gross Income (AGI) in 2020: $55,442 (Individual Income Tax Returns)
Here:
$55,442
State:
$82,626
Salary/wage: $43,628 (reported on 83.5% of returns)
Here:
$43,628
State:
$66,640
(% of AGI for various income ranges: 1113.0% for AGIs below $25k, 3518.8% for AGIs $25k-50k, 6351.7% for AGIs $50k-75k, 9548.3% for AGIs $75k-100k, 16091.4% for AGIs $100k-200k)
Taxable interest for individuals: $743 (reported on 33.0% of returns)
This zip code:
$743
Illinois:
$2,376
(% of AGI for various income ranges: 13.5% for AGIs below $25k, 35.3% for AGIs $25k-50k, 38.3% for AGIs $50k-75k, 56.7% for AGIs $75k-100k, 74.3% for AGIs $100k-200k)
Ordinary dividends: $2,508 (reported on 13.2% of returns)
Here:
$2,508
State:
$9,061
(% of AGI for various income ranges: 9.6% for AGIs below $25k, 27.6% for AGIs $25k-50k, 66.7% for AGIs $50k-75k, 217.1% for AGIs $100k-200k)
Net capital gain/loss in AGI: +$12,120 (reported on 11.0% of returns)
Here:
+$12,120
State:
+$31,684
(% of AGI for various income ranges: 13.5% for AGIs below $25k, 80.0% for AGIs $50k-75k, 1550.0% for AGIs $100k-200k)
Profit/loss from business: +$9,122 (reported on 9.9% of returns)
Here:
+$9,122
State:
+$12,175
(% of AGI for various income ranges: 94.8% for AGIs below $25k, 71.2% for AGIs $25k-50k, 170.0% for AGIs $50k-75k, 397.1% for AGIs $100k-200k)
Taxable individual retirement arrangement distribution: $11,370 (reported on 11.0% of returns)
61813:
$11,370
Illinois:
$21,613
(% of AGI for various income ranges: 77.4% for AGIs below $25k, 253.5% for AGIs $25k-50k, 880.0% for AGIs $75k-100k)
Total itemized deductions: $22,750 (reported on 2.2% of returns)
Here:
$22,750
State:
$34,948
(% of AGI for various income ranges: 197.8% for AGIs below $25k)
Earned income credit: $1,840 (reported on 16.5% of returns)
Here:
$1,840
State:
$2,311
(% of AGI for various income ranges: 70.0% for AGIs below $25k, 67.6% for AGIs $25k-50k)
Percentage of individuals using paid preparers for their 2020 taxes: 95.6%
Here:
96%
State:
93%
(% for various income ranges: 93.5% for AGIs below $25k, 95.5% for AGIs $25k-50k, 94.1% for AGIs $50k-75k, 100.0% for AGIs $75k-100k, 100.0% for AGIs $100k-200k, 100.0% for AGIs over 200k)
Averages for the 2012 tax year for zip code 61813, filed in 2013:
Average Adjusted Gross Income (AGI) in 2012: $46,667 (Individual Income Tax Returns)
Here:
$46,667
State:
$68,058
Salary/wage: $37,373 (reported on 83.0% of returns)
Here:
$37,373
State:
$55,396
(% of AGI for various income ranges: 73.9% for AGIs below $25k, 74.1% for AGIs $25k-50k, 75.0% for AGIs $50k-75k, 74.4% for AGIs $75k-100k, 49.2% for AGIs $100k-200k)
Taxable interest for individuals: $638 (reported on 36.4% of returns)
This zip code:
$638
Illinois:
$1,969
(% of AGI for various income ranges: 0.6% for AGIs below $25k, 0.6% for AGIs $25k-50k, 0.3% for AGIs $50k-75k, 0.4% for AGIs $75k-100k, 0.6% for AGIs $100k-200k)
Ordinary dividends: $1,887 (reported on 17.0% of returns)
Here:
$1,887
State:
$7,786
(% of AGI for various income ranges: 0.4% for AGIs below $25k, 0.2% for AGIs $25k-50k, 0.9% for AGIs $50k-75k, 1.4% for AGIs $100k-200k)
Net capital gain/loss in AGI: +$11 (reported on 10.2% of returns)
Here:
+$11
State:
+$22,183
(% of AGI for various income ranges: )
Profit/loss from business: +$6,433 (reported on 10.2% of returns)
Here:
+$6,433
State:
+$12,903
(% of AGI for various income ranges: 3.2% for AGIs below $25k, 1.0% for AGIs $25k-50k, 4.3% for AGIs $50k-75k)
Taxable individual retirement arrangement distribution: $9,320 (reported on 11.4% of returns)
61813:
$9,320
Illinois:
$17,929
(% of AGI for various income ranges: 3.8% for AGIs below $25k, 7.7% for AGIs $25k-50k, 2.0% for AGIs $75k-100k)
Total itemized deductions: $16,629 (18% of AGI, reported on 19.3% of returns)
Here:
$16,629
State:
$26,433
Here:
18.2% of AGI
State:
19.2% of AGI
(% of AGI for various income ranges: 6.3% for AGIs $25k-50k, 7.6% for AGIs $50k-75k, 9.1% for AGIs $75k-100k, 7.7% for AGIs $100k-200k)
Charity contributions: $2,778 (reported on 10.2% of returns)
Here:
$2,778
State:
$4,525
(% of AGI for various income ranges: 0.8% for AGIs $50k-75k, 0.8% for AGIs $75k-100k, 1.0% for AGIs $100k-200k)
Taxes paid: $6,712 (reported on 19.3% of returns)
61813:
$6,712
State:
$11,968
(% of AGI for various income ranges: 1.5% for AGIs $25k-50k, 2.3% for AGIs $50k-75k, 3.5% for AGIs $75k-100k, 4.4% for AGIs $100k-200k)
Earned income credit: $2,207 (reported on 17.0% of returns)
Here:
$2,207
State:
$2,349
(% of AGI for various income ranges: 5.7% for AGIs below $25k, 1.3% for AGIs $25k-50k)
Percentage of individuals using paid preparers for their 2012 taxes: 62.5%
Here:
62%
State:
57%
(% for various income ranges: 55.9% for AGIs below $25k, 56.5% for AGIs $25k-50k, 78.6% for AGIs $50k-75k, 62.5% for AGIs $75k-100k, 77.8% for AGIs $100k-200k)
Averages for the 2004 tax year for zip code 61813, filed in 2005:
Average Adjusted Gross Income (AGI) in 2004: $35,358 (Individual Income Tax Returns)
Here:
$35,358
State:
$54,625
Salary/wage: $31,458 (reported on 83.2% of returns)
Here:
$31,458
State:
$46,811
(% of AGI for various income ranges: 99.2% for AGIs below $10k, 73.9% for AGIs $10k-25k, 76.5% for AGIs $25k-50k, 80.5% for AGIs $50k-75k, 78.1% for AGIs $75k-100k, 50.2% for AGIs over 100k)
Taxable interest for individuals: $1,207 (reported on 52.1% of returns)
This zip code:
$1,207
Illinois:
$2,101
(% of AGI for various income ranges: 9.4% for AGIs below $10k, 3.1% for AGIs $10k-25k, 1.9% for AGIs $25k-50k, 1.2% for AGIs $50k-75k, 0.8% for AGIs $75k-100k, 1.4% for AGIs over 100k)
Taxable dividends: $1,169 (reported on 19.8% of returns)
Here:
$1,169
State:
$4,306
(% of AGI for various income ranges: 3.1% for AGIs below $10k, 0.5% for AGIs $10k-25k, 0.5% for AGIs $25k-50k, 0.7% for AGIs $50k-75k, 0.3% for AGIs $75k-100k, 1.2% for AGIs over 100k)
Net capital gain/loss: +$2,194 (reported on 13.0% of returns)
Here:
+$2,194
State:
+$17,321
(% of AGI for various income ranges: 1.0% for AGIs below $10k, -0.3% for AGIs $10k-25k, 0.7% for AGIs $25k-50k, -0.1% for AGIs $50k-75k, 1.1% for AGIs $75k-100k, 3.3% for AGIs over 100k)
Profit/loss from business: +$3,859 (reported on 13.4% of returns)
Here:
+$3,859
State:
+$11,771
(% of AGI for various income ranges: -7.6% for AGIs below $10k, 1.5% for AGIs $10k-25k, 1.6% for AGIs $25k-50k, 2.6% for AGIs $50k-75k, 1.5% for AGIs over 100k)
Profit/loss from farming: +$18,409 (reported on 4.6% of returns)
Here:
+$18,409
State:
+$2,327
IRA payment deduction: $2,867 (reported on 1.6% of returns)
61813:
$2,867
Illinois:
$3,087
Total itemized deductions: $16,591 (27% of AGI, reported on 16.1% of returns)
Here:
$16,591
State:
$20,239
Here:
26.9% of AGI
State:
19.5% of AGI
(% of AGI for various income ranges: 9.3% for AGIs $10k-25k, 4.9% for AGIs $25k-50k, 6.7% for AGIs $50k-75k, 8.7% for AGIs $75k-100k, 12.7% for AGIs over 100k)
Charity contributions deductions: $1,764 (3% of AGI, reported on 11.5% of returns)
Here:
$1,764
State:
$3,719
Here:
2.8% of AGI
State:
3.4% of AGI
(% of AGI for various income ranges: 0.4% for AGIs $10k-25k, 0.4% for AGIs $25k-50k, 0.5% for AGIs $50k-75k, 0.8% for AGIs $75k-100k, 1.2% for AGIs over 100k)
Total tax: $4,055 (reported on 75.9% of returns)
61813:
$4,055
State:
$9,882
(% of AGI for various income ranges: 3.7% for AGIs below $10k, 4.3% for AGIs $10k-25k, 6.5% for AGIs $25k-50k, 8.6% for AGIs $50k-75k, 10.6% for AGIs $75k-100k, 15.9% for AGIs over 100k)
Earned income credit: $1,515 (reported on 13.8% of returns)
Here:
$1,515
State:
$1,788
Percentage of individuals using paid preparers for their 2004 taxes: 61.7%
Here:
62%
State:
61%
(% for various income ranges: 51.9% for AGIs below $10k, 60.8% for AGIs $10k-25k, 67.0% for AGIs $25k-50k, 65.8% for AGIs $50k-75k, 62.1% for AGIs $75k-100k, 61.5% for AGIs over 100k)
Household received Food Stamps/SNAP in the past 12 months: 76 Household did not receive Food Stamps/SNAP in the past 12 months: 626
Women who had a birth in the past 12 months: 16 (8 now married, 7 unmarried) Women who did not have a birth in the past 12 months: 403 (153 now married, 249 unmarried)
Housing units in zip code 61813 with a mortgage: 293 (39 second mortgage, 29 both second mortgage and home equity loan) Houses without a mortgage: 4
Median monthly owner costs for units with a mortgage: $1,053 Median monthly owner costs for units without a mortgage: $519
Residents with income below the poverty level in 2022:
This zip code:
7.2%
Whole state:
11.9%
Residents with income below 50% of the poverty level in 2022:
This zip code:
2.9%
Whole state:
5.7%
Median number of rooms in houses and condos:
Here:
6.6
State:
6.4
Median number of rooms in apartments:
Here:
4.4
State:
4.1
Notable locations in this zip code not listed on our city pages
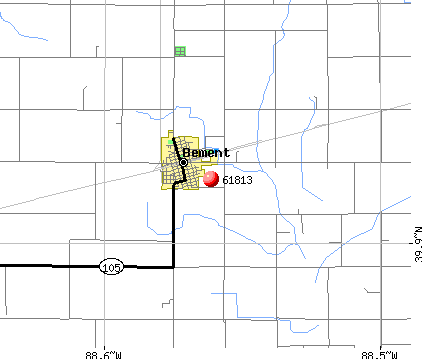
Notable locations in zip code 61813: Bement Fire Protection District Station 2 (A), Bement Fire Protection District Station 1 (B). Display/hide their locations on the map
Churches in zip code 61813 include: Asbury Church (A), Bement Baptist Church (B), Bement United Methodist Church (C), First Christian Church (D), First Presbyterian Church (E), Saint Michaels Roman Catholic Church (F). Display/hide their locations on the map
In group quarters: 38 (-1 institutionalized population)
Size of family households: 176 2-persons, 99 3-persons, 97 4-persons, 19 5-persons, 2 6-persons
Size of nonfamily households: 249 1-person, 65 2-persons
188 married couples with children.
68 single-parent households (10 men, 58 women).
97.5% of residents of 61813 zip code speak English at home.
1.4% of residents speak Spanish at home (77% very well, 23% not well).
0.2% of residents speak other Indo-European language at home (100% very well).
Foreign born population: 12 (0.7%) (25.2% of them are naturalized citizens)
This zip code:
0.7%
Whole state:
14.4%
67%Honduras
25%St. Vincent and the Grenadines
19%German
18%American
17%Irish
17%English
3%British
3%Italian
3%European
Year of entry for the foreign-born population
02010 or later
02000 to 2009
81990 to 1999
6Before 1990
Facilities with environmental interests located in this zip code:
GORRELL TRUCKING (280 E. FREMONT STREET in BEMENT, IL)
STATE MASTER (Illinois EPA Project) - National Pollutant Discharge Elimination System Permit National Pollutant Discharge Elimination System NON-MAJOR (Tracking pollutant discharge elimination systems) - permit
MOBIL PIPELINE CO (4 MILES W OF BEMENT in BEMENT, IL)
STATE MASTER (Illinois EPA Project) - AIR PROGRAM AIR MINOR (AIRS/AFS) CRITERIA AND HAZARDOUS AIR POLLUTANT INVENTORY (Inventory of air pollution sources) Business SIC classification: CRUDE PETROLEUM PIPELINES Business NAICS classification: PIPELINE TRANSPORTATION OF CRUDE OIL.
PIATT COUNTY SERVICE (RFD in BEMENT, IL)
STATE MASTER (Illinois EPA Project) - AIR PROGRAM AIR MINOR (AIRS/AFS) CRITERIA AND HAZARDOUS AIR POLLUTANT INVENTORY (Inventory of air pollution sources) Business SIC classification: FARM SUPPLIES
ILLINOIS VALLEY PAVING CO (RURAL in BEMENT, IL)
STATE MASTER (Illinois EPA Project) - AIR PROGRAM AIR MINOR (AIRS/AFS) Business SIC classification: NONCLASSIFIABLE ESTABLISHMENTS
MOORE FARM SERVICE (432 E BODMAN in BEMENT, IL)
STATE MASTER (Illinois EPA Project) - AIR PROGRAM AIR MINOR (AIRS/AFS) Business SIC classification: FERTILIZERS, MIXING ONLY
MOORE FARM SERVICE (MOERY DR in BEMENT, IL)
STATE MASTER (Illinois EPA Project) - AIR PROGRAM AIR MINOR (AIRS/AFS) Business SIC classification: FARM SUPPLIES Alternative names: MAX E. MOORE
ROBERTS OIL CO (RR #1 BOX 20 in BEMENT, IL)
STATE MASTER (Illinois EPA Project) - AIR PROGRAM AIR MINOR (AIRS/AFS) Business SIC classification: PETROLEUM BULK STATIONS AND TERMINALS
ROY E. ALLEN (281 E. WILSON in BEMENT, IL)
STATE MASTER (Illinois EPA Project) - AIR PROGRAM AIR MINOR (AIRS/AFS) Business SIC classification: PETROLEUM BULK STATIONS AND TERMINALS
PIATT COUNTY SERVICE CO (RTE 105 SOUTH in BEMENT, IL)
(Resource Conservation and Recovery Act (tracking hazardous waste))
NORFOLK AND WESTERN RAILWAY CO (500 W WILSON in BEMENT, IL)
Small Quantity Generators, between 100 kg and 1000 kg of hazardous waste/month (Resource Conservation and Recovery Act (tracking hazardous waste)) - notification Organizations: NORFOLK SOUTHERN CORP (CONTACT/OWNER)
Housing units lacking complete plumbing facilities: 4.7% Housing units lacking complete kitchen facilities: 1.6%
79.5%Utility gas
13.6%Electricity
6.8%Bottled, tank, or LP gas
Population in 1990: 1,928. Population change in the 1990s: +219 (+11.4%).
Place of birth for U.S.-born residents:
This state: 1,379
Northeast: 24
Midwest: 95
South: 71
West: 47
59% of the 61813 zip code residents lived in the same house 5 years ago. Out of people who lived in different houses, 58% lived in this county. Out of people who lived in different counties, 50% lived in Illinois.
92% of the 61813 zip code residents lived in the same house 1 year ago. Out of people who lived in different houses, 69% moved from this county. Out of people who lived in different houses, 28% moved from different county within same state.
Private vs. public school enrollment:
Students in private schools in grades 1 to 8 (elementary and middle school): 7
Here:
7.1%
Illinois:
13.3%
Students in private schools in grades 9 to 12 (high school): 10
Here:
9.5%
Illinois:
9.9%
Students in private undergraduate colleges: 4
Here:
15.0%
Illinois:
27.4%
Occupation by median earnings in the past 12 months ($)
72,612Health diagnosing and treating practitioners and other technical occupations
67,293Business and financial operations occupations
54,261Installation, maintenance, and repair occupations
49,067Management occupations
43,693Transportation occupations
42,430Sales and related occupations
Companies with federal contracts located in this zip code:
BEMENT MANOR (601 NORTH MORGAN in BEMENT, IL)
$8,597 with Department of Veterans Affairs for Nursing Home Care Contracts. Signed on 2003-09-15. Completion date: 2003-09-15.
Top industries in this zip code by the number of employees in 2005:
Health Care and Social Assistance: Nursing Care Facilities (50-99 employees: 1 establishment)
Finance and Insurance: Commercial Banking (20-49: 1)
Wholesale Trade: Grain and Field Bean Merchant Wholesalers (20-49: 1)
Wholesale Trade: Farm and Garden Machinery and Equipment Merchant Wholesalers (5-9: 2, 1-4: 1)
Construction: Site Preparation Contractors (5-9: 1, 1-4: 1)
People in group quarters in 2010:
40 people in nursing facilities/skilled-nursing facilities
People in group quarters in 2000:
59 people in nursing homes
19 people in homes for the mentally ill
2002 - 2018 National Fire Incident Reporting System (NFIRS) incidents
Based on the data from the years 2002 - 2018 the average number of fires per year is 11. The highest number of reported fires - 24 took place in 2015, and the least - 1 in 2005. The data has an increasing trend.
When looking into fire subcategories, the most incidents belonged to: Outside Fires (42.5%), and Structure Fires (33.5%).
Fire incident types reported to NFIRS in Zip Code 61813


 Nearest zip codes: 61855, 61929, 61856, 61913, 61851, 61818.


 Based on the data from the years 2002 - 2018 the average number of fires per year is 11. The highest number of reported fires - 24 took place in 2015, and the least - 1 in 2005. The data has an increasing trend.
 When looking into fire subcategories, the most incidents belonged to: Outside Fires (42.5%), and Structure Fires (33.5%).