Estimated zip code population in 2022: 1,034 Zip code population in 2010: 952 Zip code population in 2000: 1,027
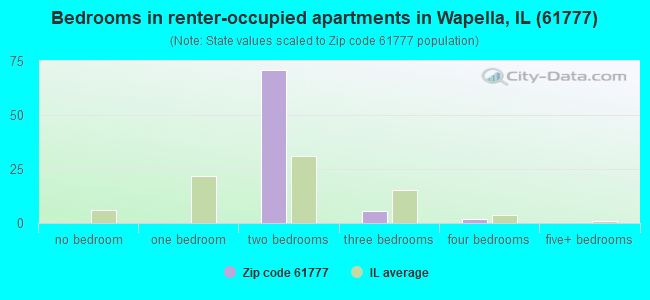
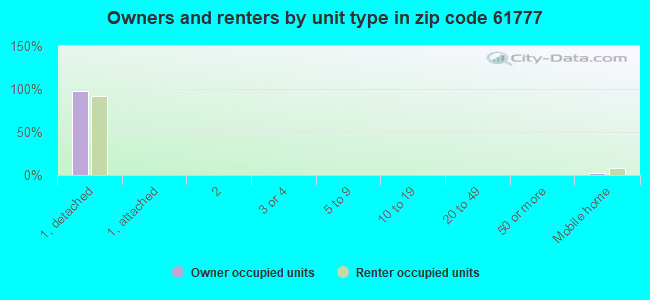
Houses and condos: 468 Renter-occupied apartments: 78
% of renters here:
17%
State:
33%
March 2022 cost of living index in zip code 61777: 74.0 (low, U.S. average is 100)
Land area: 40.2 sq. mi. Water area: 0.0 sq. mi.
Population density: 26 people per square mile
(very low).
OSM Map
General Map
Google Map
MSN Map
OSM Map
General Map
Google Map
MSN Map
OSM Map
General Map
Google Map
MSN Map
OSM Map
General Map
Google Map
MSN Map
Please wait while loading the map...
Real estate property taxes paid for housing units in 2022:
This zip code:
1.3% ($1,859)
Illinois:
2.0% ($4,912)
Median real estate property taxes paid for housing units with mortgages in 2022: $1,877 (1.3%) Median real estate property taxes paid for housing units with no mortgage in 2022: $1,826 (1.3%)
Business Search- 14 Million verified businesses
Males: 521
(50.5%)
Females: 512
(49.5%)
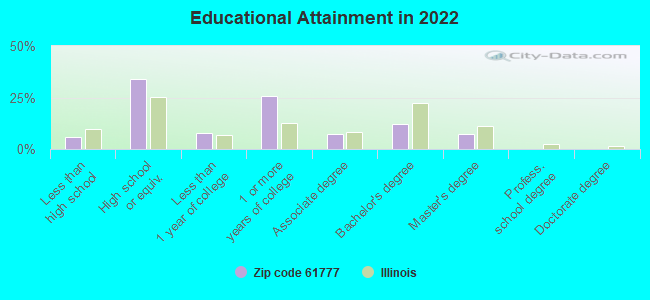
For population 25 years and over in 61777:
High school or higher: 92.1%
Bachelor's degree or higher: 19.2%
Graduate or professional degree: 7.2%
Unemployed: 0.5%
Mean travel time to work (commute): 26.6 minutes
For population 15 years and over in 61777:
Never married: 31.1%
Now married: 50.5%
Separated: 2.0%
Widowed: 6.0%
Divorced: 10.4%
Zip code 61777 compared to state average:
Median house value below state average.
Unemployed percentage significantly below state average.
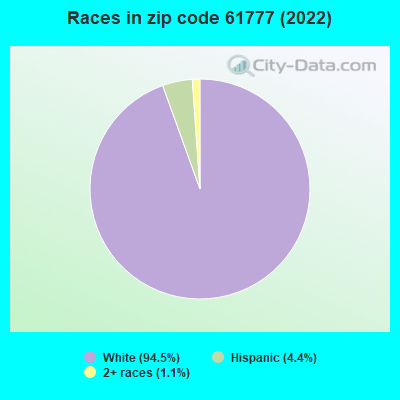
Black race population percentage significantly below state average.
Hispanic race population percentage significantly below state average.
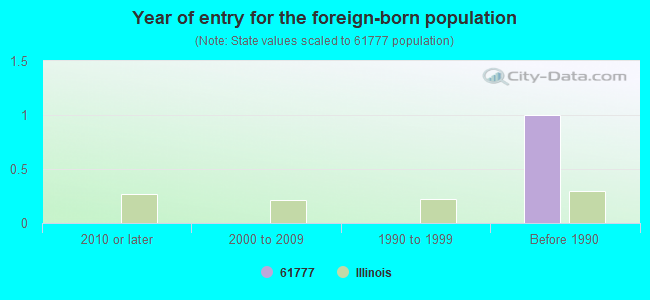
Foreign-born population percentage significantly below state average.
Renting percentage below state average.
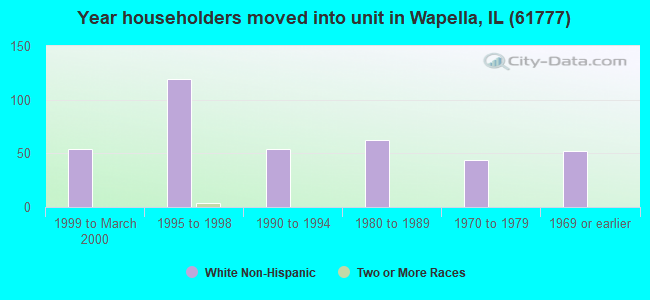
Length of stay since moving in significantly above state average.
Number of college students below state average.
Percentage of population with a bachelor's degree or higher below state average.
Averages for the 2020 tax year for zip code 61777, filed in 2021:
Average Adjusted Gross Income (AGI) in 2020: $68,355 (Individual Income Tax Returns)
Here:
$68,355
State:
$82,626
Salary/wage: $58,057 (reported on 84.1% of returns)
Here:
$58,057
State:
$66,640
(% of AGI for various income ranges: 923.0% for AGIs below $25k, 3582.5% for AGIs $25k-50k, 7217.5% for AGIs $50k-75k, 10073.3% for AGIs $75k-100k, 19638.3% for AGIs $100k-200k)
Taxable interest for individuals: $589 (reported on 40.9% of returns)
This zip code:
$589
Illinois:
$2,376
(% of AGI for various income ranges: 6.0% for AGIs below $25k, 8.8% for AGIs $25k-50k, 30.0% for AGIs $50k-75k, 33.3% for AGIs $75k-100k, 118.3% for AGIs $100k-200k)
Ordinary dividends: $2,888 (reported on 18.2% of returns)
Here:
$2,888
State:
$9,061
(% of AGI for various income ranges: 36.2% for AGIs $25k-50k, 336.7% for AGIs $100k-200k)
Net capital gain/loss in AGI: +$3,514 (reported on 15.9% of returns)
Here:
+$3,514
State:
+$31,684
(% of AGI for various income ranges: 41.0% for AGIs below $25k, 341.7% for AGIs $100k-200k)
Profit/loss from business: +$6,850 (reported on 9.1% of returns)
Here:
+$6,850
State:
+$12,175
(% of AGI for various income ranges: 913.3% for AGIs $75k-100k)
Taxable individual retirement arrangement distribution: $10,700 (reported on 9.1% of returns)
61777:
$10,700
Illinois:
$21,613
(% of AGI for various income ranges: 1426.7% for AGIs $75k-100k)
Earned income credit: $1,450 (reported on 9.1% of returns)
Here:
$1,450
State:
$2,311
(% of AGI for various income ranges: 58.0% for AGIs below $25k)
Percentage of individuals using paid preparers for their 2020 taxes: 95.5%
Here:
95%
State:
93%
(% for various income ranges: 100.0% for AGIs below $25k, 90.0% for AGIs $25k-50k, 100.0% for AGIs $50k-75k, 100.0% for AGIs $75k-100k, 90.9% for AGIs $100k-200k)
Averages for the 2012 tax year for zip code 61777, filed in 2013:
Average Adjusted Gross Income (AGI) in 2012: $58,173 (Individual Income Tax Returns)
Here:
$58,173
State:
$68,058
Salary/wage: $48,238 (reported on 82.2% of returns)
Here:
$48,238
State:
$55,396
(% of AGI for various income ranges: 70.7% for AGIs below $25k, 77.8% for AGIs $25k-50k, 68.3% for AGIs $50k-75k, 74.5% for AGIs $75k-100k, 62.5% for AGIs $100k-200k)
Taxable interest for individuals: $484 (reported on 42.2% of returns)
This zip code:
$484
Illinois:
$1,969
(% of AGI for various income ranges: 0.8% for AGIs below $25k, 0.3% for AGIs $25k-50k, 0.3% for AGIs $50k-75k, 0.3% for AGIs $75k-100k, 0.4% for AGIs $100k-200k)
Ordinary dividends: $2,288 (reported on 17.8% of returns)
Here:
$2,288
State:
$7,786
(% of AGI for various income ranges: 0.7% for AGIs below $25k, 1.7% for AGIs $50k-75k, 0.8% for AGIs $100k-200k)
Net capital gain/loss in AGI: +$475 (reported on 8.9% of returns)
Here:
+$475
State:
+$22,183
Profit/loss from business: +$4,433 (reported on 6.7% of returns)
Here:
+$4,433
State:
+$12,903
Taxable individual retirement arrangement distribution: $7,725 (reported on 8.9% of returns)
61777:
$7,725
Illinois:
$17,929
Total itemized deductions: $17,583 (17% of AGI, reported on 26.7% of returns)
Here:
$17,583
State:
$26,433
Here:
16.9% of AGI
State:
19.2% of AGI
(% of AGI for various income ranges: 6.6% for AGIs $25k-50k, 10.6% for AGIs $50k-75k, 7.4% for AGIs $75k-100k, 8.7% for AGIs $100k-200k)
Charity contributions: $3,086 (reported on 15.6% of returns)
Here:
$3,086
State:
$4,525
Taxes paid: $7,375 (reported on 26.7% of returns)
61777:
$7,375
State:
$11,968
(% of AGI for various income ranges: 1.9% for AGIs $25k-50k, 3.6% for AGIs $50k-75k, 3.7% for AGIs $75k-100k, 4.0% for AGIs $100k-200k)
Earned income credit: $1,817 (reported on 13.3% of returns)
Here:
$1,817
State:
$2,349
(% of AGI for various income ranges: 7.9% for AGIs below $25k)
Percentage of individuals using paid preparers for their 2012 taxes: 53.3%
Here:
53%
State:
57%
(% for various income ranges: 38.5% for AGIs below $25k, 45.5% for AGIs $25k-50k, 62.5% for AGIs $50k-75k, 60.0% for AGIs $75k-100k, 75.0% for AGIs $100k-200k)
Averages for the 2004 tax year for zip code 61777, filed in 2005:
Average Adjusted Gross Income (AGI) in 2004: $55,275 (Individual Income Tax Returns)
Here:
$55,275
State:
$54,625
Salary/wage: $37,965 (reported on 88.1% of returns)
Here:
$37,965
State:
$46,811
(% of AGI for various income ranges: 88.0% for AGIs below $10k, 71.7% for AGIs $10k-25k, 81.9% for AGIs $25k-50k, 84.7% for AGIs $50k-75k, 82.6% for AGIs $75k-100k, 25.0% for AGIs over 100k)
Taxable interest for individuals: $1,434 (reported on 48.6% of returns)
This zip code:
$1,434
Illinois:
$2,101
(% of AGI for various income ranges: 12.4% for AGIs below $10k, 1.6% for AGIs $10k-25k, 0.9% for AGIs $25k-50k, 0.6% for AGIs $50k-75k, 0.5% for AGIs $75k-100k, 1.7% for AGIs over 100k)
Taxable dividends: $515 (reported on 21.3% of returns)
Here:
$515
State:
$4,306
(% of AGI for various income ranges: 1.5% for AGIs below $10k, 0.1% for AGIs $25k-50k, 0.1% for AGIs $50k-75k, 0.5% for AGIs $75k-100k, 0.2% for AGIs over 100k)
Net capital gain/loss: +$4,349 (reported on 13.8% of returns)
Here:
+$4,349
State:
+$17,321
(% of AGI for various income ranges: 0.4% for AGIs below $10k, 0.1% for AGIs $25k-50k, 1.3% for AGIs $50k-75k, 6.1% for AGIs $75k-100k)
Profit/loss from business: +$6,027 (reported on 8.1% of returns)
Here:
+$6,027
State:
+$11,771
Profit/loss from farming: +$3,970 (reported on 7.3% of returns)
Here:
+$3,970
State:
+$2,327
Total itemized deductions: $14,374 (14% of AGI, reported on 20.0% of returns)
Here:
$14,374
State:
$20,239
Here:
13.9% of AGI
State:
19.5% of AGI
(% of AGI for various income ranges: 5.1% for AGIs $25k-50k, 9.8% for AGIs $50k-75k, 6.7% for AGIs $75k-100k, 2.9% for AGIs over 100k)
Charity contributions deductions: $2,221 (2% of AGI, reported on 14.9% of returns)
Here:
$2,221
State:
$3,719
Here:
1.9% of AGI
State:
3.4% of AGI
(% of AGI for various income ranges: 0.7% for AGIs $25k-50k, 1.0% for AGIs $50k-75k, 0.6% for AGIs $75k-100k, 0.4% for AGIs over 100k)
Total tax: $8,251 (reported on 77.8% of returns)
61777:
$8,251
State:
$9,882
(% of AGI for various income ranges: 1.9% for AGIs below $10k, 3.6% for AGIs $10k-25k, 7.0% for AGIs $25k-50k, 9.0% for AGIs $50k-75k, 12.2% for AGIs $75k-100k, 16.9% for AGIs over 100k)
Earned income credit: $1,455 (reported on 14.5% of returns)
Here:
$1,455
State:
$1,788
Percentage of individuals using paid preparers for their 2004 taxes: 58.0%
Here:
58%
State:
61%
(% for various income ranges: 40.9% for AGIs below $10k, 56.4% for AGIs $10k-25k, 56.8% for AGIs $25k-50k, 60.6% for AGIs $50k-75k, 73.0% for AGIs $75k-100k, 78.1% for AGIs over 100k)
Household received Food Stamps/SNAP in the past 12 months: 12 Household did not receive Food Stamps/SNAP in the past 12 months: 427
Women who had a birth in the past 12 months: 12 (10 now married, 1 unmarried) Women who did not have a birth in the past 12 months: 228 (83 now married, 145 unmarried)
Housing units in zip code 61777 with a mortgage: 176 (11 second mortgage, 8 both second mortgage and home equity loan) Houses without a mortgage: 37
Median monthly owner costs for units with a mortgage: $1,069 Median monthly owner costs for units without a mortgage: $499
Residents with income below the poverty level in 2022:
This zip code:
2.3%
Whole state:
11.9%
Residents with income below 50% of the poverty level in 2022:
This zip code:
1.0%
Whole state:
5.7%
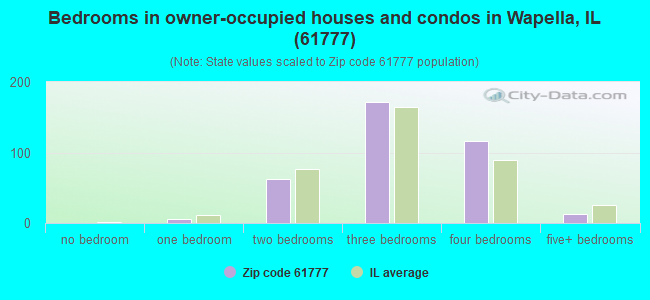
Median number of rooms in houses and condos:
Here:
6.6
State:
6.4
Median number of rooms in apartments:
Here:
4.9
State:
4.1
Notable locations in this zip code not listed on our city pages
Size of family households: 149 2-persons, 13 3-persons, 55 4-persons, 22 5-persons, 17 6-persons
Size of nonfamily households: 129 1-person, 61 2-persons
245 married couples with children.
13 single-parent households (9 men, 4 women).
92.6% of residents of 61777 zip code speak English at home.
5.7% of residents speak Spanish at home (100% very well).
1.2% of residents speak Asian or Pacific Island language at home (100% very well).
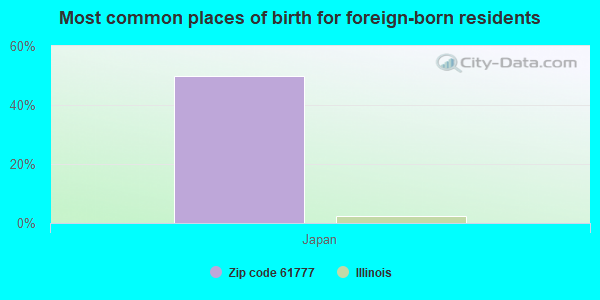
Foreign born population: 2 (0.2%) (100.0% of them are naturalized citizens)
This zip code:
0.2%
Whole state:
14.4%
50%Japan
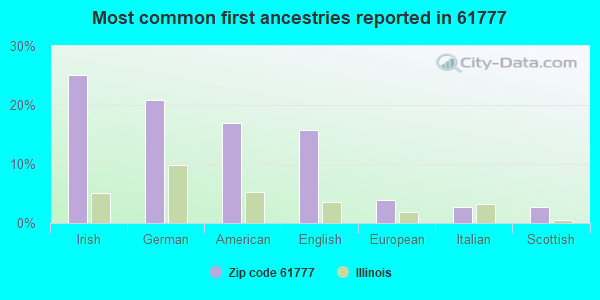
25%Irish
21%German
17%American
16%English
4%European
3%Italian
3%Scottish
Year of entry for the foreign-born population
02010 or later
02000 to 2009
01990 to 1999
1Before 1990
Facilities with environmental interests located in this zip code:
CORN BELT FS INC. (300 EAST CHESTNUT in WAPELLA, IL)
AIR MINOR (AIRS/AFS) (Integrated Compliance Information System) - ICIS-05-2005-0132, ENFORCEMENT/COMPLIANCE ACTIVITY FORMAL ENFORCEMENT ACTION (Integrated Compliance Information System) - ICIS-05-2005-0132, ENFORCEMENT/COMPLIANCE ACTIVITY (Resource Conservation and Recovery Act (tracking hazardous waste)) Business SIC classification: FERTILIZERS, MIXING ONLY Alternative names: CORN BELT FS INCORPORATED WAPELLA
NOBLE BEAR CO INC (RT 51 in WAPELLA, IL)
STATE MASTER (Illinois EPA Project) - AIR PROGRAM AIR MINOR (AIRS/AFS) Business SIC classification: NONCLASSIFIABLE ESTABLISHMENTS
Housing units lacking complete kitchen facilities: 0.2%
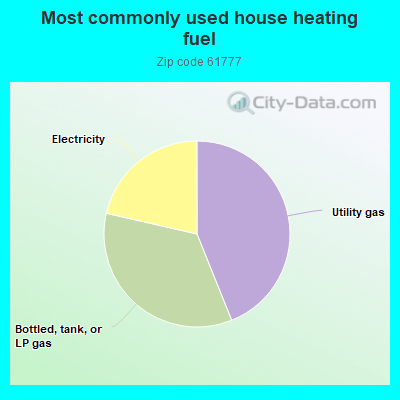
44.1%Utility gas
34.8%Bottled, tank, or LP gas
21.5%Electricity
Population in 1990: 1,031.
Place of birth for U.S.-born residents:
This state: 913
Northeast: 19
Midwest: 20
South: 46
West: 27
53% of the 61777 zip code residents lived in the same house 5 years ago. Out of people who lived in different houses, 41% lived in this county. Out of people who lived in different counties, 50% lived in Illinois.
95% of the 61777 zip code residents lived in the same house 1 year ago. Out of people who lived in different houses, 15% moved from this county. Out of people who lived in different houses, 15% moved from different county within same state. Out of people who lived in different houses, 76% moved from different state.
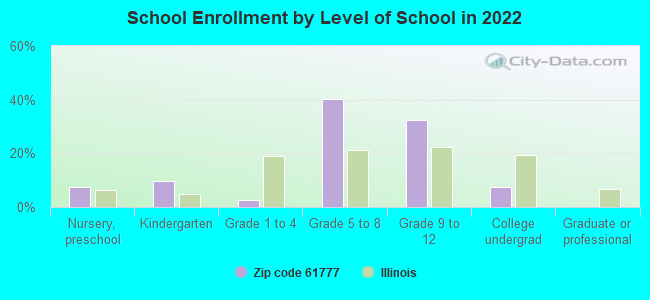
Private vs. public school enrollment:
Students in private schools in grades 1 to 8 (elementary and middle school): 6
Here:
6.4%
Illinois:
13.3%
Students in private schools in grades 9 to 12 (high school):
Here:
0.0%
Illinois:
9.9%
Students in private undergraduate colleges: 1
Here:
10.7%
Illinois:
27.4%
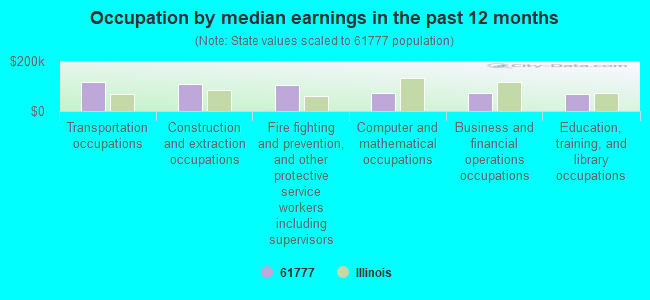
Occupation by median earnings in the past 12 months ($)
117,749Transportation occupations
106,582Construction and extraction occupations
104,356Fire fighting and prevention, and other protective service workers including supervisors
73,492Computer and mathematical occupations
72,304Business and financial operations occupations
66,426Education, training, and library occupations
Top industries in this zip code by the number of employees in 2005:
Other Services (except Public Administration): Religious Organizations (5-9: 1, 1-4: 1)
Wholesale Trade: Grain and Field Bean Merchant Wholesalers (5-9: 1)
Accommodation and Food Services: Drinking Places (Alcoholic Beverages) (1-4: 2)
Construction: Poured Concrete Foundation and Structure Contractors (1-4: 1)
Construction: New Single-Family Housing Construction (except Operative Builders) (1-4: 1)
Other Services (except Public Administration): General Automotive Repair (1-4: 1)
2002 - 2018 National Fire Incident Reporting System (NFIRS) incidents
Based on the data from the years 2002 - 2018 the average number of fires per year is 14. The highest number of fires - 36 took place in 2014, and the least - 6 in 2002. The data has a rising trend.
When looking into fire subcategories, the most incidents belonged to: Outside Fires (46.3%), and Structure Fires (34.4%).
Fire incident types reported to NFIRS in Zip Code 61777

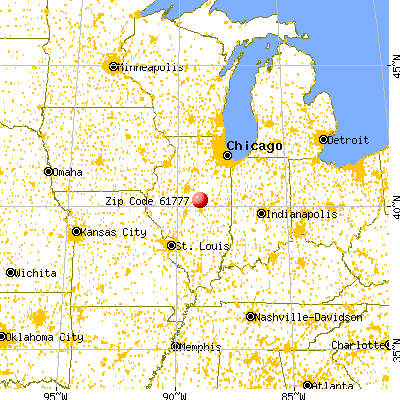


 Nearest zip codes: 61745, 61727, 61735, 61778, 61750, 61705.


 Based on the data from the years 2002 - 2018 the average number of fires per year is 14. The highest number of fires - 36 took place in 2014, and the least - 6 in 2002. The data has a rising trend.
 When looking into fire subcategories, the most incidents belonged to: Outside Fires (46.3%), and Structure Fires (34.4%).